CP 3-1. (Continued)
Discussion of Ratios
While Lamar Swimwear is expanding its sales much more rapidly than
In terms of profitability, the profit margin is declining over time. This is
surprising in light of the 56.25 percent increase in sales over two years
Return on equity is higher than the industry average the first year, and
then also falls far below it. This decline is particularly significant in light
The previously mentioned slower turnover of assets can be analyzed
This can also be stated in terms of an average collection period that has
We can summarize the discussion of the turnover ratios by saying that
CP 3-1. (Continued)
The liquidity ratios also are not encouraging. Both the current and quick
The debt-to-total-assets ratio is particularly noticeable in regard to
industry comparisons. Lamar Swimwear has gone from being only 6.11
Finally, we see that the firm has a slower growth rate in earnings per
share than the industry. This is a function of less rapid growth in
Investment Comments:
He would probably have difficulty justifying such an investment based
on the performance of the firm. There are no dividend payouts, so return
Comprehensive Problem 2

Sun Microsystems (trends, ratios stock performance) (LO3) Sun Microsystems is a leading
supplier of computer-related products, including servers, workstations, storage devices, and
network switches.
In the letter to stockholders as part of the 2001 annual report, President and CEO Scott G.
McNealy offered the following remarks:
Fiscal 2001 was clearly a mixed bag for Sun, the industry, and the economy as a whole. Still,
we finished with revenue growth of 16 percent—and that’s significant. We believe it’s a good
indication that Sun continued to pull away from the pack and gain market share. For that, we
owe a debt of gratitude to our employees worldwide, who aggressively brought costs down—
even as they continued to bring exciting new products to market.
The statement would not appear to be telling you enough. For example, McNealy says the
year was a mixed bag with revenue growth of 16 percent. But what about earnings? You can
delve further by examining the income statement in Exhibit 1. Also, for additional analysis of
other factors, consolidated balance sheet(s) are presented in Exhibit 2 on page 92.
1. Referring to Exhibit 1, compute the annual percentage change in net income per common
share-diluted (second numerical line from the bottom) for 1998–1999, 1999–2000, and
2000–2001.
2. Also in Exhibit 1, compute net income/net revenue (sales) for each of the four years.
Begin with 1998.
3. What is the major reason for the change in the answer for Question 2 between 2000 and
2001? To answer this question for each of the two years, take the ratio of the major
income statement accounts to net revenues (sales).
Cost of sales
Research and development
Selling, general and administrative expense
Provision for income tax
4. Compute return on stockholders’ equity for 2000 and 2001 using data from Exhibits 1
and 2.
Comprehensive Problem 2 (Continued)
Exhibit 1
SUN MICROSYSTEMS INC.
Summary Consolidated Statement of Income (in millions)
2001 2000 1999 1998
Dollars Dollars Dollars Dollars
Net revenues………………………………………… $18,250 $15,721 $11,806 $9,862
Costs and expenses:
Cost of sales
…………………………………………………………… 10,041 7,549 5,670 4,713
Research and development
…………………………………………………………… 2,016 1,630 1,280 1,029
In 2009, Sun Microsystems was acquired by Oracle Corporation.

Selling, general and administrative
…………………………………………………………… 4,544 4,072 3,196 2,826
Goodwill amortization
…………………………………………………………… 261 65 19 .4
In-process research and development
…………………………………………………………… 77 12 121 176
Total costs and expenses………….……………. 16,939 13,328 10,286 8,748
Operating Income…………………………………. 1,311 2,393 1,520 1,114
Gain (loss) on strategic investments........... (90) 208 – –
Interest income, net……………………….……… 363 170 85 48
Litigation settlement…………………………….. – – – –
Income before taxes…………………….……….. 1,584 2,771 1,605 1,162
Provision for income taxes…………………….. 603 917 575 407
Cumulative effect of change
in accounting principle, net
……………………………..….…………………… (54) – – –
Net income………………………………..………… $ 927 $ 1,854 $ 1,030 $ 755
Net income per common share—diluted.... $ 0.27 $ 0.55 $ 0.31 $ 0.24
Shares used in the calculation of net
income per common share—diluted…........ 3,417 3,379 3,282 3,180
5. Analyze your results to Question 4 more completely by computing ratios 1, 2a, 2b, and 3b
(all from this chapter) for 2000 and 2001. Actually, the answer to ratio 1 can be found as part
of the answer to question 2, but it is helpful to look at it again.
What do you think was the main contributing factor to the change in return on stockholders’
equity between 2000 and 2001? Think in terms of the Du Pont system of analysis.
6. The average stock prices for each of the four years shown in Exhibit 1 were as follows:
1998 11¼
1999 16¾
2000 28½
2001 9½
a. Compute the price/earnings (P/E) ratio for each year. That is, take the stock price shown
above and divide by net income per common stock-dilution from Exhibit 1.
b. Why do you think the P/E has changed from its 2000 level to its 2001 level?
A brief review of P/E ratios can be found under the topic of Price-Earnings Ratio
Applied to Earnings per Share in Chapter 2.
Comprehensive Problem 2 (Continued)
Exhibit 2
SUN MICROSYSTEMS, INC
Consolidated Balance Sheets (in millions)
Assets 2001 2000
Current assets:
Cash and cash equivalents……………………………………………………………. $ 1,472 $ 1,849
Short-term investments……………………………………………………………….. 387 626

Accounts receivable, net allowances of $410 in 2001 and
$534 in 2000…………………………………………………………………………… 2,955 2,690
Inventories…………………………………………………………………………………. 1,049 557
Deferred tax assets………………………………………………………….………….. 1,102 673
Prepaids and other current assets…………………………………..……………… 969 482
Total current assets……………………………………………………………..……. $7,934 $6,877
Property, plant and equipment, net……………………………….……………….…. 2,697 2,095
Long-term investments……………………………………………………..……………. 4,677 4,496
Goodwill, net of accumulated amortization of $349 in 2001 and
$88 in 2000………………………………………………………..……………………… 2,041 163
Other assets, net…………………………………………………………………..………… 832 521
$18,181 $14,152
Liabilities and Stockholders’ Equity
Current liabilities:
Short-term borrowings………………………………………………………….…….. $ 3 $ 7
Accounts payable…………………………………………………………..…………… 1,050 924
Accrued payroll-related liabilities…………………………………………………. 488 751
Accrued liabilities and other………………………………………………………… 1,374 1,155
Deferred revenues and customer deposits…………………………………….... 1,827 1,289
Warranty reserve………………………………………………………..………………. 314 211
Income taxes payable………………………………………………………..………… 90 209
Total current liabilities…………………………………………….……………….. $5,146 $4,546
Deferred income taxes……………………………………………………..…………….. 744 577
Long-term debt and other obligations……………………………………………….. 1,705 1,720
Total debt………………………………………………………………………………… $ 7,595 $ 6,843
Commitments and contingencies
Stockholders’ equity:
Preferred stock, $0.001 par value, 10 shares authorized (1 share which
has been designated as Series A Preferred participating stock): no
shares issued and outstanding……………………………………..……………..
– –
Common stock and additional paid-in-capital, $0.00067 par value, 7,200
shares authorized; issued: 3,536 shares in 2001 and 3,495 shares in 2000... 6,238 2,728
Treasury stock, at cost: 288 shares in 2001 and 301 shares in 2000......... (2,435) (1,438)
Deferred equity compensation………………………………………………..……….. (73) (15)
Retained earnings…………………………………………………………………………… 6,885 5,959
Accumulated other comprehensive income (loss)……………………..……….. (29) 75
Total stockholders’ equity…………………………………………………..…………. $10,586 $7,309
$18,181 $14,152
7. The book values per share for the same four years discussed in the preceding question were:
1998 $1.18
1999 $1.55
2000 $2.29
2001 $3.26
a. Compute the ratio of price to book value for each year.
b. Is there any dramatic shift in the ratios worthy of note?
CP 3-2. Solution
Sun Microsystems
1. Percentage change in net income per common share—diluted
2. Profit margin
1998 1999 2000 2001
Net income $755 $1,030 $1,854 $927
=
Net revenues 9,862 11,806 15,721 18,250
7.66% 8.72% 11.79% 5.08%
3. Percent of net revenue
2000 2001
Net revenues $15,721 $18,250
Cost of sales 7,549 48.02% 10,041 55.02%
CP 3-2. (Continued)
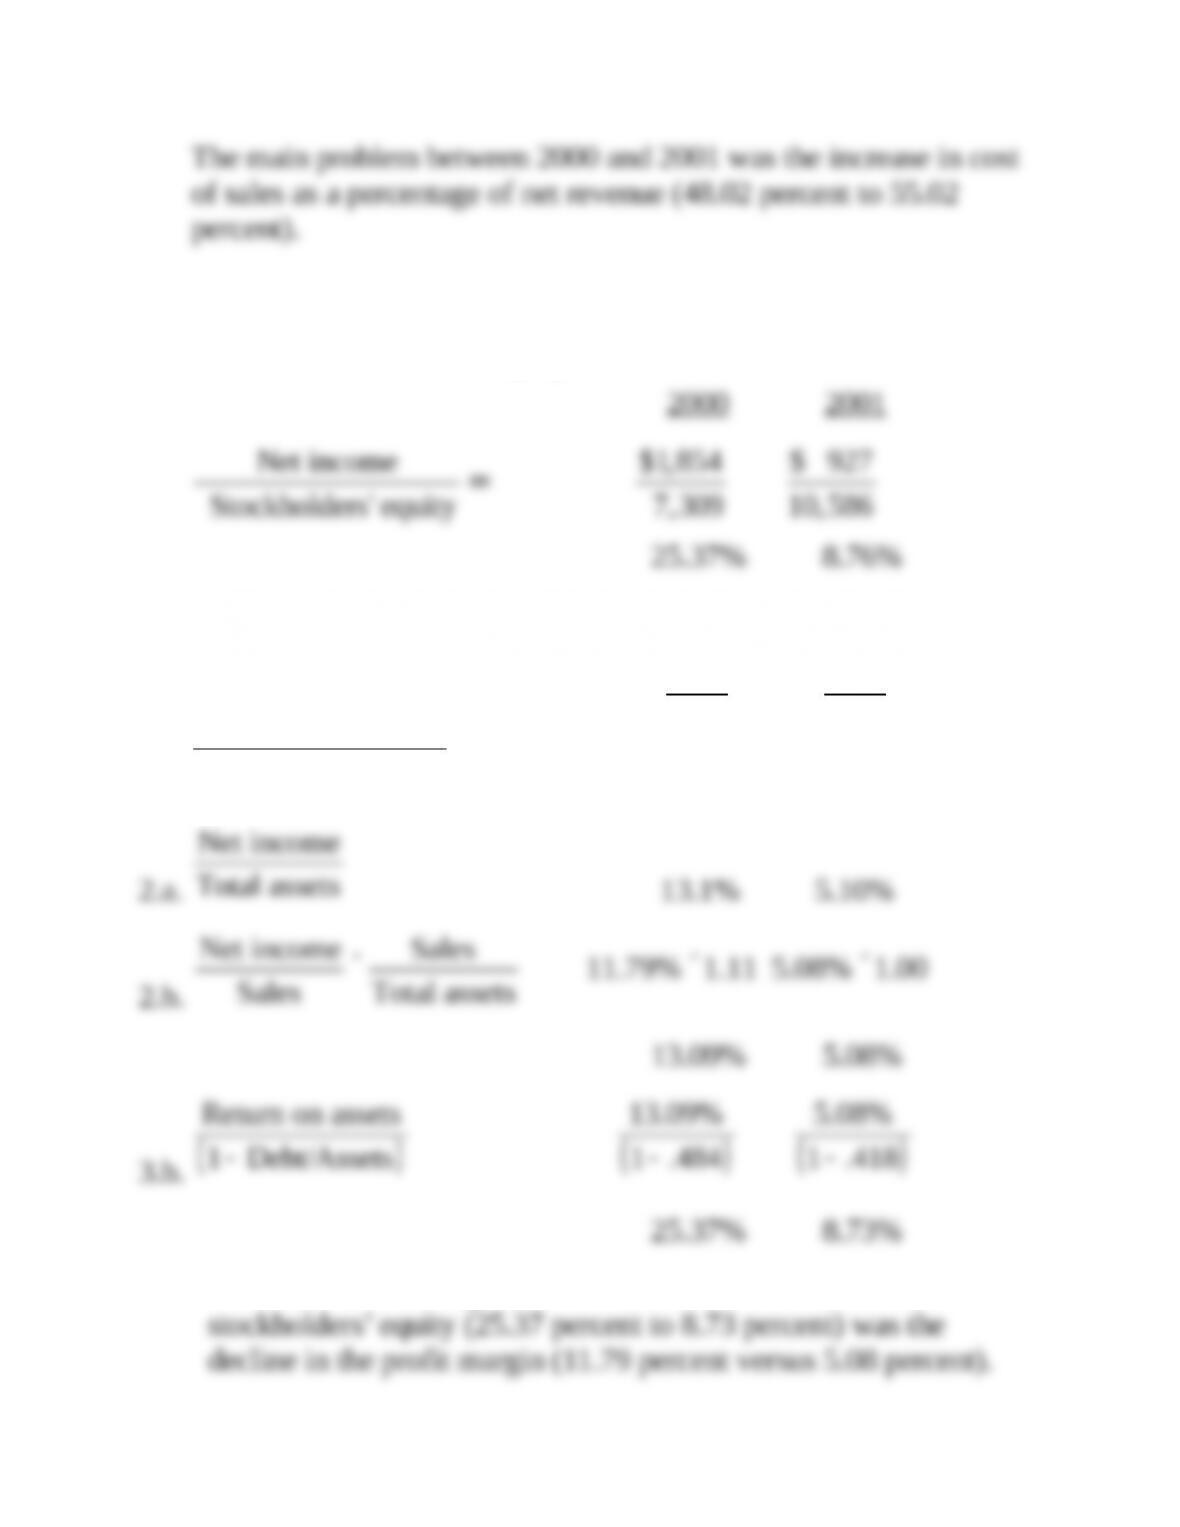
4. Return on stockholders’ equity
5.
2000 2001
1.
Net income
Net revenues (sales)
11.79% 5.08%
Net income
The main contributing factor to the decline in the return on
CP 3-2. (Continued)
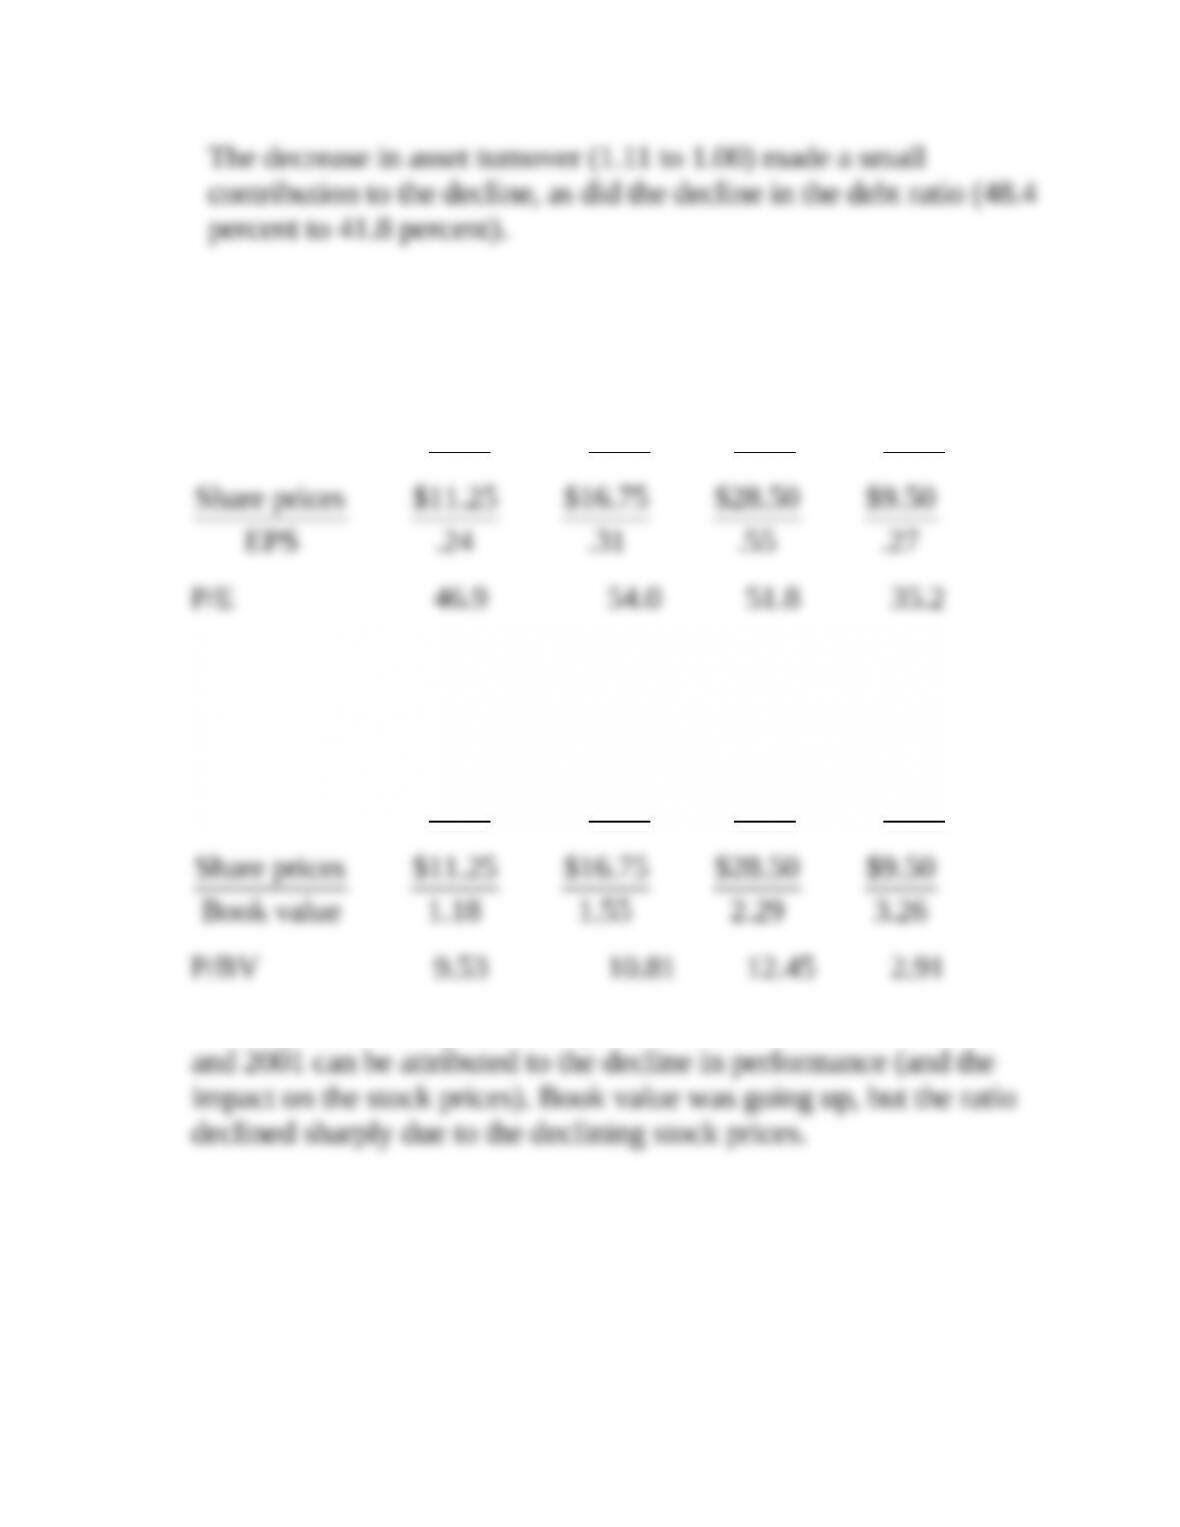
6.a. P/E = Stock price/Net income per common share—diluted (EPS)
1998 1999 2000 2001
Share prices $11.25 $16.75 $28.50 $9.50
EPS .24 .31 .55 .27
P/E 46.9 54.0 51.8 35.2
b. The sharp decline in performance caused investors to pay a lower
multiple for the stock.
7.a. Price to book value = Stock price/book value
1998 1999 2000 2001
Share prices $11.25 $16.75 $28.50 $9.50
Book value 1.18 1.55 2.29 3.26
P/BV 9.53 10.81 12.45 2.91
b. Once again, the sharp falloff in price to book value between 2000