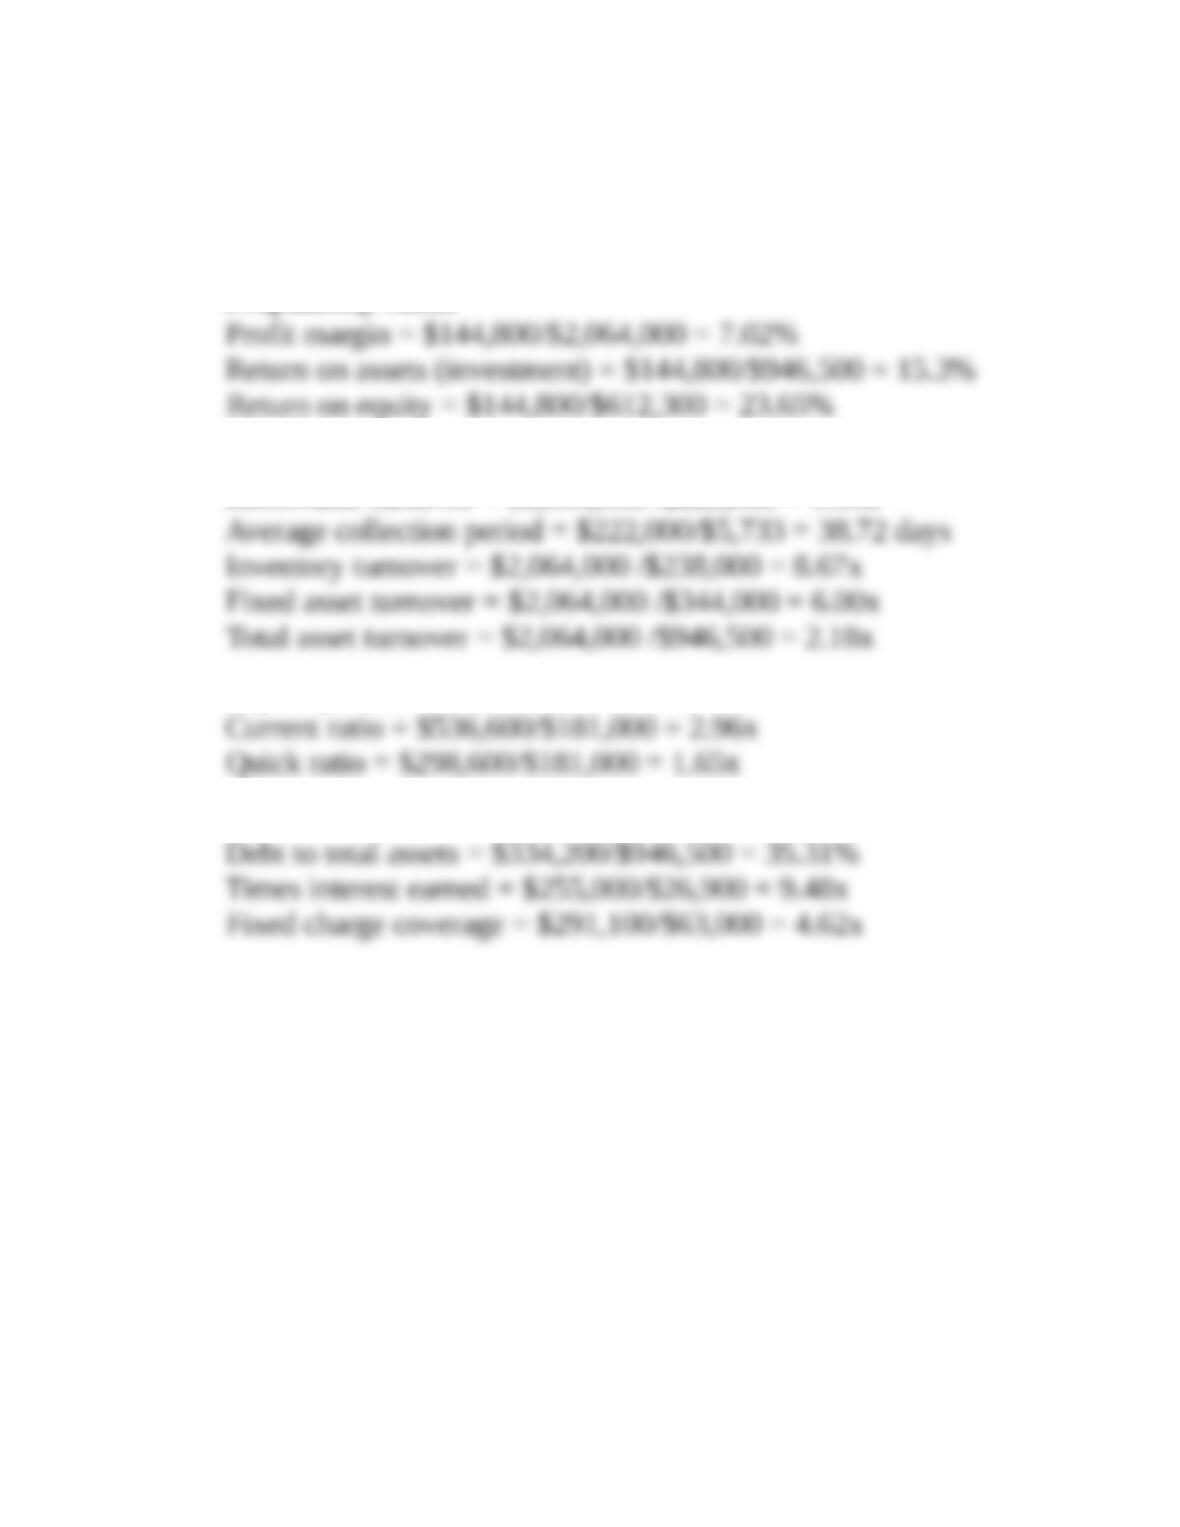
3-36. Solution:
Snider Corporation
Profitability ratios
Assets utilization ratios
Receivable turnover = $2,064,000 /$222,000 = 9.30x
Liquidity ratio
Debt utilization ratios
37. Ratio computation and analysis (LO2) Given the financial statements for Jones
Corporation and Smith Corporation shown here:
a. To which one would you, as credit manager for a supplier, approve the extension of
(short-term) trade credit? Why? Compute all ratios before answering.
b. In which one would you buy stock? Why?
JONES CORPORATION
Current Assets Liabilities
Cash…………………………………….... $ 20,000 Accounts payable
…….……….………………………… $100,000
Accounts receivable…..……….…… 80,000 Bonds payable (long-term)
…….……….………………………… 80,000
Inventory…………………..…….…….. 50,000
Long-Term Assets Stockholders’ Equity
Fixed assets……………….…….…….. $500,000 Common stock
…….……….………………………… $150,000
Less: Accumulated depreciation
(150,000)
Paid-in capital
…………………………..….…….… 70,000
Net fixed assets*…………………….. 350,000 Retained earnings
…………………………..….…….… 100,000
Total assets……….….……….……. $500,000 Total liab. and equity
…….……….………………………… $500,000
Sales (on credit)………………………………………………………..…….…….……..$1,250,000
Cost of goods sold………………………………………………………………………... 750,000
Gross profit……………………………………………………………….…….…….…….500,000
Selling and administrative expense†………………………………………………257,000
Less: Depreciation expense…………………………………………………………. 50,000
Operating profit…………………………………………………………………………....193,000
Interest expense………………………………………………………………………….... 8,000
Earnings before taxes…………………………………………………………….….…..185,000
Tax expense……………………………………………………………………………….… 92,500
Net income………………………………………………………………………..….……..$ 92,500
*Use net fixed assets in computing fixed asset turnover.
†Includes $7,000 in lease payments.
SMITH CORPORATION
Current Assets Liabilities
Cash…………………………... $ 35,000 Accounts payable………......... $ 75,000
Marketable securities...... 7,500 Bonds payable (long-term).... 210,000
Accounts receivable........ 70,000
Inventory.…………………… 75,000
Long-Term Assets Stockholders’ Equity
Fixed assets….….……....... $500,000 Common stock………………….. $ 75,000
Less: Accum. dep.
…….…………………………. (250,000) Paid-in capital………………..…. 30,000
Net fixed assets*............. 250,000 Retained earnings…………...... 47,500
Total assets
…….………………………. $437,500 Total liab. and equity…........ $437,500
*Use net fixed assets in computing fixed asset turnover.
SMITH CORPORATION
Sales (on credit)………………………………………………………..…….…….……..$1,000,000
Cost of goods sold………………………………………………………………………... 600,000
Gross profit……………………………………………………………….…….…….…….400,000
Selling and administrative expense†………………………………………………224,000
Less: Depreciation expense…………………………………………………………. 50,000
Operating profit…………………………………………………………………………....126,000
Interest expense………………………………………………………………………….... 21,000
Earnings before taxes…………………………………………………………….….…..105,000
Tax expense……………………………………………………………………………….… 52,500
Net income………………………………………………………………………..….……..$ 52,500
†Includes $7,000 in lease payments.
3-37. Solution:
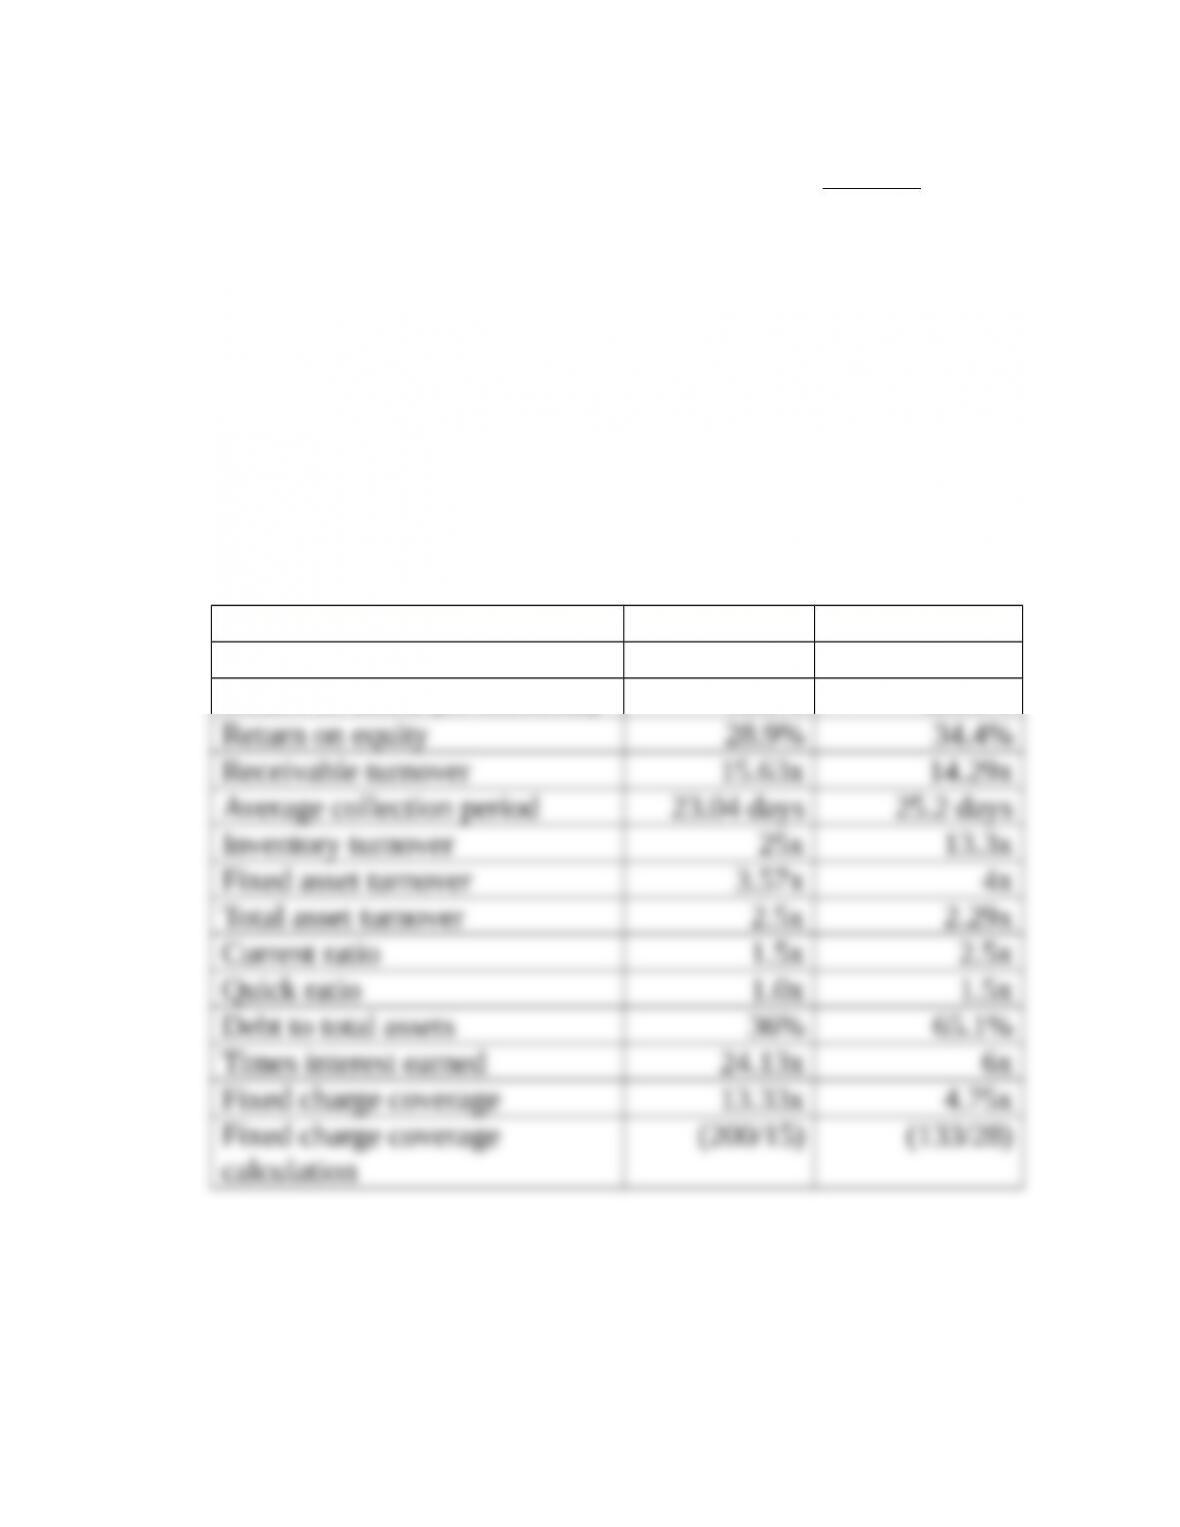
Jones and Smith Comparison
One way of analyzing the situation for each company is to
compare the respective ratios for each. Examining those ratios
which would be most important to a supplier or short-term lender
and a stockholder.
Jones Corp. Smith Corp.
Profit margin 7.4% 5.25%
Return on assets (investments) 18.5% 12.00%
calculation
3-37. (Continued)
a. Since suppliers and short-term lenders are most concerned with
liquidity ratios, Smith Corporation would get the nod as having
the best ratios in this category. One could argue, however, that
b. Stockholders are most concerned with profitability. In this
category, Jones has much better ratios than Smith. Smith does
Smith and its lower liquidity ratios could reflect better short-term asset
management. This point was covered in part a.
SMITH CORPORATION
Sales (on credit) …………………………….…….. $1,000,000
Cost of goods sold……………….…….….……... 600,000
Gross profit…………………………………….….… 400,000
Selling and administrative expense…….... 224,000
COMPREHENSIVE PROBLEM
Comprehensive Problem 1.
Lamar Swimwear (trend analysis and industry comparisons)(LO3) Bob Adkins has recently
been approached by his first cousin, Ed Lamar, with a proposal to buy a 15 percent interest in
Lamar Swimwear. The firm manufactures stylish bathing suits and sunscreen products.
Mr. Lamar is quick to point out the increase in sales that has taken place over the last three years
as indicated in the income statement, Exhibit 1. The annual growth rate is 25 percent. A balance
sheet for a similar time period is shown in Exhibit 2, and selected industry ratios are presented in
Exhibit 3. Note the industry growth rate in sales is only 10 to 12 percent per year.
There was a steady real growth of 3 to 4 percent in gross domestic product during the period
under study.
Comprehensive Problem 1 (Continued)
Exhibit 1
LAMAR SWIMWEAR
Income Sheet
20X1 20X2 20X3
Sales (all on credit)…………………….……….…….… $1,200,000 $1,500,000 $1,875,000
Cost of goods sold……………………………………….. 800,000 1,040,000 1,310,000
Gross profit………………………………..…….…….….. $ 400,000 $ 460,000 $ 565,000
Selling and administrative expense*……….......... 239,900 274,000 304,700
Operating profit (EBIT)……………………….…….… $ 160,100 $ 186,000 $ 260,300
Interest expense…………………………………………… 35,000 45,000 85,000
Net income before taxes……….…….……….…….… $ 125,100 $ 141,000 $ 175,300
Taxes…………………………………………..…….………. 36,900 49,200 55,600
Net income…………………………………………….…… $ 88,200 $ 91,800 $ 119,700
Shares………………………………………………………... 30,000 30,000 38,000
Earnings per share……………………………………..… $ 2.94 $ 3.06 $ 3.15
*Includes $15,000 in lease payments for each year.
Exhibit 2
LAMAR SWIMWEAR
Balance Sheet
Assets 20X1 20X2 20X3
Cash……………………………………….…….…….…….. $ 30,000 $ 40,000 $ 30,000
Marketable securities…………………….……….……. 20,000 25,000 30,000
Accounts receivable…………………………….………. 170,000 259,000 360,000
Inventory…………………………………………….……... 230,000 261,000 290,000
Total current assets……………………………….….. $ 450,000 $ 585,000 $ 710,000
Net plant and equipment…………………..….…….… 650,000 765,000 1,390,000
Total assets………………………………………..…….…. $1,100,000 $1,350,000 $ 2,100,000
Liabilities and Stockholders’ Equity
Accounts payable………………………………..…….… $ 200,000 $ 310,000 $ 505,000
Accrued expenses………………..….…….…….……… 20,400 30,000 35,000
Total current liabilities……………..…….………... $ 220,400 $ 340,000 $ 540,000
Long-term liabilities…………….…….…….……….… 325,000 363,600 703,900
Total liabilities……………….….…….……….…….. $ 545,400 $ 703,600 $ 1,243,900
Common stock ($2 par)……………….……….……... 60,000 60,000 76,000
Capital paid in excess of par……………..…….……. 190,000 190,000 264,000
Retained earnings………………………………………… 304,600 396,400 516,100
Total stockholders’ equity…………..….…….…… $ 554,600 $ 646,400 $ 856,100
Total liabilities and stockholders’ equity............ $1,100,000 $1,350,000 $2, 100,000
Exhibit 3
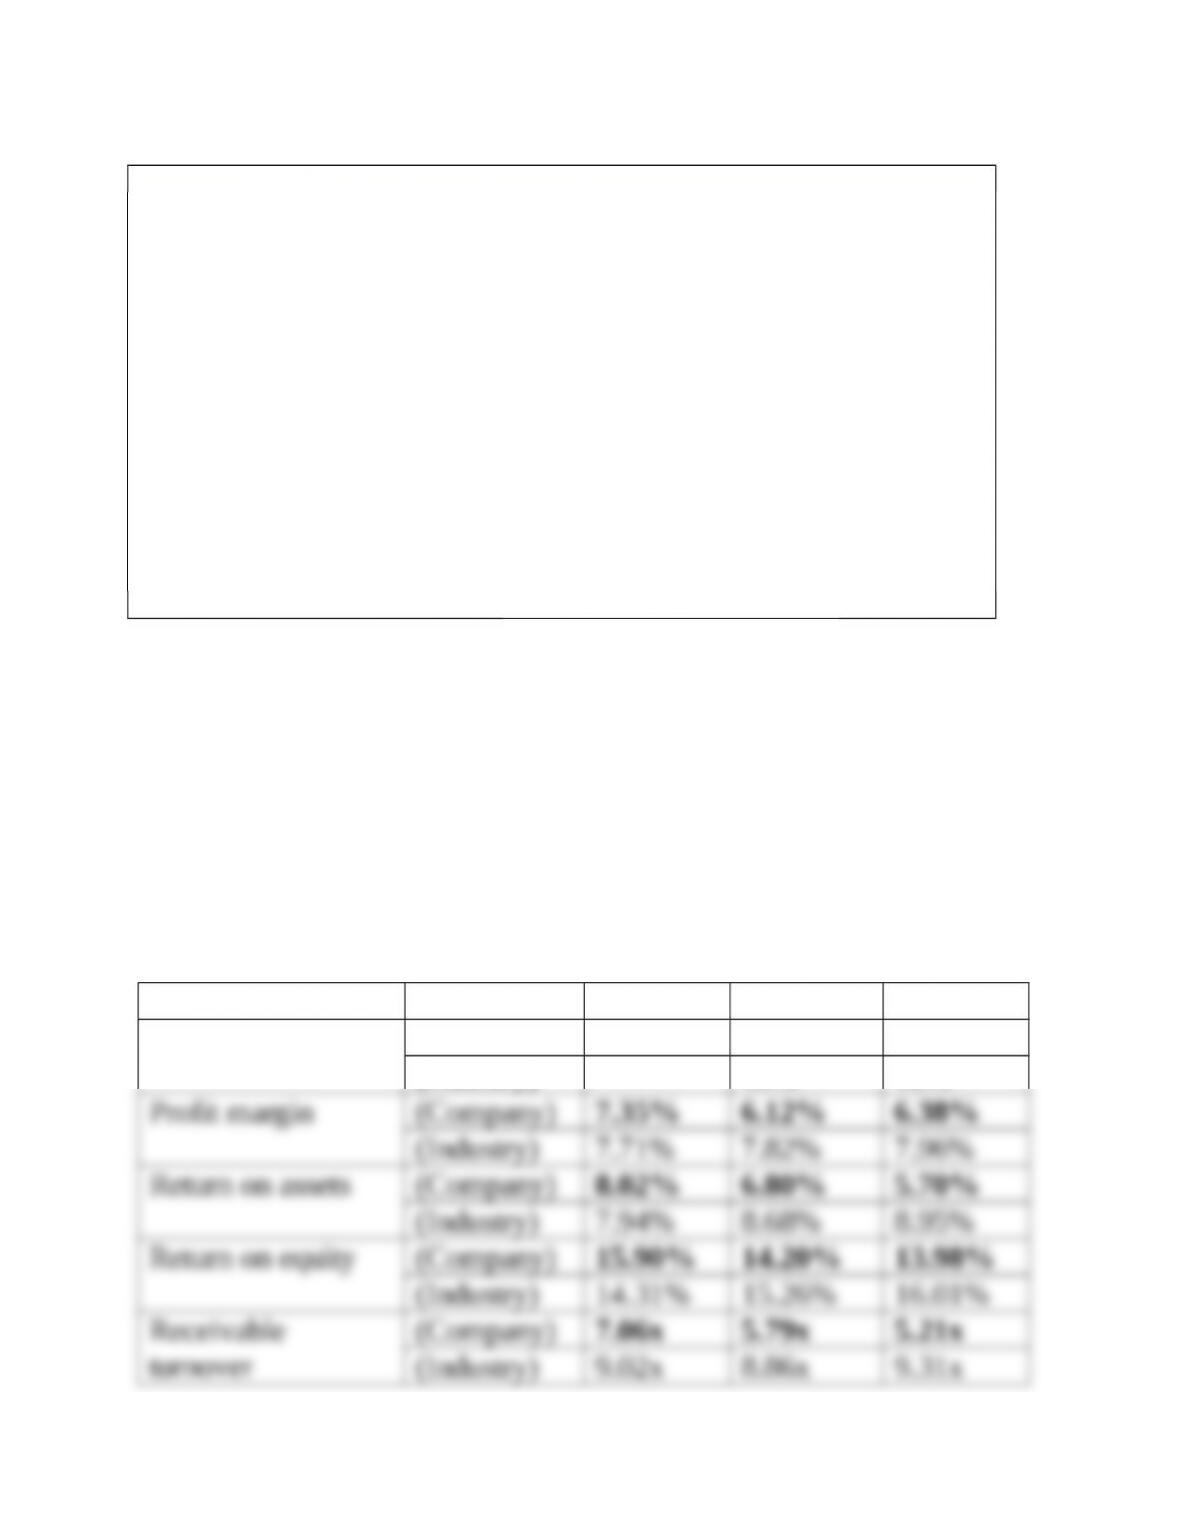
Selected Industry Ratios
20X1 20X2 20X3
Growth in sales…………..….…….………. — 10.00% 12.00%
Profit margin…………………….….…….… 7.71% 7.82% 7.96%
Return on assets (investment)…….…... 7.94% 8.86% 8.95%
Return on equity……………………………. 14.31% 15.26% 16.01%
Receivable turnover……………….……... 9.02x 8.86x 9.31x
Average collection period….….……..... 39.9 days 40.6 days 38.7 days
Inventory turnover………….…….………. 4.24x 5.10x 5.11x
Fixed asset turnover……………..…….…. 1.60x 1.64x 1.75x
Total asset turnover………………….……. 1.05x 1.10x 1.12x
Current ratio………………………….….….. 1.96x 2.25x 2.40x
Quick ratio…………………….…….………. 1.37x 1.41x 1.38x
Debt to total assets…………..….………... 43.47% 43.11% 44.10%
Times interest earned…….….……….….. 6.50x 5.99x 6.61x
Fixed charge coverage……….…….……. 4.70x 4.69x 4.73x
Growth in EPS……………….…….…….… — 10.10% 13.30%
The stock in the corporation has become available due to the ill health of a current stockholder,
who is in need of cash. The issue here is not to determine the exact price for the stock, but rather
whether Lamar Swimwear represents an attractive investment situation. Although Mr. Adkins has
a primary interest in the profitability ratios, he will take a close look at all the ratios. He has no
fast and firm rules about required return on investment, but rather wishes to analyze the overall
condition of the firm. The firm does not currently pay a cash dividend, and return to the investor
must come from selling the stock in the future. After doing a thorough analysis (including ratios
for each year and comparisons to the industry), what comments and recommendations do you
offer to Mr. Adkins?
CP 3-1. Solution:
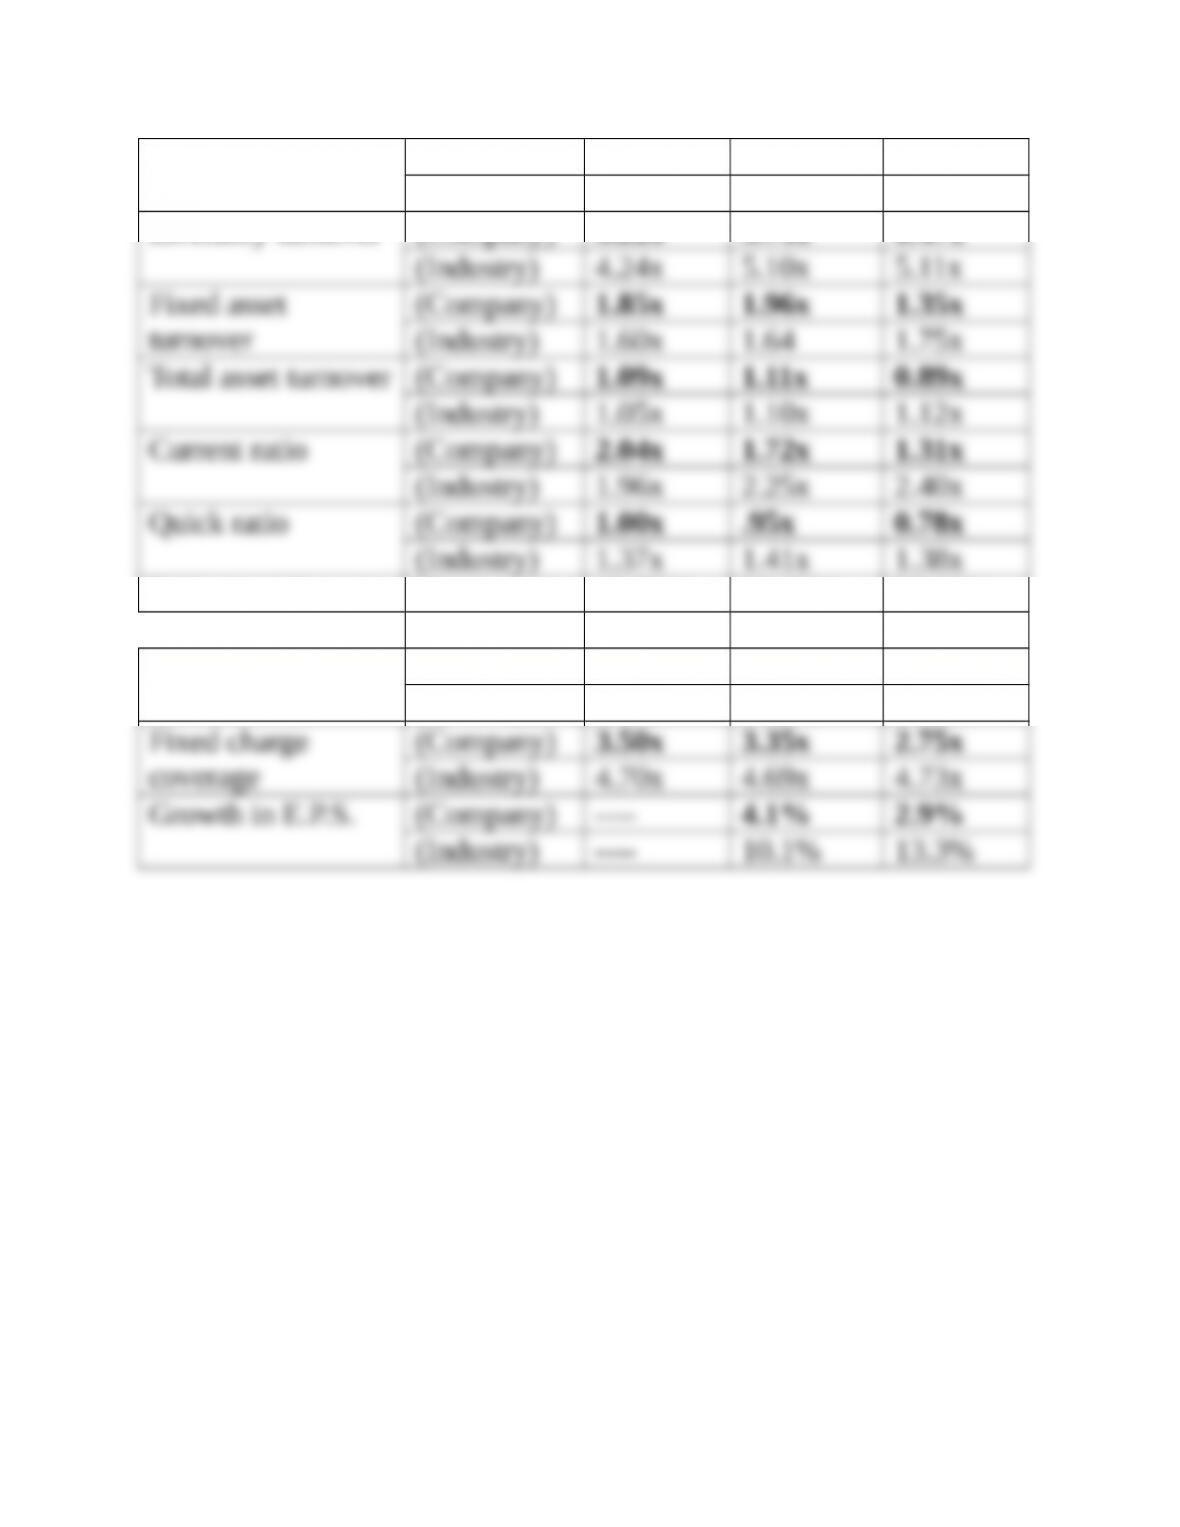
Lamar Swimwear
20X1 20X2 20X3
Growth in sales (Company) 25% 25%
(Industry) 10% 12%
Average collection
period
(Company) 51.0 days 62.2 days 69.1 days
(Industry) 39.9 days 40.6 days 38.7 days
Inventory turnover (Company) 5.22x 5.75x 6.47x
Debt to total assets (Company) 49.58% 52.12% 59.23%
(Industry) 43.47% 43.11% 44.10%
Times interest
earned
(Company) 4.57x 4.13x 3.06x
(Industry) 6.50x 5.99x 6.61x