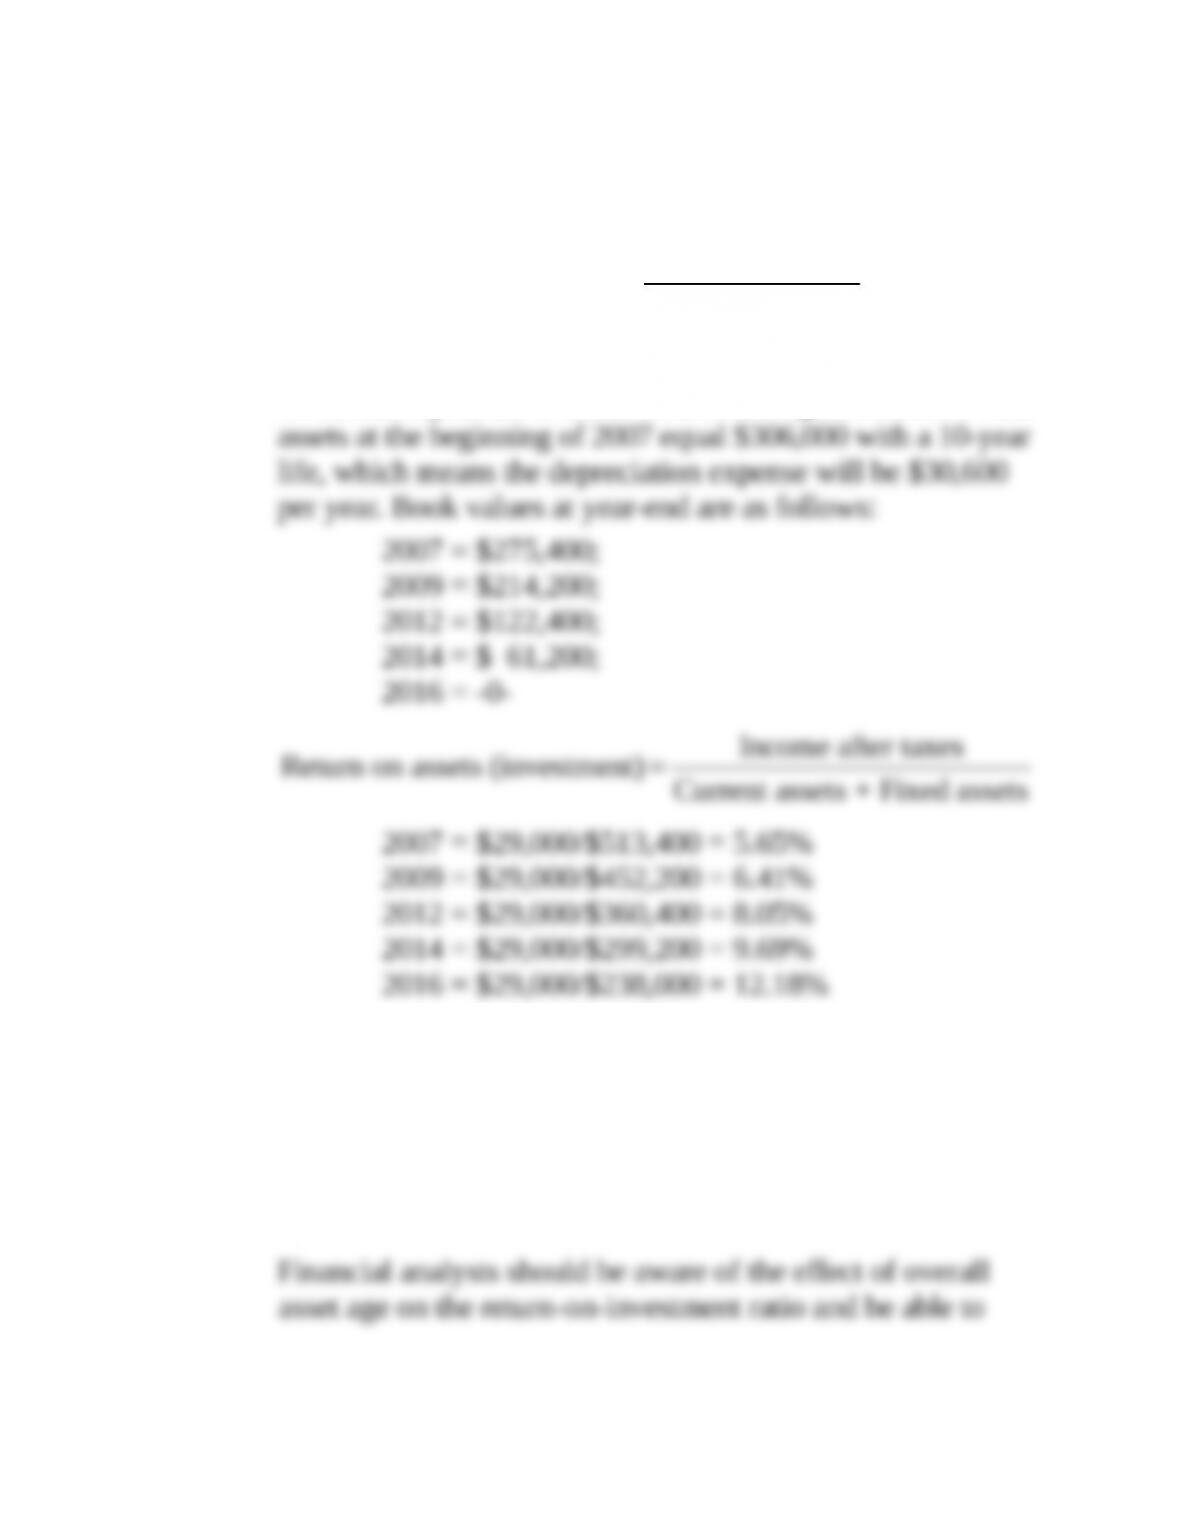
3-26. Solution:
Status Quo Company
a.
Income after taxes
Return on assets (investment)= Total assets
The return on assets for Status Quo will increase over time as
the assets depreciate and the denominator gets smaller. Fixed
3-26. (Continued)
b. The increasing return on assets over time is due solely to the
fact that annual depreciation charges reduce the amount of
investment. The increasing return is in no way due to
operations.
27. Trend analysis (LO4) Jolie Foster Care Homes Inc. shows the following data:
Year Net Income Total Assets Stockholders’ Equity Total Debt
20X1 $155,000 $2,390,000 $ 761,000 $1,629,000
20X2 191,000 2,700,000 966,000 1,734,000
20X3 208,000 2,730,000 1,770,000 960,000
20X4 192,000 2,470,000 2,220,000 250,000
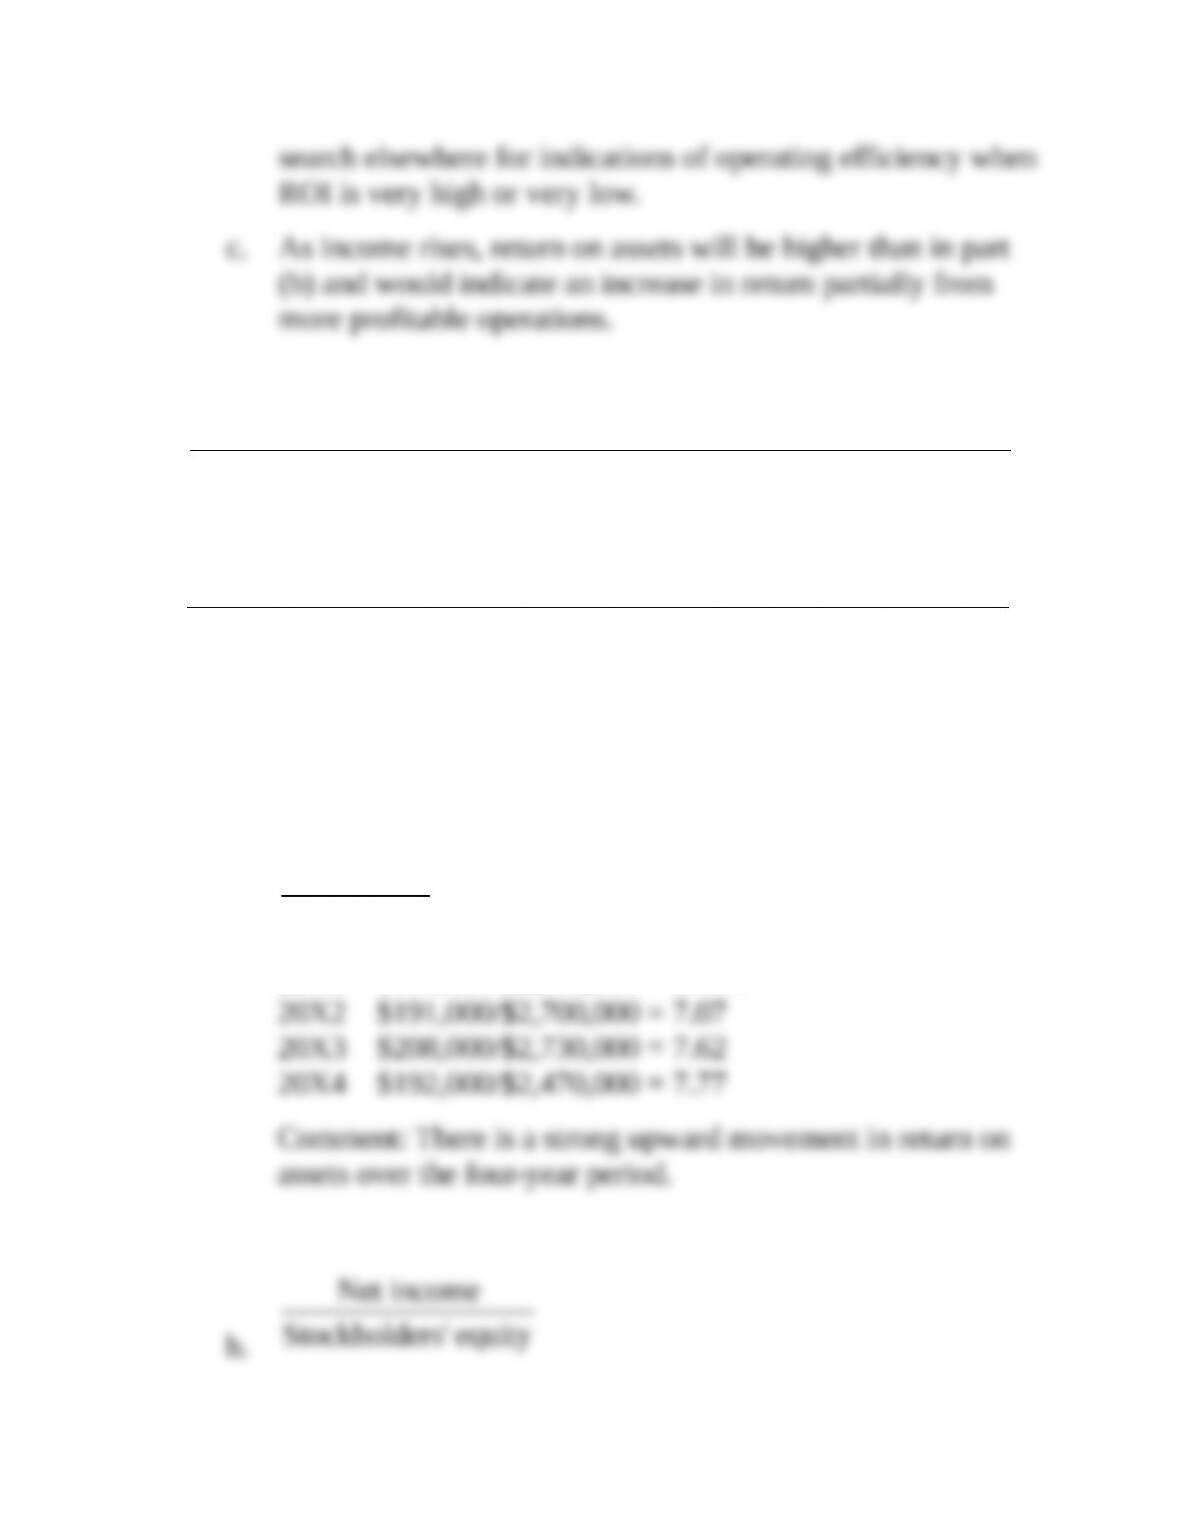
a. Compute the ratio of net income to total assets for each year and comment on the trend.
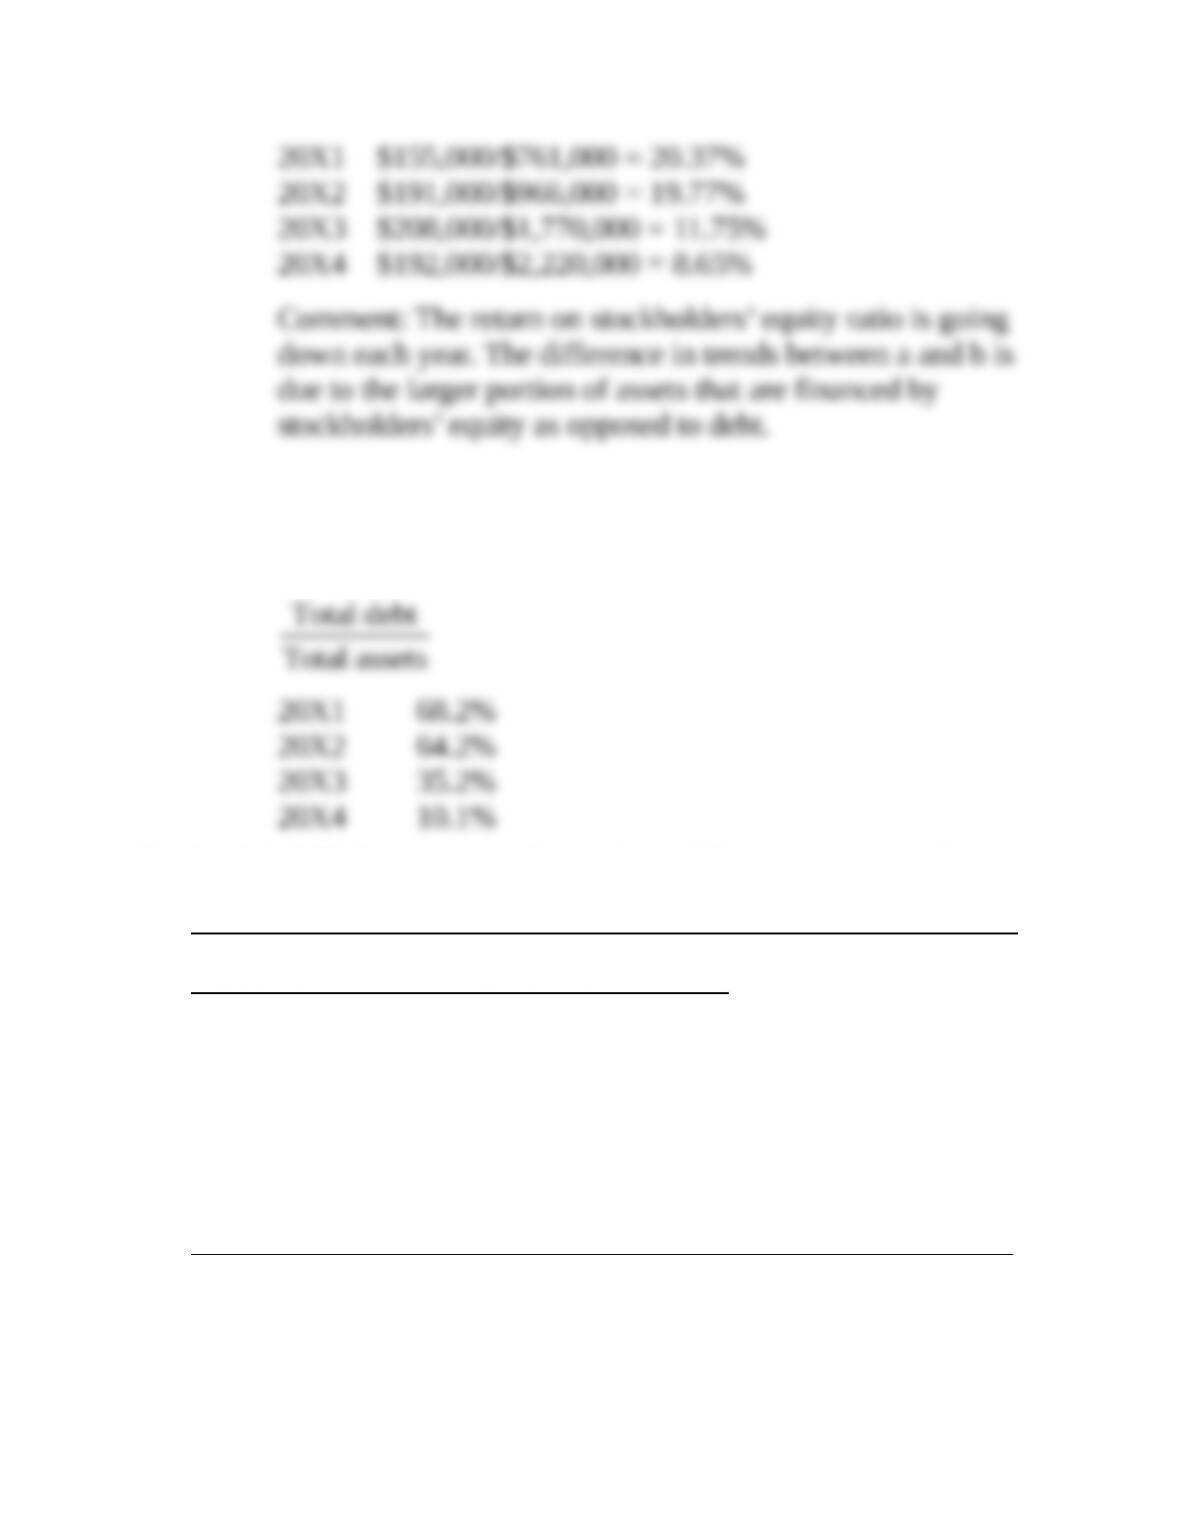
b. Compute the ratio of net income to stockholders’ equity and comment on the trend.
Explain why there may be a difference in the trends between parts a and b.
3-27. Solution:
Jolie Foster Care Homes Inc.
a.
Net income
Total assets
20X1 $155,000/$2,390,000 = 6.49%
3-27. (Continued)
Optional: This can be confirmed by computing total debt to
total assets for each year.
Total debt
Total assets
20X1 68.2%
20X2 64.2%
20X3 35.2%
20X4 10.1%
Trend analysis (LO4) Quantum Moving Company has the following data. Industry information
also is shown.
Industry Data on
Company Data Net Income/Total Assets
Year Net Income Total Assets
20X1 $424,000 $2,843,000 14.0%
20X2 428,000 3,267,000 9.8
20X3 412,000 3,834,000 3.9
Industry Data on
Year Debt Total Assets Debt/Total Assets
20X1 $1,722,000 $2,843,000 56.6%
20X2 1,732,000 3,267,000 42.0
20X3 1,950,000 3,834,000 38.0
As an industry analyst comparing the firm to the industry, are you likely to praise or
criticize the firm in terms of the following:
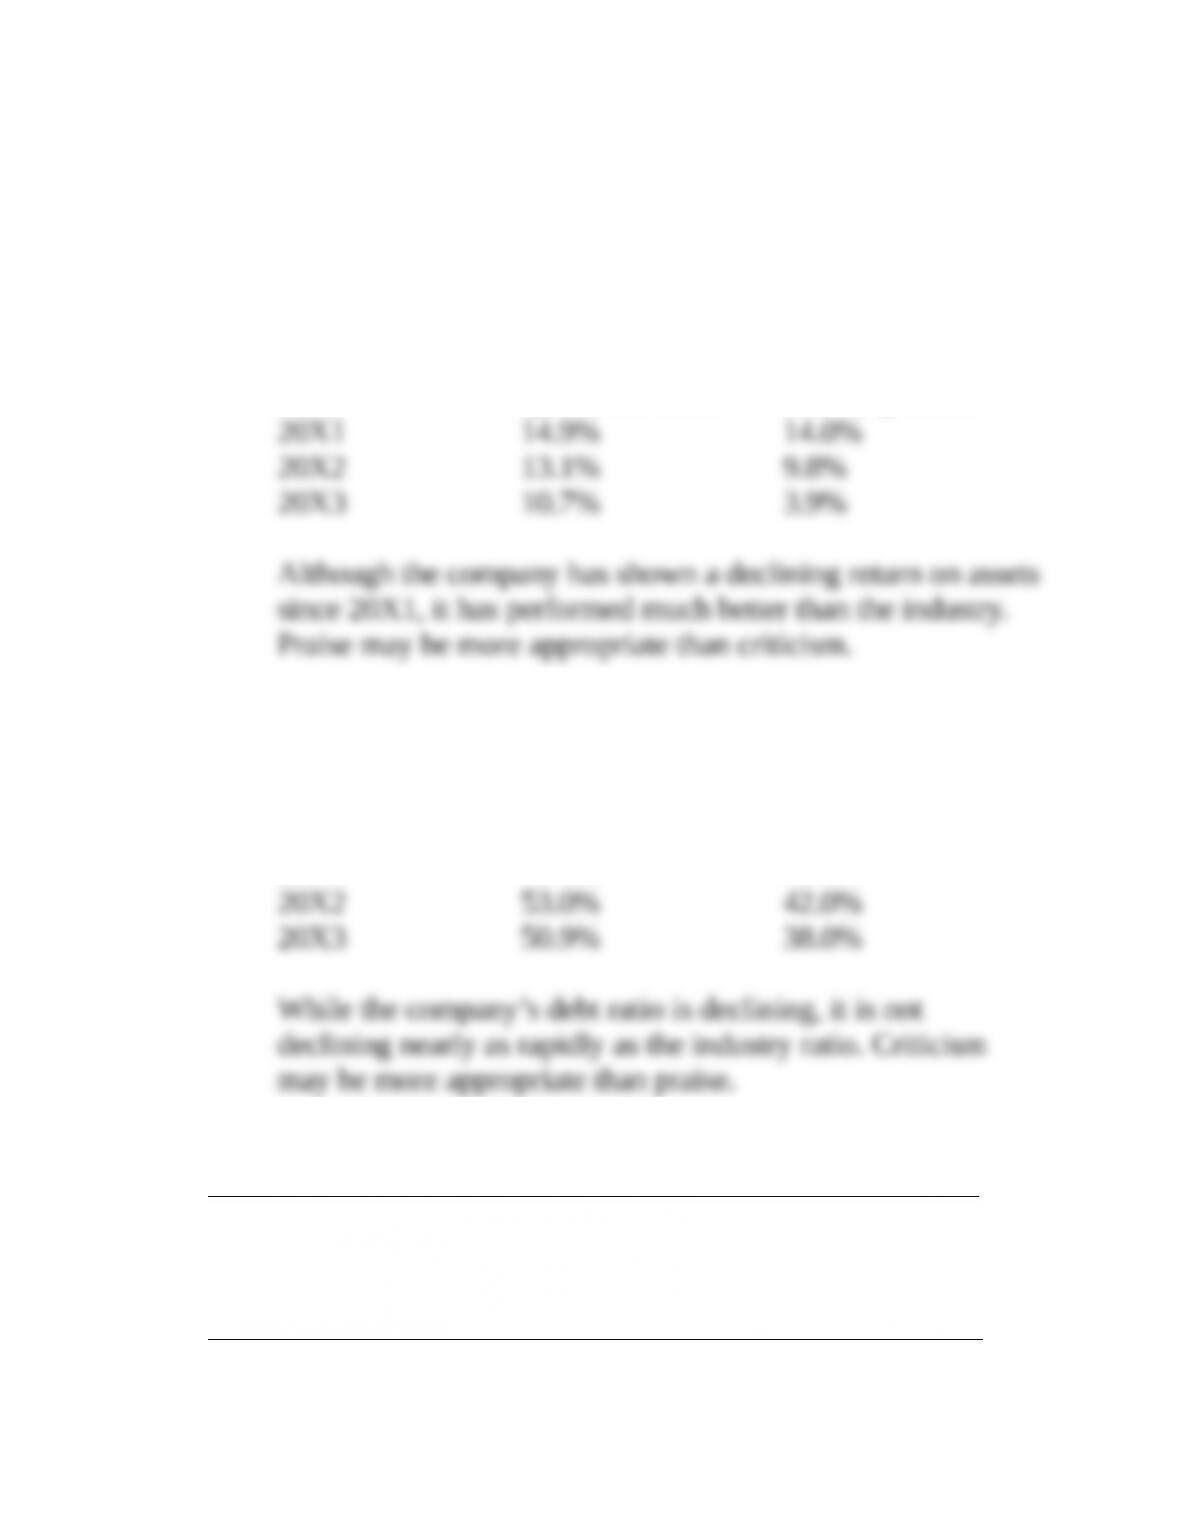
a. Net income/Total assets.
b. Debt/Total assets.
3-28. Solution:
Quantum Moving Company
a. Net income/total assets
Year Quantum Ratio Industry Ratio
3-28. (Continued)
b. Debt/total assets
Year Quantum Ratio Industry Ratio
20X1 60.6% 56.6%
29. Analysis by divisions (LO2) The Global Products Corporation has three subsidiaries.
Medical Supplies Heavy Machinery Electronics
Sales………………………………… $20,040,000 $5,980,000 $4,730,000
Net income (after taxes)….….. 1,700,000 592,000 402,000
Assets…………………..………….. 8,340,000 8,760,000 3,570,000
.
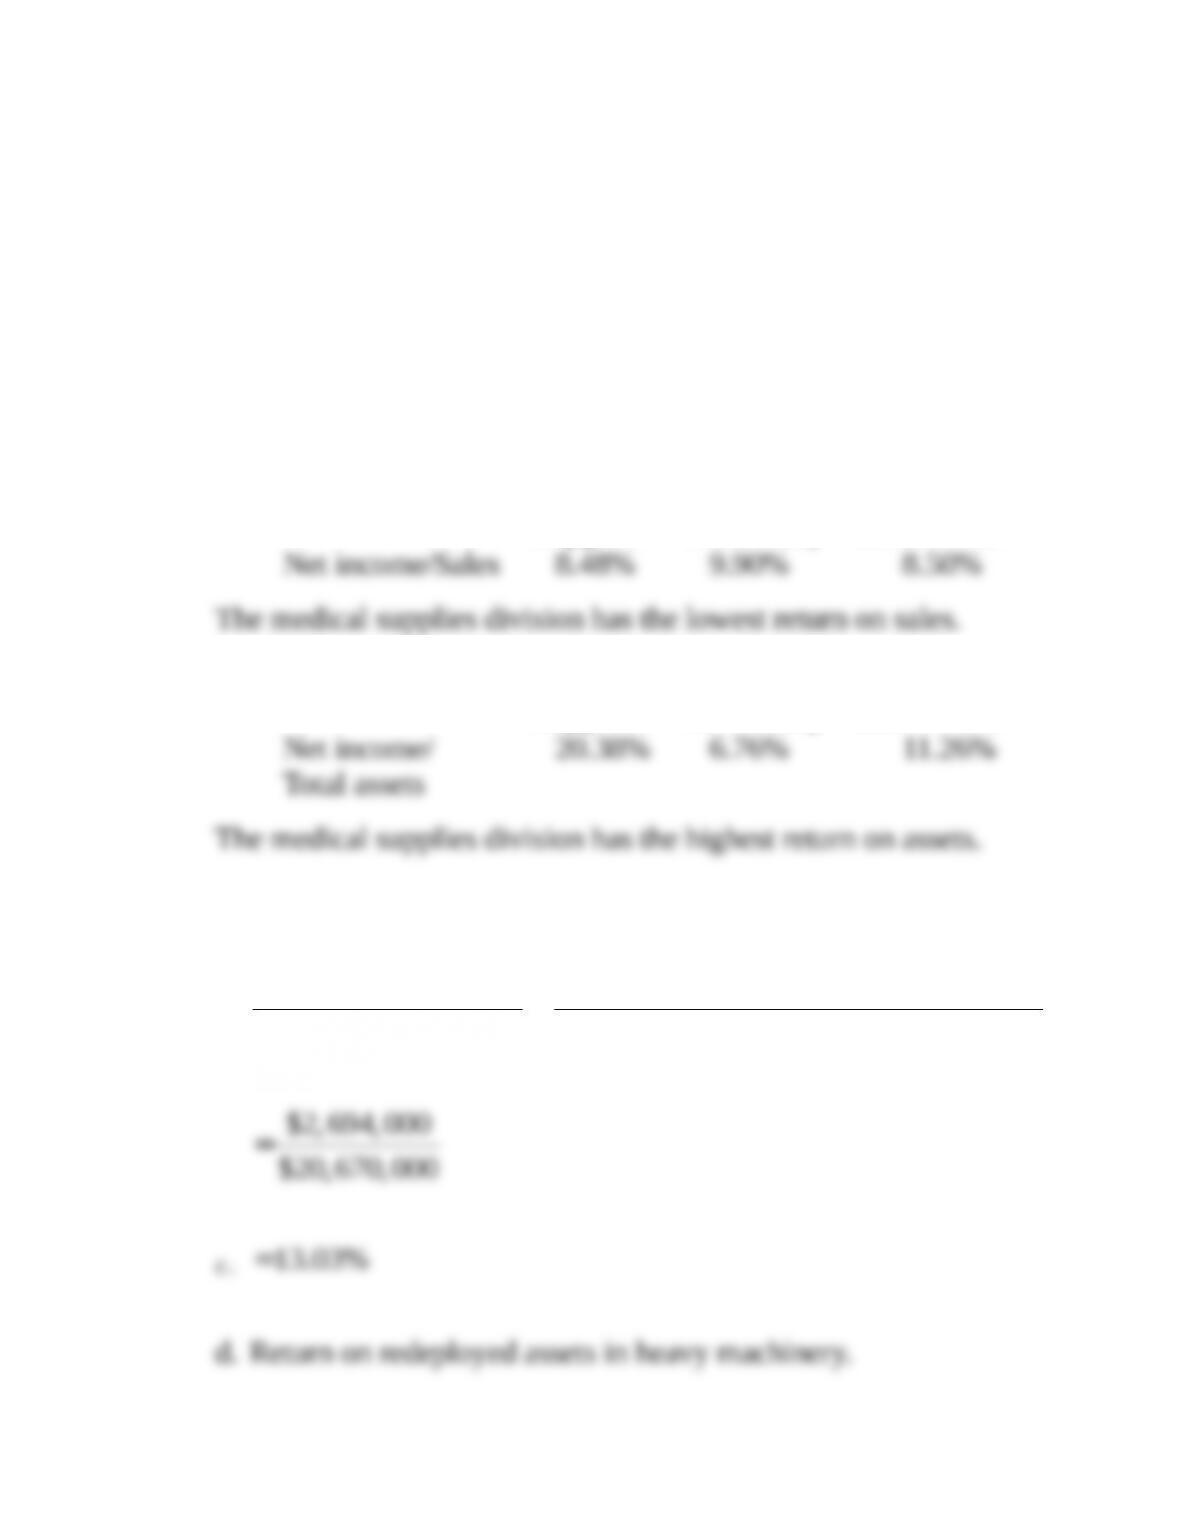
a. Which division has the lowest return on sales?
b. Which division has the highest return on assets?
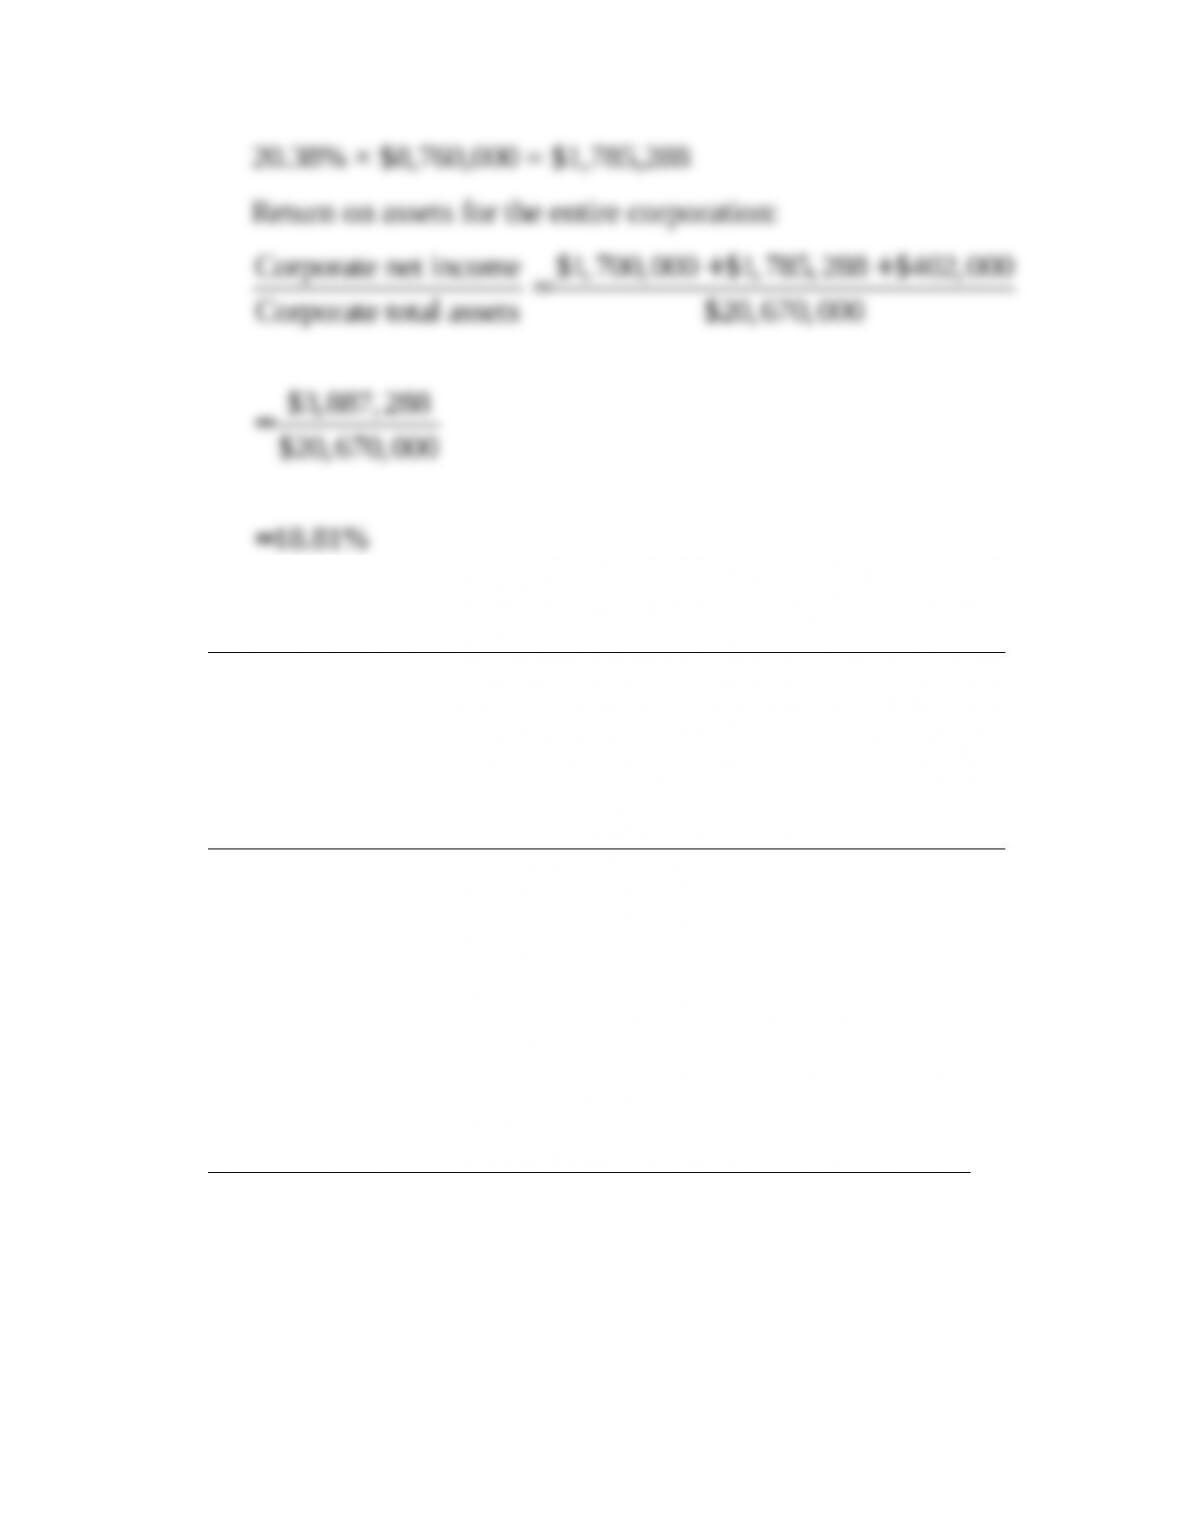
c. Compute the return on assets for the entire corporation.
d. If the $8,760,000 investment in the heavy machinery division is sold off and
redeployed in the medical supplies subsidiary at the same rate of return on assets
currently achieved in the medical supplies division, what will be the new return on
assets for the entire corporation?
3-29. Solution:
Global Products Corporation
a. Medical Heavy
Supplies Machinery Electronics
b. Medical Heavy
Supplies Machinery Electronics
3-29. (Continued)
Corporate net income $1,700,000 $592,000 $402, 000
Corporate total assets $8,340,000 $8,760,000 $3,570,000
$2,694,000
$20,670,000
+ +
=+ +
=
d. Return on redeployed assets in heavy machinery.
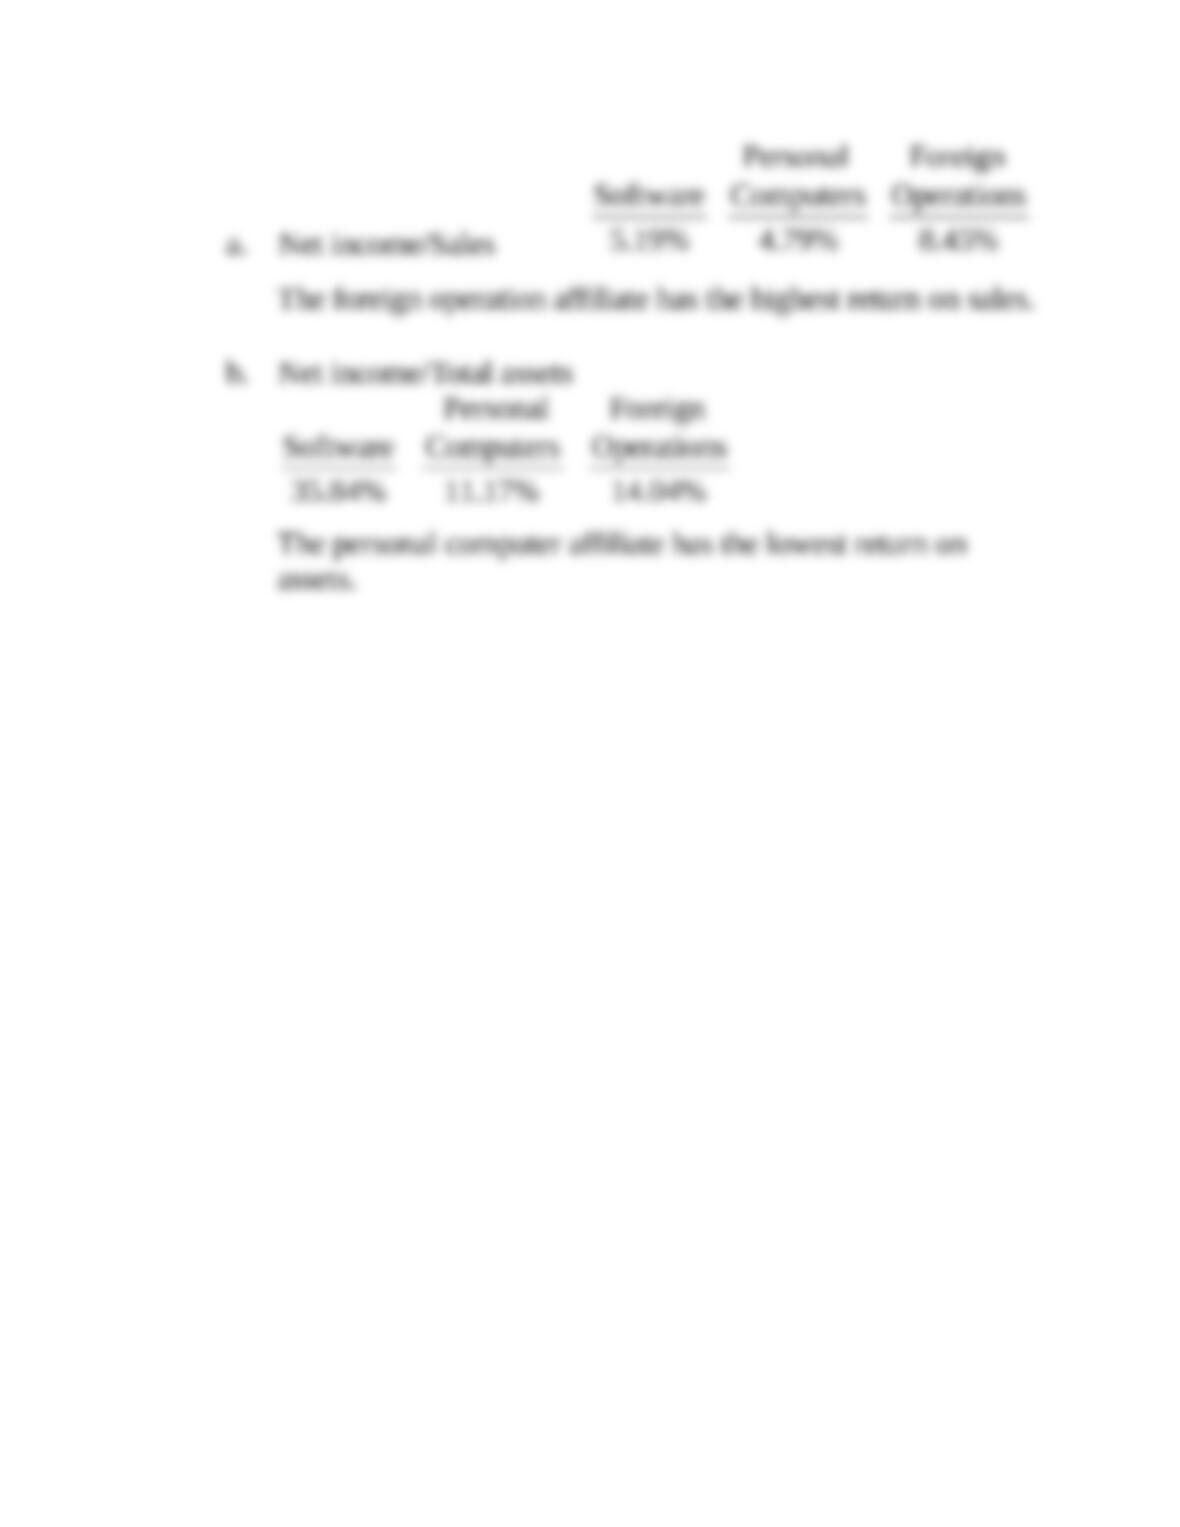
Personal Foreign
Software Computers Operations
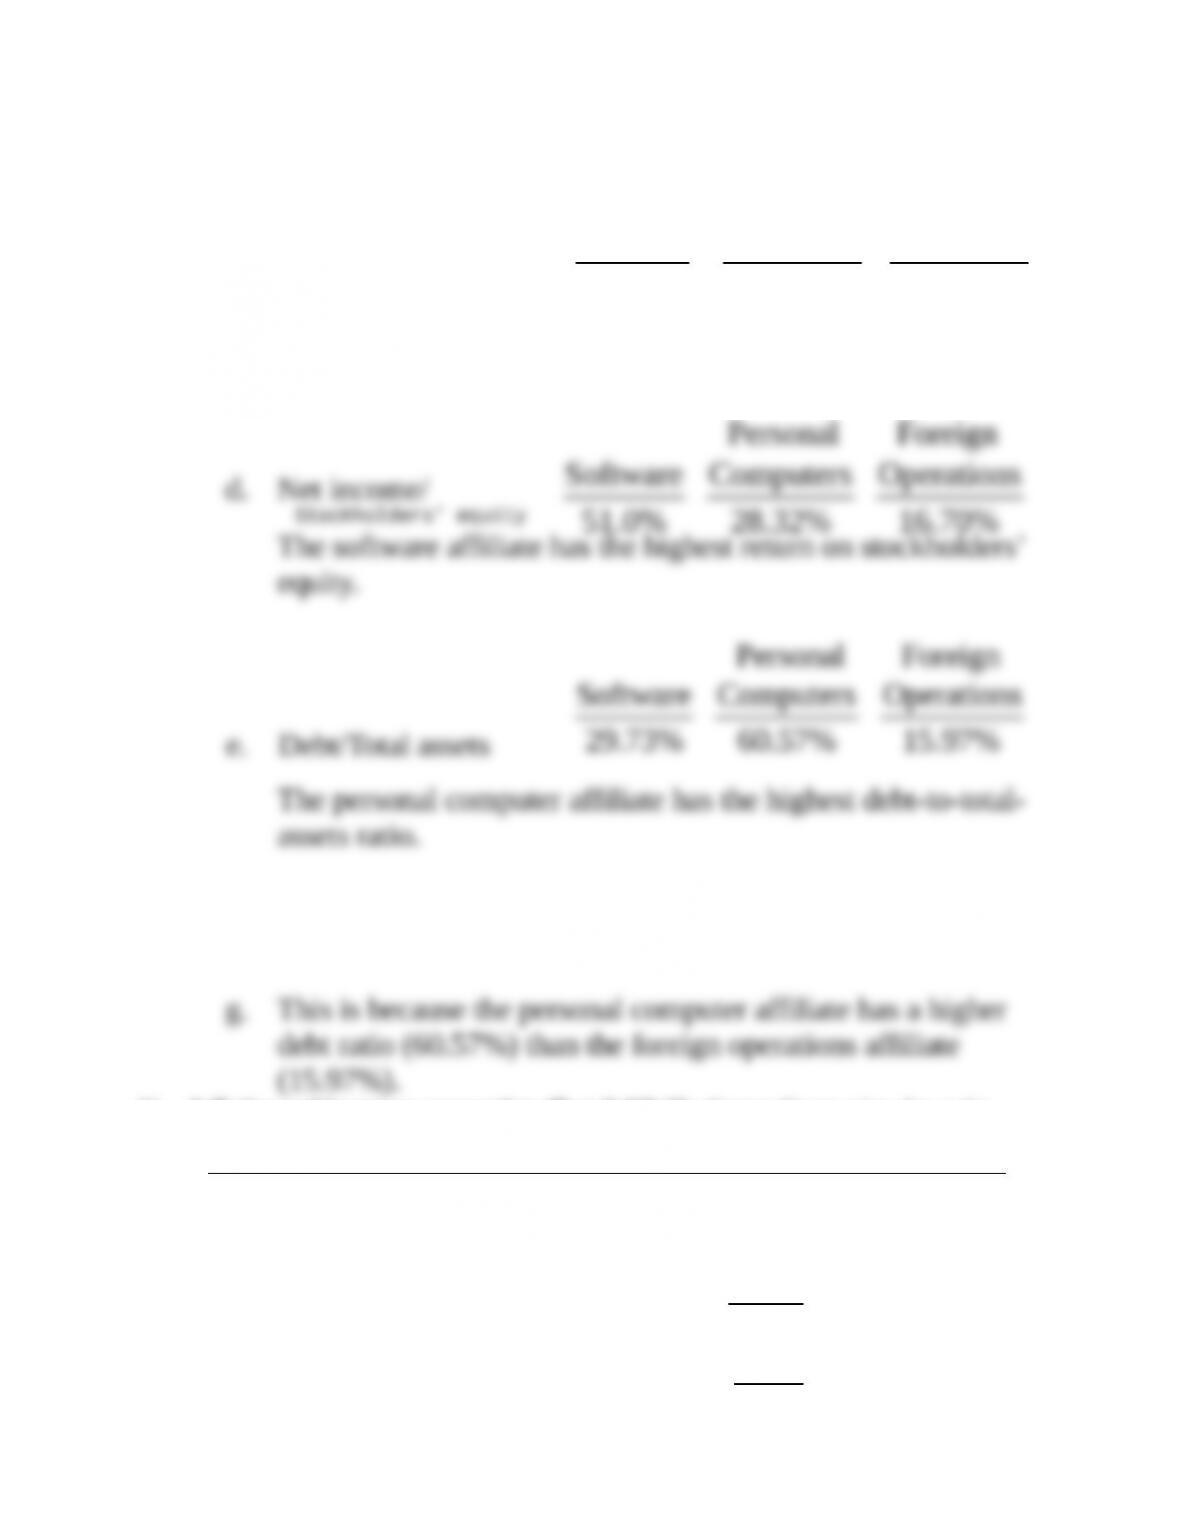
3-30. (Continued)
c. Sales/Total assets
Personal Foreign
Software Computers Operations
6.91x 2.33x 1.66x
The software affiliate has the highest return on total asset
turnover.
f. This is because of its high total asset turnover ratio of 6.91x
in part c.
31. Inflation and inventory accounting effect (LO5) The Canton Corporation shows the
following income statement. The firm uses FIFO inventory accounting.
CANTON CORPORATION
Income Statement for 20X1
Sales…………………………………………………………… $272,800 (17,600 units at $15.50)
Cost of goods sold………………………………………... 123,200 (17,600 units at $7.00)
Gross profit……………………………….………………… 149,600
Selling and administrative expense……………….... 13,640
Depreciation………………………………………………… 15,900
Personal Foreign
Software Computers Operations
Operating profit………………………………………….... 120,060
Taxes (30%)………………………………..………………. 36,018
Aftertax income…………………………………………… $ 84,042
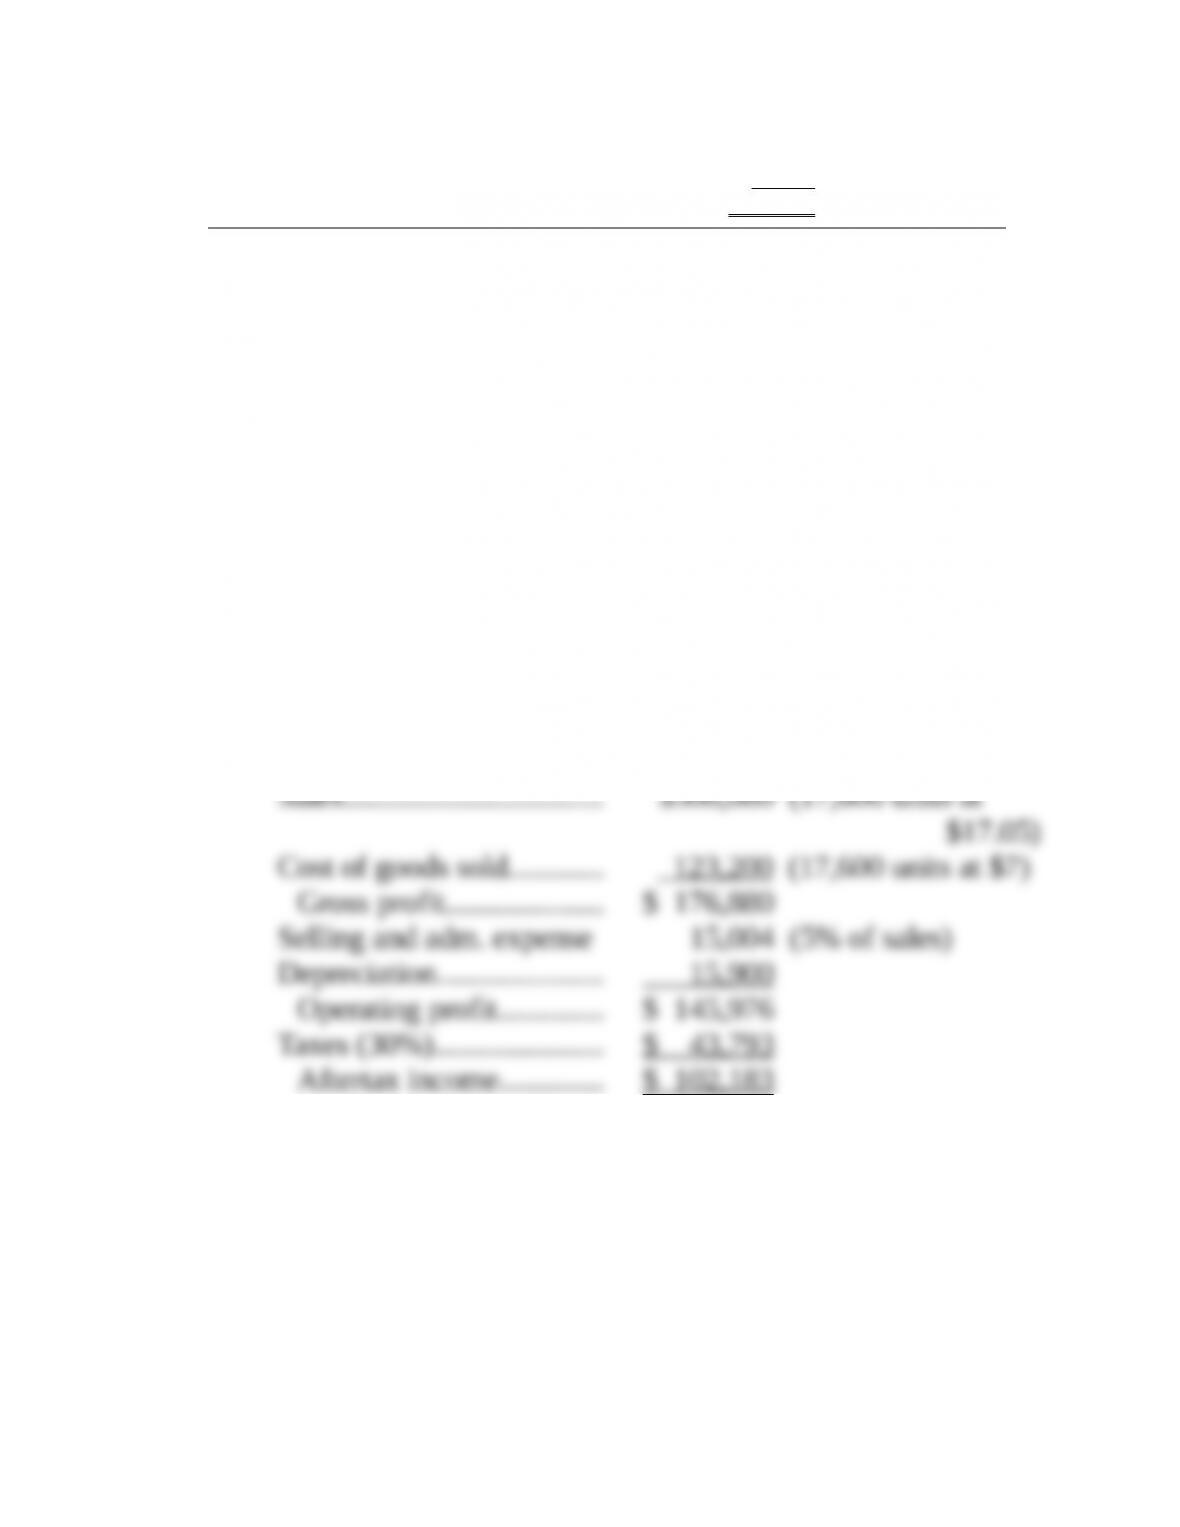
a. Assume in 20X2 that the same 17,600-unit volume is maintained, but that the sales
price increases by 10 percent. Because of FIFO inventory policy, old inventory will
still be charged off at $7 per unit. Also assume selling and administrative expense will
be 5 percent of sales and depreciation will be unchanged. The tax rate is 30 percent.
Compute aftertax income for 20X2.
b. In part a, by what percent did aftertax income increase as a result of a 10 percent
increase in the sales price? Explain why this impact took place.
c. Now assume that in 20X3 the volume remains constant at 17,600 units, but the sales
price decreases by 15 percent from its year 20X2 level. Also, because of FIFO
inventory policy, cost of goods sold reflects the inflationary conditions of the prior
year and is $7.50 per unit. Further, assume selling and administrative expense will be
5 percent of sales and depreciation will be unchanged. The tax rate is 30 percent.
Compute the aftertax income.
3-31. Solution:
Canton Corporation
a. 20X2