Chapter 03: Financial Analysis
3-8. Solution:
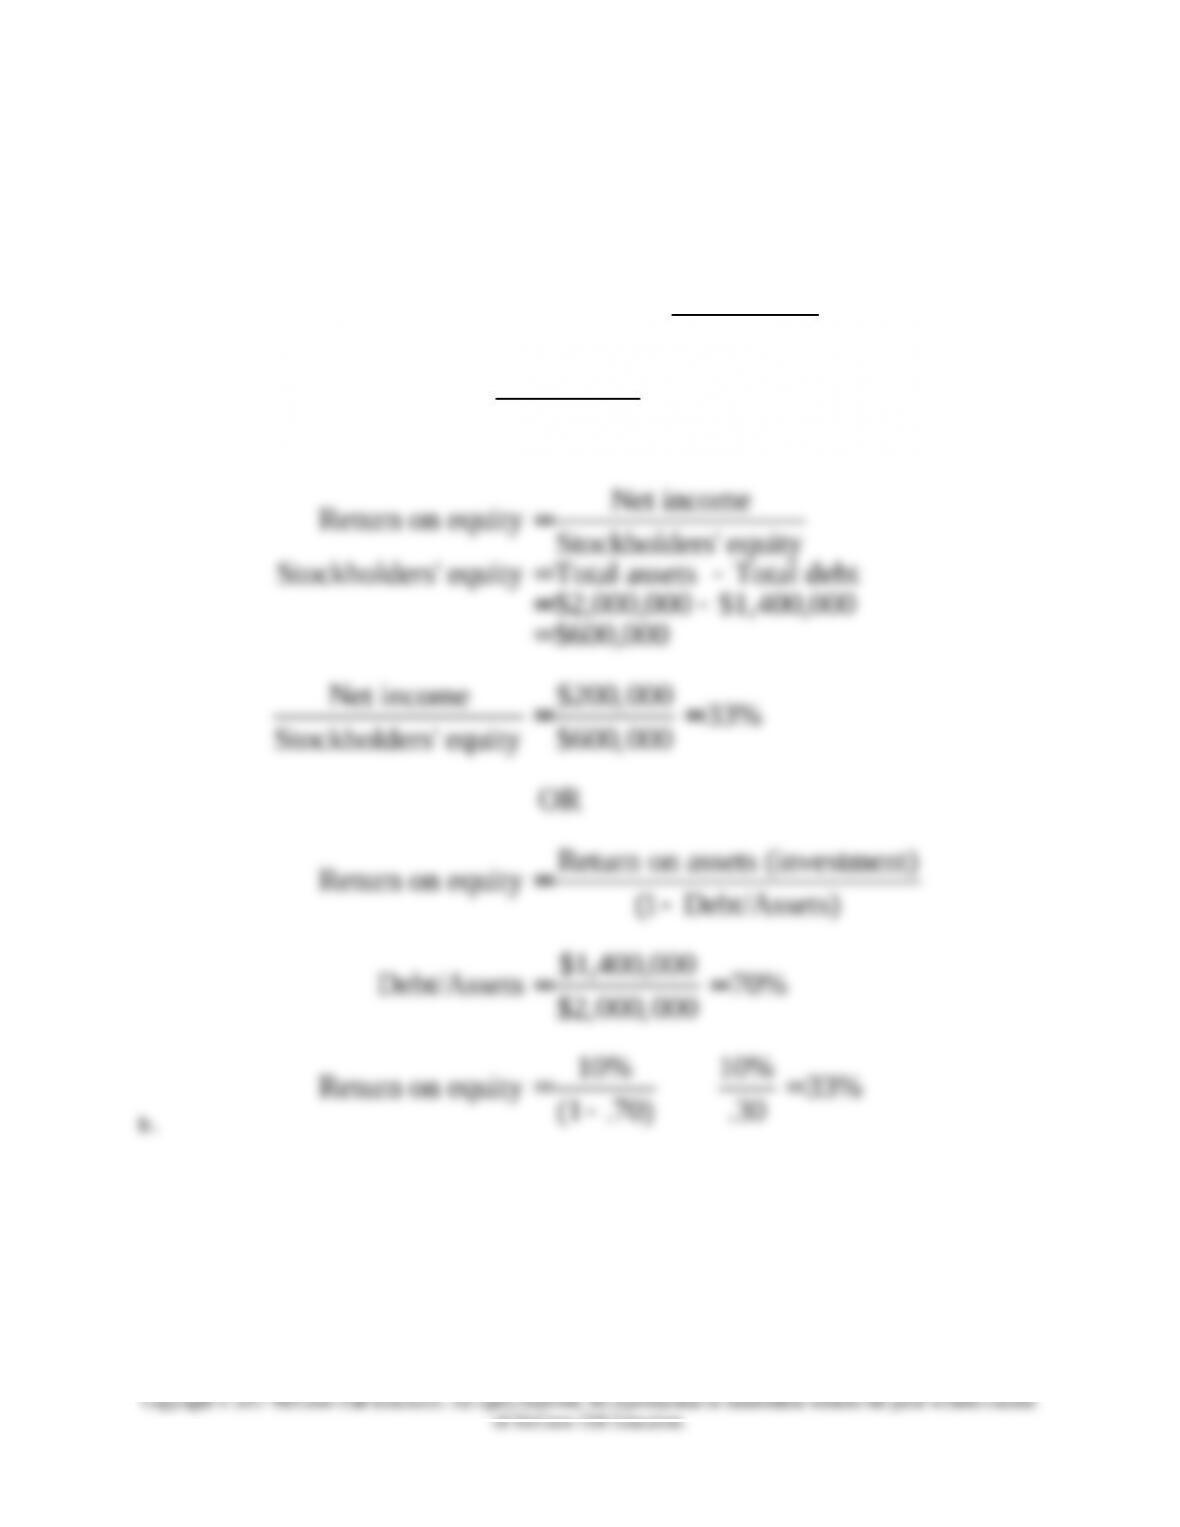
Easter Egg and Poultry Company
a.
Net income
Return on assets (investment) Total assets
$200,000 10%
$2,000,000
=
=
Net income
Return on equity Stockholders’ equity
Stockholders’ equity Total assets Total debt
$2,000,000 $1,400,000
$600,000
Net income $200,000 33%
Stockholders’ equity $600,000
OR
Return
Return on equity
=
= –
= –
=
= =
=on assets (investment)
(1 Debt/Assets)
$1,400,000
Debt/Assets 70%
$2,000,000
10% 10%
Return on equity 33%
(1 .70) .30
–
= =
= =
–
Chapter 03: Financial Analysis
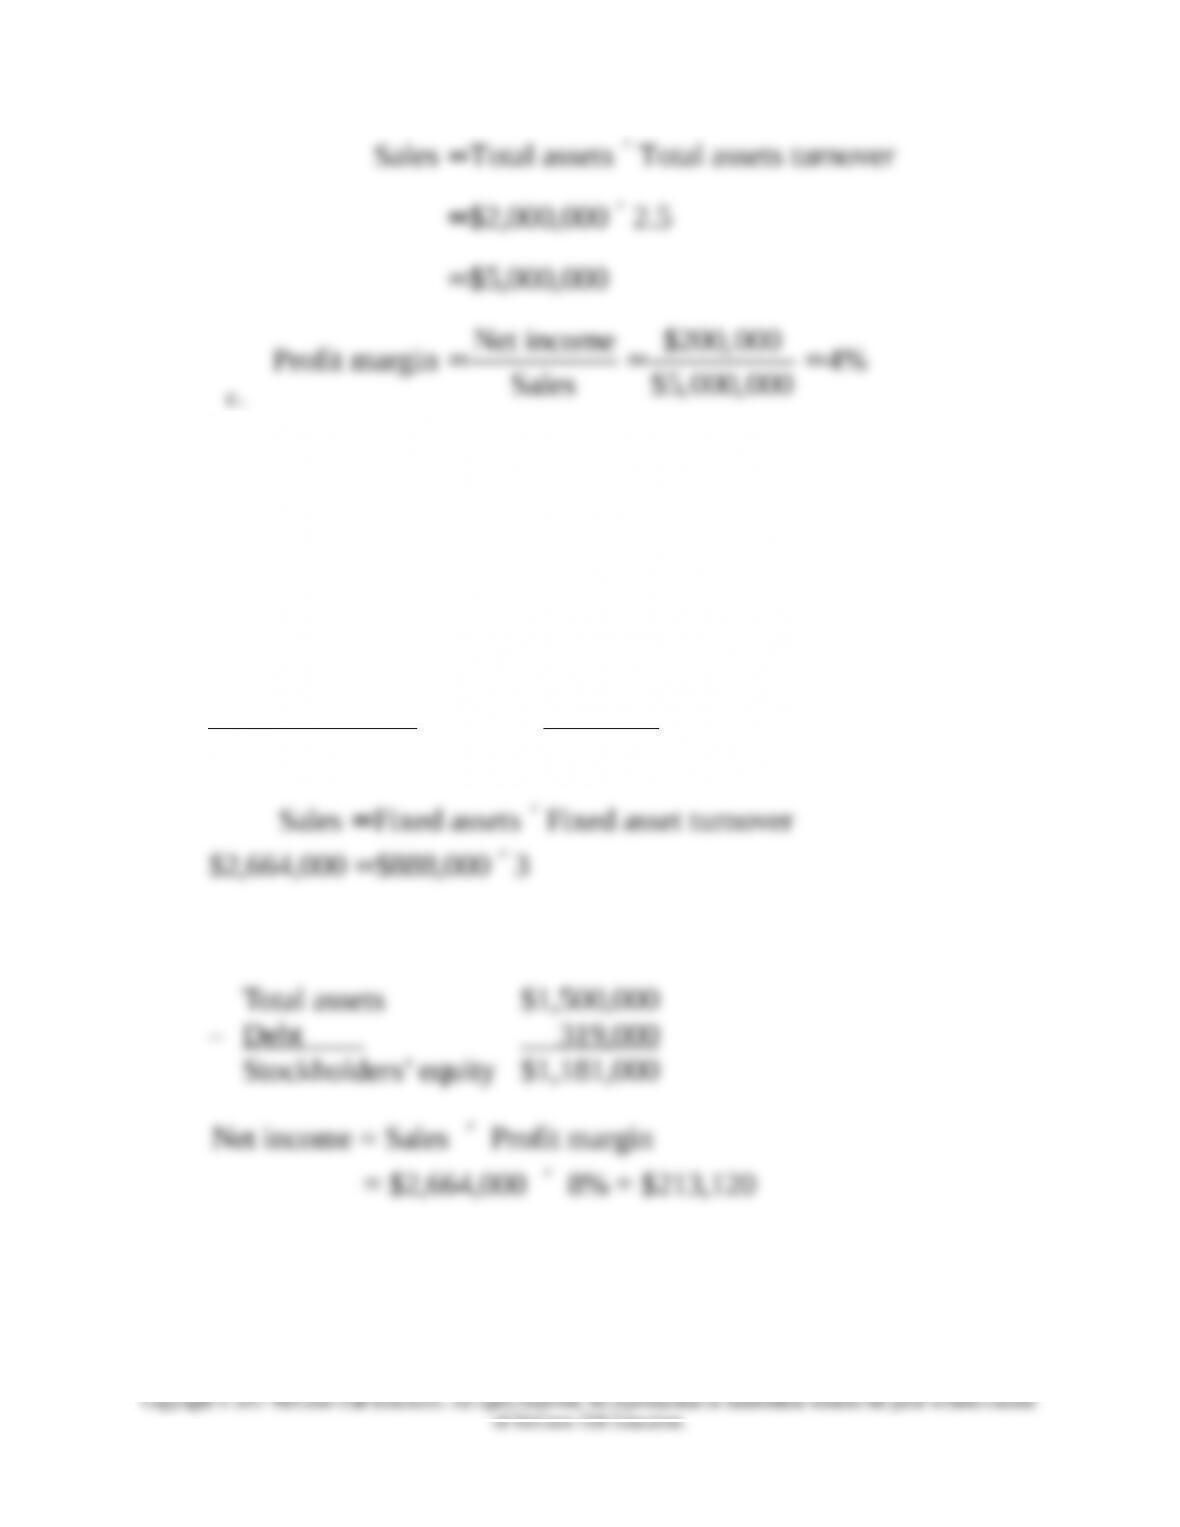
Sales Total assets Total assets turnover
$2,000,000 2.5
$5,000,000
Net income $200,000
Profit margin 4%
Sales $5,000,000
= ´
= ´
=
= = =
Chapter 03: Financial Analysis
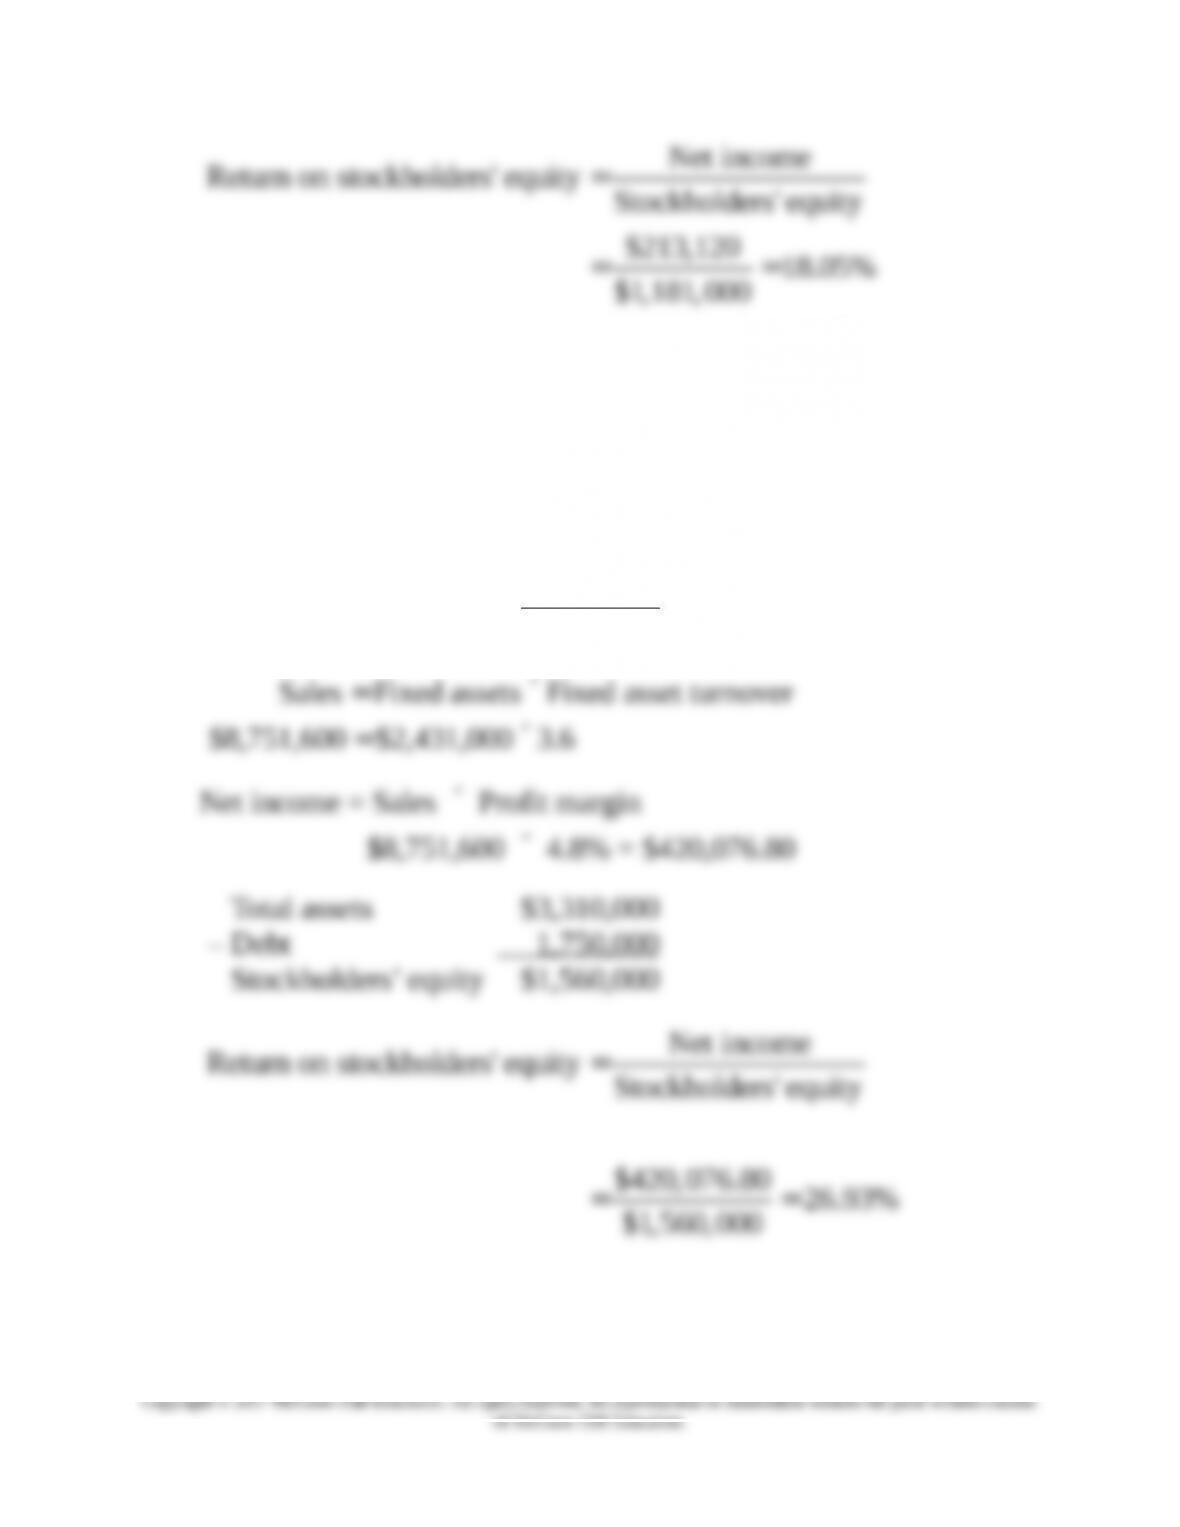
Net income
Return on stockholders’ equity Stockholders’ equity
$213,120 18.05%
$1,181,000
=
= =
10. Profitability ratios (LO2) Fondren Machine Tools has total assets of $3,310,000 and
current assets of $879,000. It turns over its fixed assets 3.6 times per year. Its return on sales is
4.8 percent. It has $1,750,000 of debt. What is its return on stockholders’ equity?
3-10. Solution:
Fondren Machine Tools
Total assets $3,310,000
– Current assets 879,000
Fixed assets $2,431,000
Sales Fixed assets Fixed asset turnover
$8,751,600 $2,431,000 3.6
= ´
= ´
Net income = Sales Profit margin
$8,751,600 4.8% = $420,076.80
´
´
Total assets $3,310,000
– Debt 1,750,000
Stockholders’ equity $1,560,000
Net income
Return on stockholders’ equity Stockholders‘ equity
$420,076.80 26.93%
$1,560,000
=
= =
11. Profitability ratios (LO2) Baker Oats had an asset turnover of 1.6 times per year.

Chapter 03: Financial Analysis
a. If the return on total assets (investment) was 11.2 percent, what was Baker’s profit
margin?
b. The following year, on the same level of assets, Baker’s assets turnover declined to
1.4 times and its profit margin was 8 percent. How did the return on total assets
change from that of the previous year?
3-11. Solution:
Baker Oats
12. Du Pont system of analysis (LO3) AllState Trucking Co. has the following ratios
compared to its industry for last year.
AllState Trucking Industry
Return on sales……….. 3% 8%
Return on assets……… 15% 10%
Explain why the return-on-assets ratio is so much more favorable than the return-on-sales
ratio compared to the industry. No numbers are necessary; a one-sentence answer is all that
is required.
3-12. Solution:
AllState Trucking Company
AllState Trucking Company has a higher asset turnover ratio than
the industry.
Calculations are not necessary to answer the question, but just in
case a student did the calculations here is the comparison.
Chapter 03: Financial Analysis
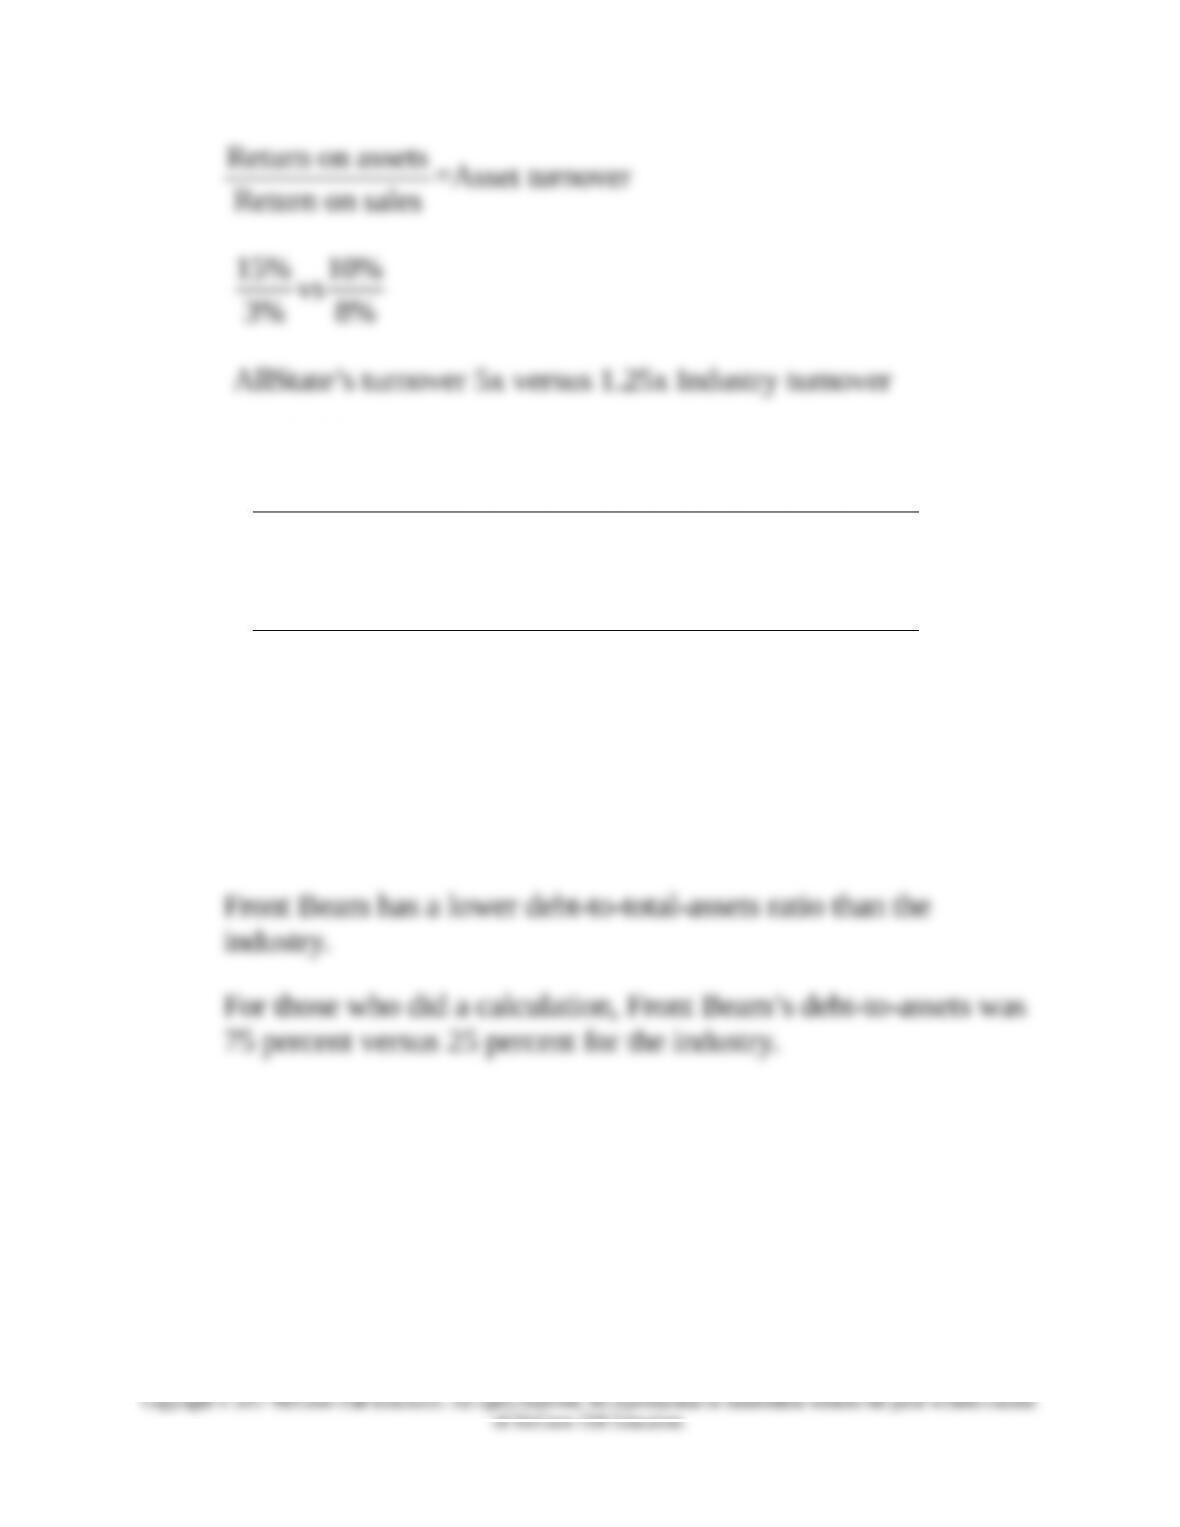
Return on assets =Asset turnover
Return on sales
15% 10%
vs
3% 8%
AllState’s turnover 5x versus 1.25x Industry turnover
13. Du Pont system of analysis (LO3) Front Beam Lighting Company has the following
ratios compared to its industry for last year.
Front Beam
Lighting Industry
Return on assets…………… 12% 5%
Return on equity…………… 16% 20%
Explain why the return-on-equity ratio is so much less favorable than the return-on-assets
ratio compared to the industry. No numbers are necessary; a one-sentence answer is all that
is required.
3-13. Solution:
Front Beam Lighting Company
14. Du Pont system of analysis (LO3) Gates Appliances has a return-on-assets (investment)
ratio of 8 percent.
a. If the debt-to-total-assets ratio is 40 percent, what is the return on equity?
b. If the firm had no debt, what would the return-on-equity ratio be?
3-14. Solution:
Chapter 03: Financial Analysis
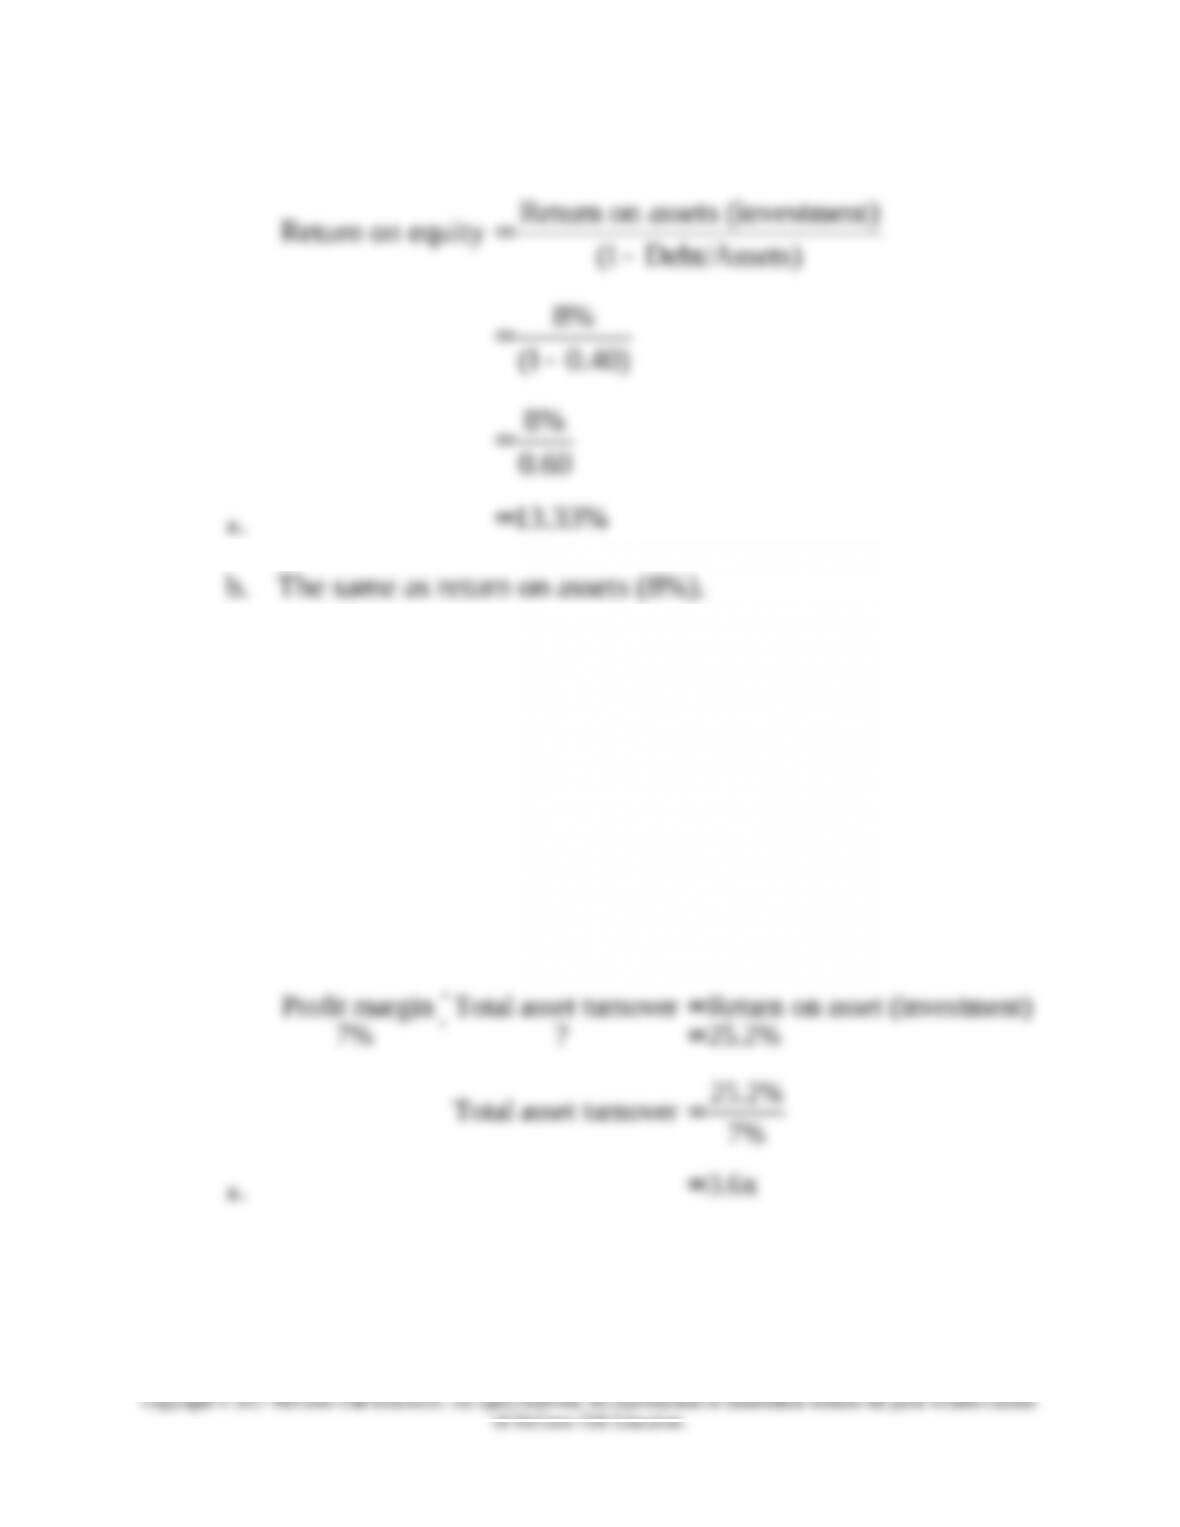
Gates Appliances
Return on assets (investment)
Return on equity (1 Debt/Assets)
8%
(1 0.40)
8%
0.60
13.33%
=–
=–
=
=
15. Du Pont system of analysis (LO3) Using the Du Pont method, evaluate the effects of the
following relationships for the Butters Corporation:
a. Butters Corporation has a profit margin of 7 percent and its return on assets
(investment) is 25.2 percent. What is its assets turnover?
b. If the Butters Corporation has a debt-to-total-assets ratio of 50 percent, what would the
firm’s return on equity be?
c. What would happen to return on equity if the debt-to-total-assets ratio decreased to
35 percent?
3-15. Solution:
Butters Corporation
Profit margin Total asset turnover Return on asset (investment)
7% ? 25.2%
25.2%
Total asset turnover 7%
3.6x
´ =
´ =
=
=
Chapter 03: Financial Analysis
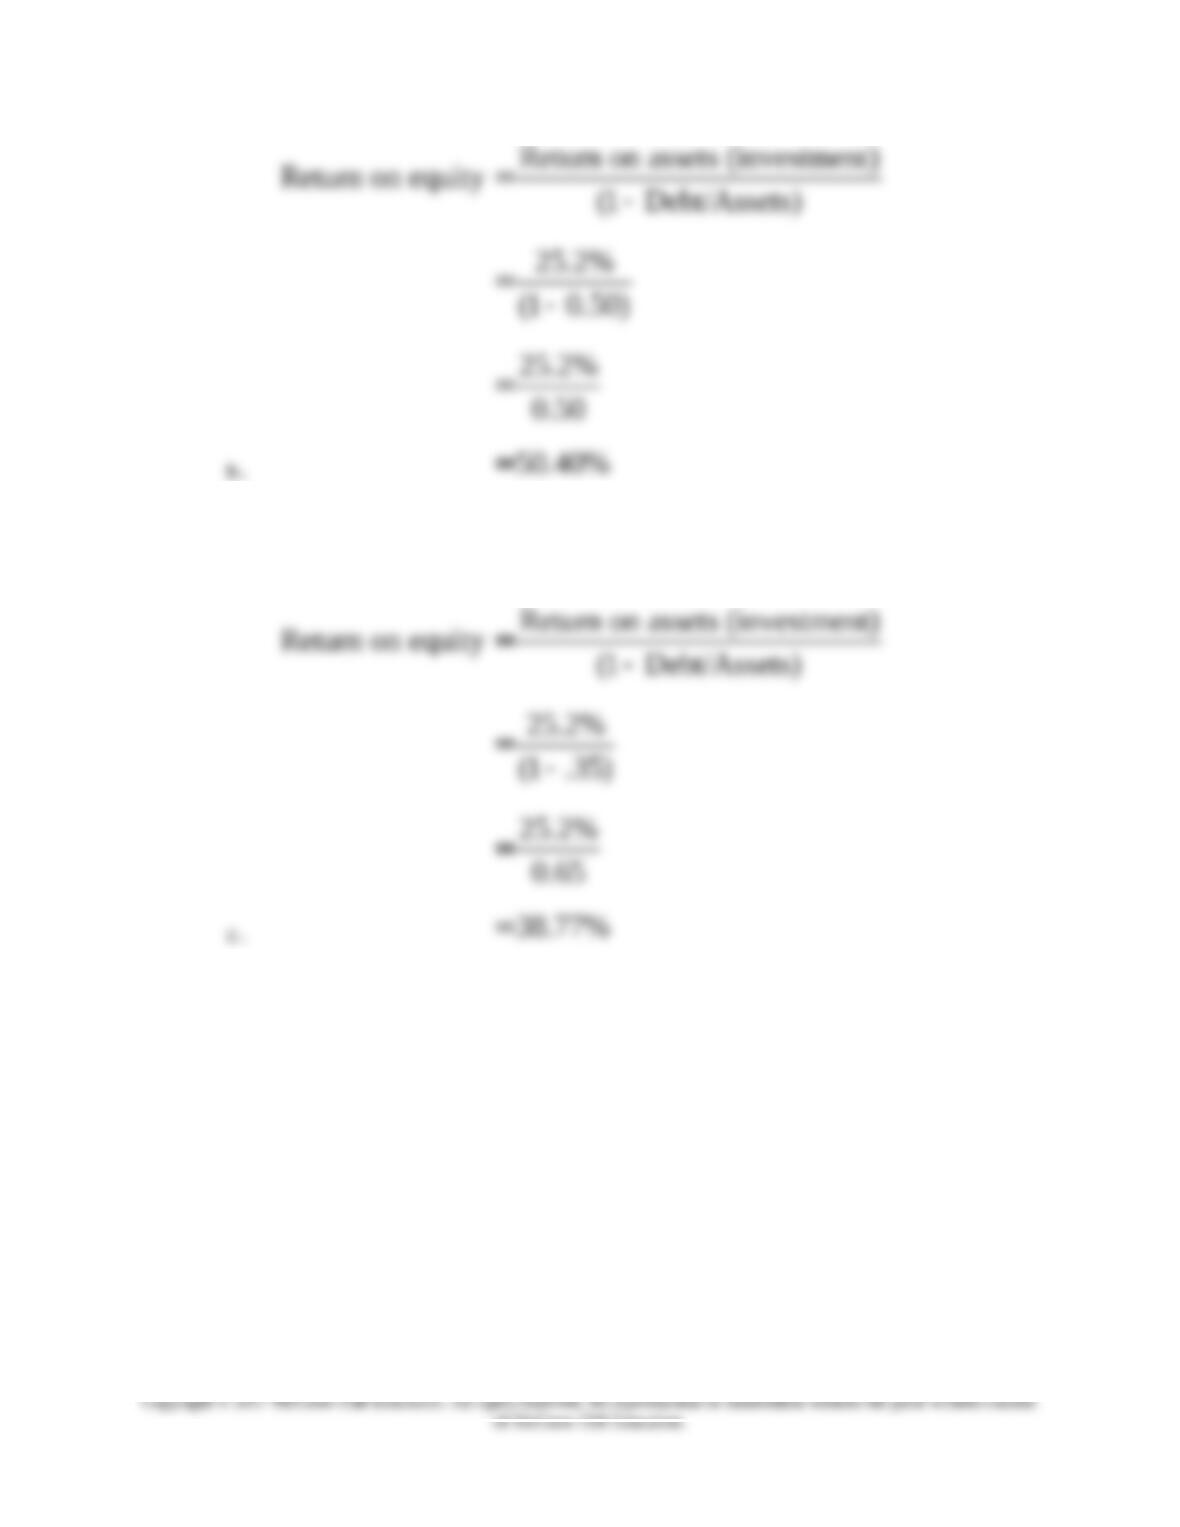
Return on assets (investment)
Return on equity (1 Debt/Assets)
25.2%
(1 0.50)
25.2%
0.50
50.40%
=–
=–
=
=
Chapter 03: Financial Analysis
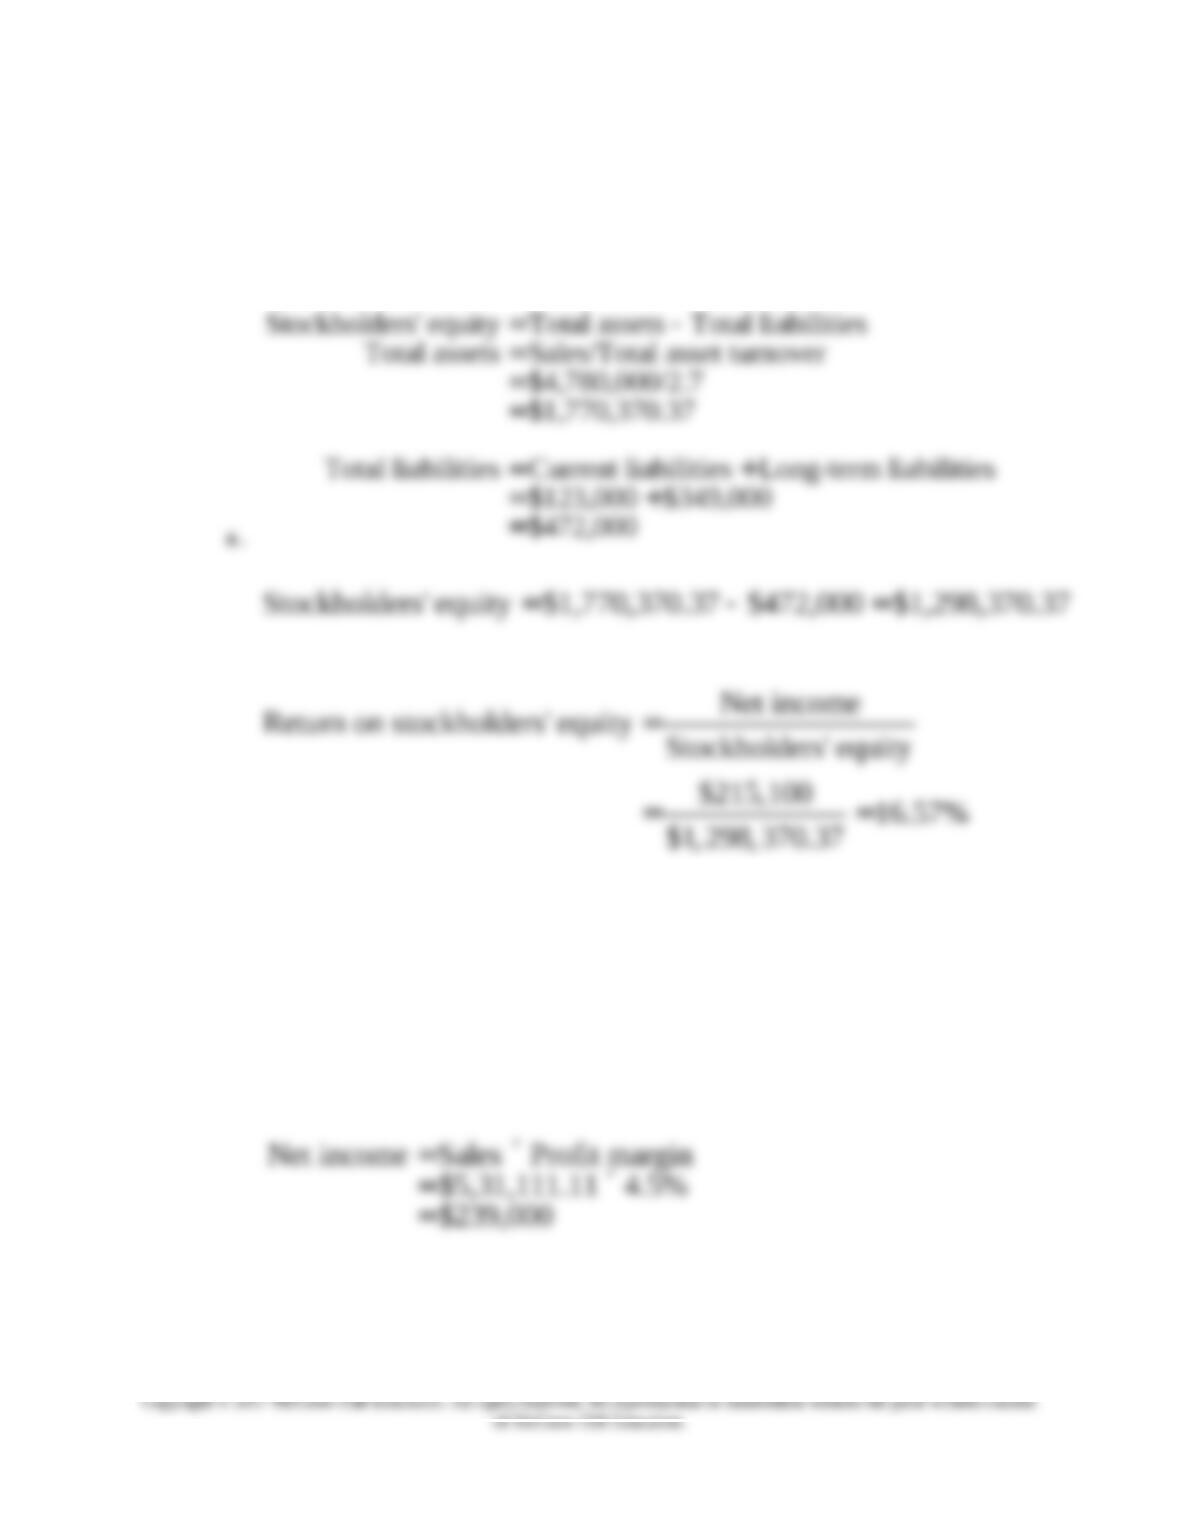
Jerry Rice and Grain Stores
Net income Sales profit margin
$4,780,000 4.5%
$215,100
Stockholders’ equity Total assets Total liabilities
Total assets Sales/Total asset turnover
$4,780,000/2.7
$1,770,370.37
Total liabilities Current
= ´
= ´
=
= –
=
=
=
=liabilities Long-term liabilities
$123,000 $349,000
$472,000
+
= +
=
Stockholders’ equity $1,770,370.37 $472,000 $1,298,370.37= – =
Net income
Return on stockholders’ equity Stockholders’ equity
$215,100 16.57%
$1, 298,370.37
=
= =
3-16. (Continued)
b. The new level of sales will be:
Sales Total assets Total asset turnover
$1,770,370.37 3
$5,311,111.11
= ´
= ´
=
Net income Sales Profit margin
$5,31,111.11 4.5%
$239,000
= ´
= ´
=
Chapter 03: Financial Analysis
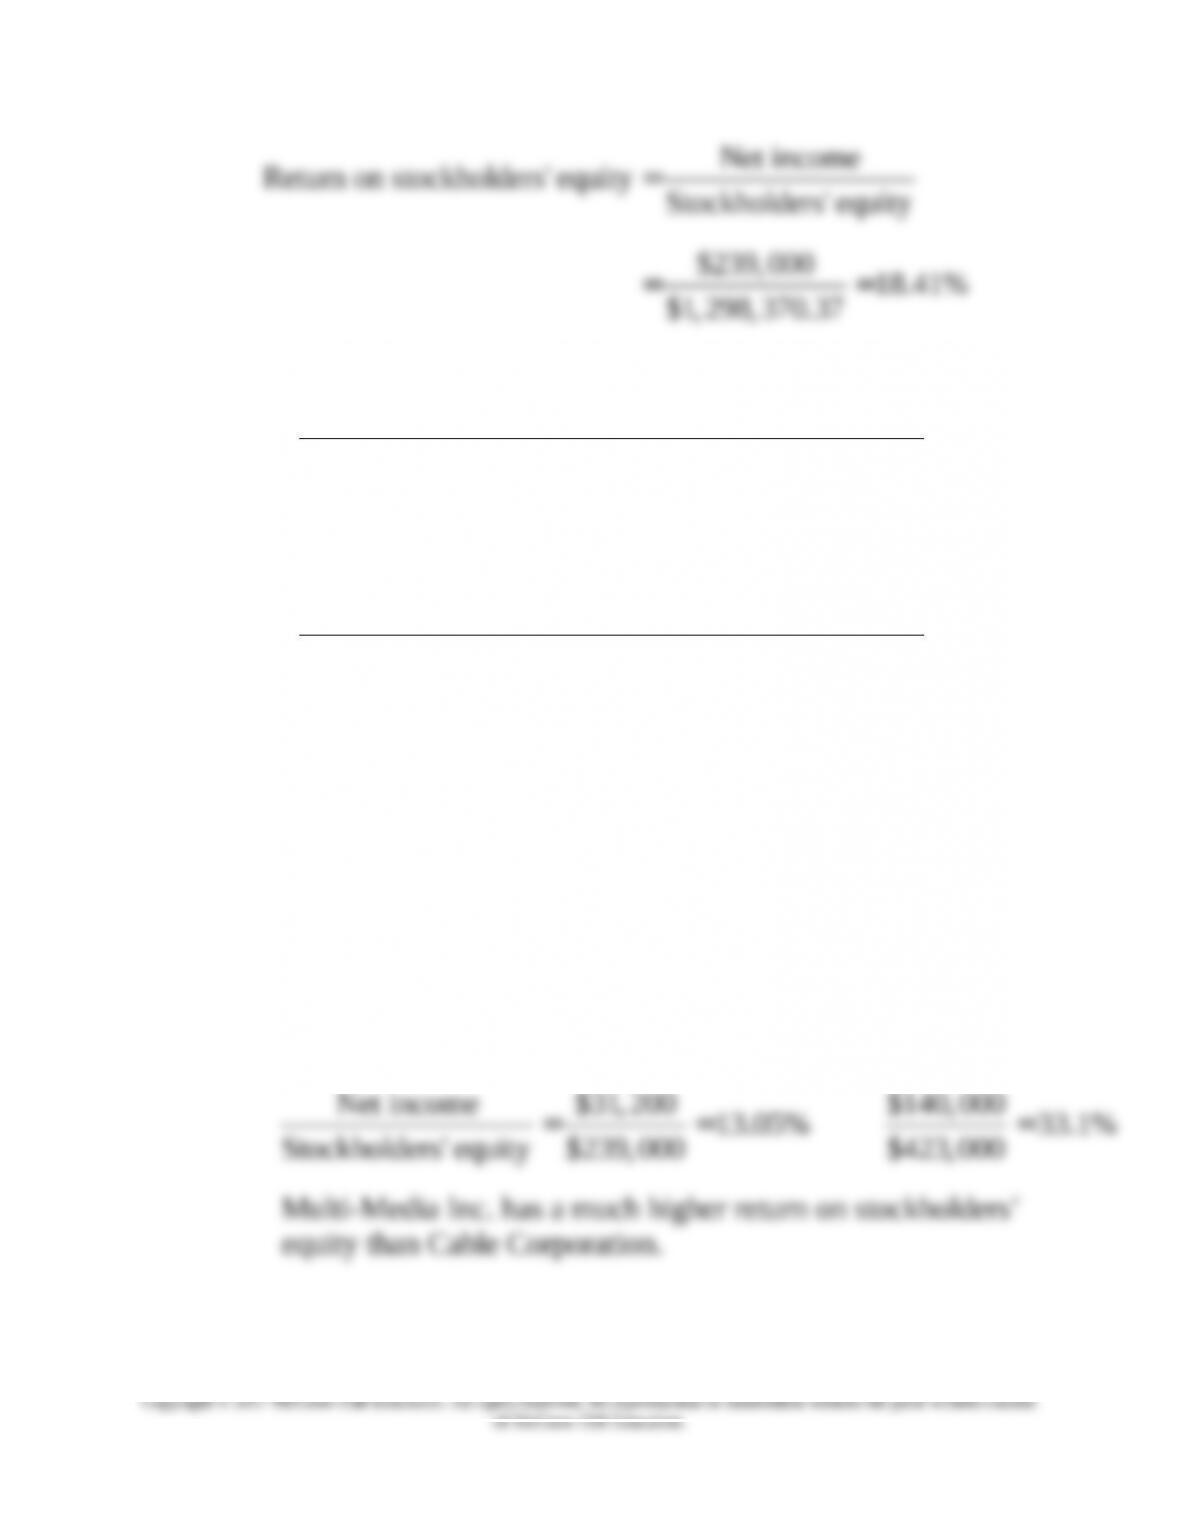
Net income
Return on stockholders’ equity Stockholders’ equity
$239, 000 18.41%
$1, 298,370.37
=
= =
17. Interpreting results from the Du Pont system of analysis (LO3) Assume the following
data for Cable Corporation and Multi-Media Inc.
Cable Multi-
Corporation Media Inc.
Net income……………..….……….. $ 31,200 $ 140,000
Sales…………………….…………….. 317,000 2,700,000
Total assets………….….…………… 402,000 965,000
Total debt…………………………….. 163,000 542,000
Stockholders’ equity………….….. 239,000 423,000
a. Compute the return on stockholders’ equity for both firms using ratio 3a. Which firm
has the higher return?
b. Compute the following additional ratios for both firms:
Net income/Sales
Net income/Total assets
Sales/Total assets
Debt/Total assets
c. Discuss the factors from part b that added or detracted from one firm having a higher
return on stockholders’ equity than the other firm as computed in part a.
3.17. Solution:
Cable Corporation and Multi-Media Inc.
a. Cable Multi-
Corporation Media Inc.
Net income $31,200 $140,000
13.05% 33.1%
Stockholders’ equity $239,000 $423,000
= = =
Multi-Media Inc. has a much higher return on stockholders’
equity than Cable Corporation.
3-17. (Continued)
Chapter 03: Financial Analysis
Corporation Media Inc.
Net income $31,200 $140,000
9.84% 5.19%
Sales $317,000 $2, 700, 000
Net income $31, 200 $140, 000
7.76% 14.51%
Total assets $402, 000 $965,000
Sales $317,000 $2,700,000
.79x 2.8x
Total assets $402,000 $965, 000
Debt
Total
= = =
= = =
= = =
$163, 000 $542,000
40.55% 56.17%
assets $402,000 $965,000
= = =
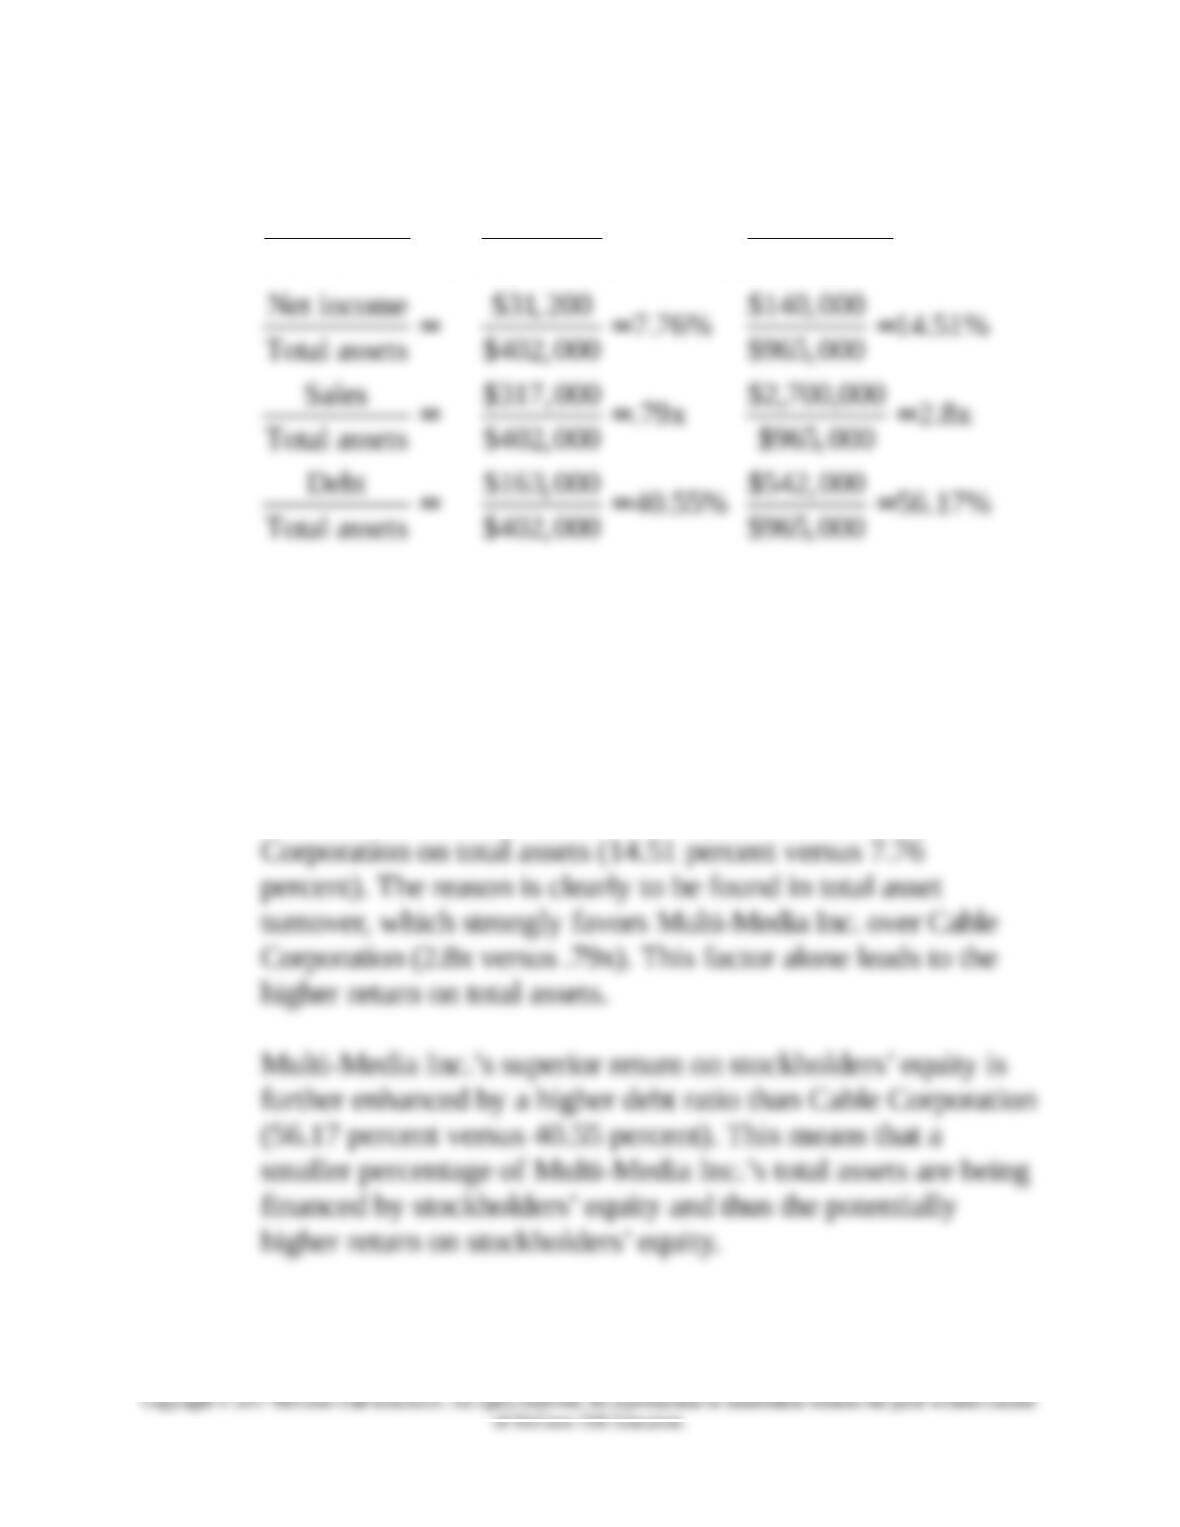
c. As previously indicated, Multi-Media Inc. has a substantially
higher return on stockholders’ equity than Cable Corporation
(33.1 percent versus 13.05 percent). The reason is certainly not
to be found on return on the sales dollar where Cable
Corporation has a higher return than Multi-Media Inc. (9.84
percent versus 5.19 percent).
However, Multi-Media Inc. has a higher return than Cable