13-20. (Continued)
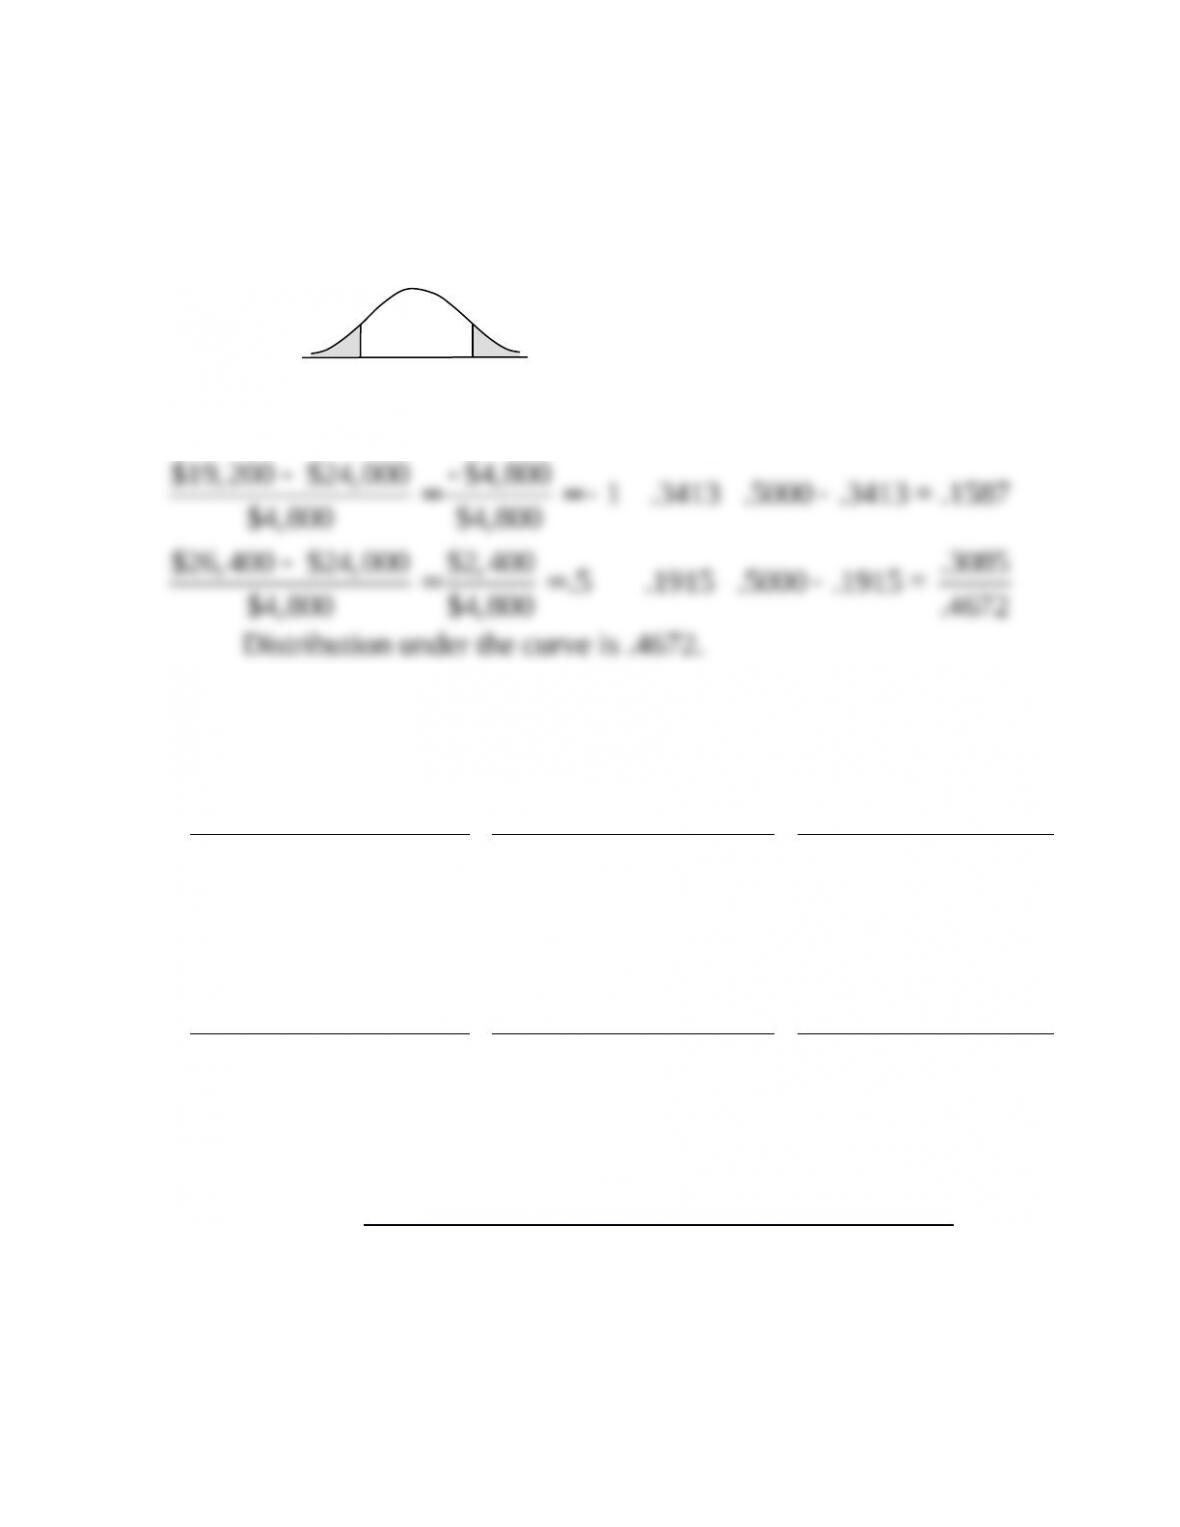
e. Less than $19,200 or greater than $26,400
Area
$19,200 $24,000 $4,800 1 .3413 .5000 .3413 = .1587
$4,800 $4,800
$26,400 $24,000 $2,400 .3085
.5 .1915 .5000 .1915 =
$4,800 $4,800 .4672
– –
= =- –
–= = –
Distribution under the curve is .4672.
21. Increasing risk over time (LO13-1) The Oklahoma Pipeline Company projects the
following pattern of inflows from an investment. The inflows are spread over time to
reflect delayed benefits. Each year is independent of the others.
Year 1 Year 5 Year 10
Cash
Inflow Probability Cash Inflow Probability
Cash
Inflow Probability
55
…….…………. .40 40....... .30 20
………………. .40
70
…….…………. .20 70....... .40 70
………………. .20
85
…….…………. .40 100....... .30 120
………………. .40
The expected value for all three years is $70.
a. Compute the standard deviation for each of the three years.
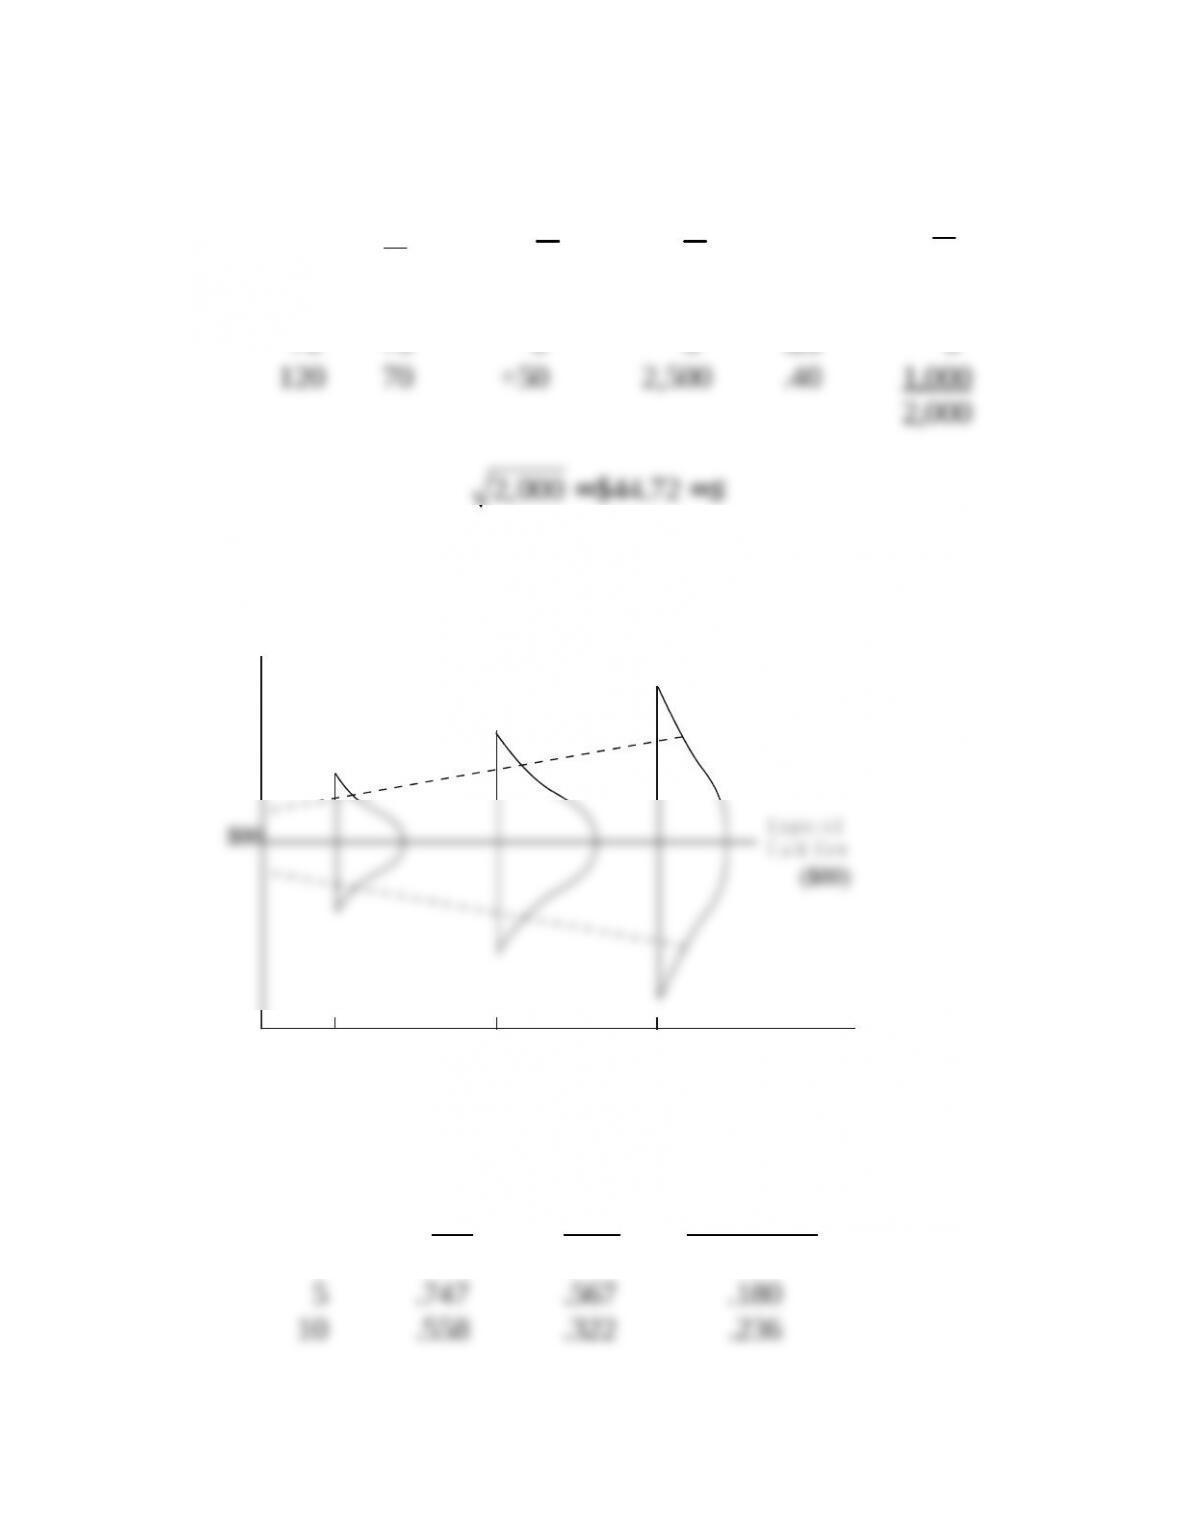
b. Diagram the expected values and standard deviations for each of the three years in a
manner similar to Figure 13-6.
c. Assuming 6 percent and 12 percent discount rates, complete the following table for
present value factors:
Year
PVIF
6%
PVIF
12% Difference
1
…….…………. .943 .893 .050
5 ________ ________ ________
$19,2
00
$26,4
00

…….………….
10
…….…………. ________ ________ ________
d. Is the increasing risk over time, as diagrammed in part b, consistent with the larger
differences in PVIFs over time, as computed in part c?
e. Assume the initial investment is $135. What is the net present value of the investment
at a 12 percent discount rate? Should the investment be accepted?
13-21. Solution:
Oklahoma Pipeline Company
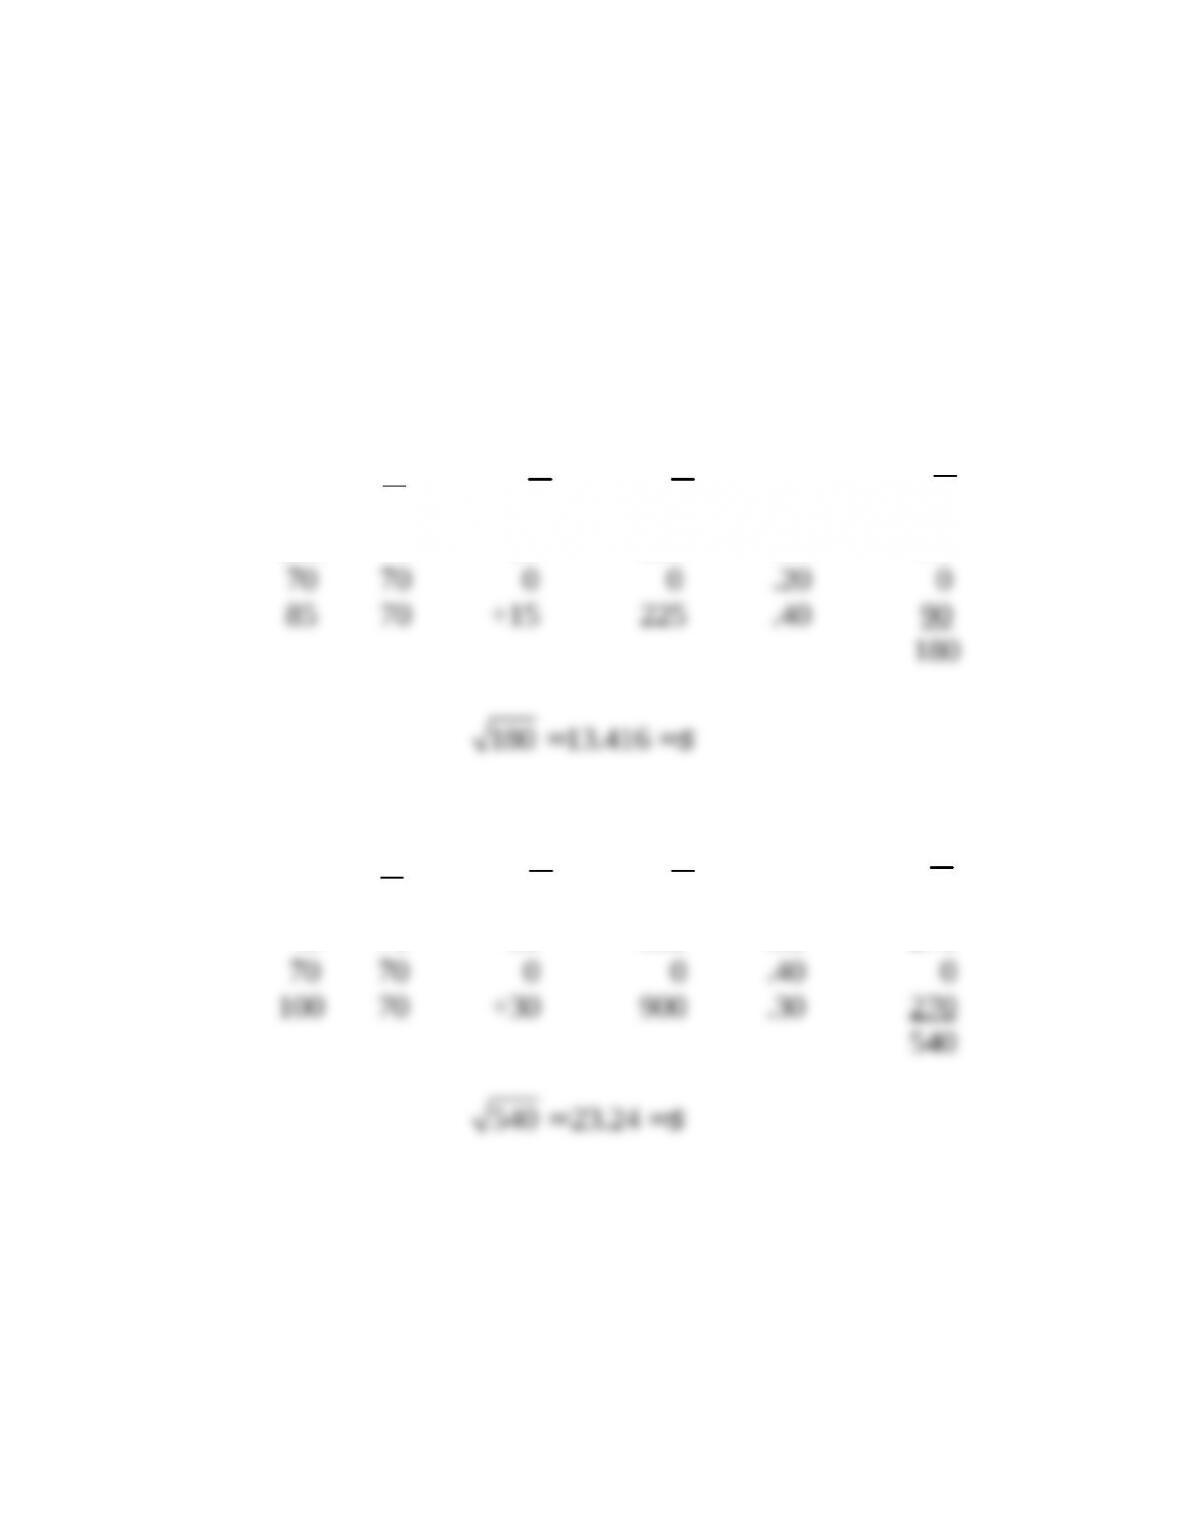
a. Standard deviation—year 1
D
D
( )D D–
2
( )D D–
P
2
( )D D–
P
$55 70 –15 225 .40 90
2
2
( )D D–
13-21. (Continued)
Standard deviation—year 10
D
D
( )D D–
2
( )D D–
P
2
( )D D–
P
20 70 –50 2,500 .40 1,000
70 70 0 0 .20 0
13-21. (Continued)
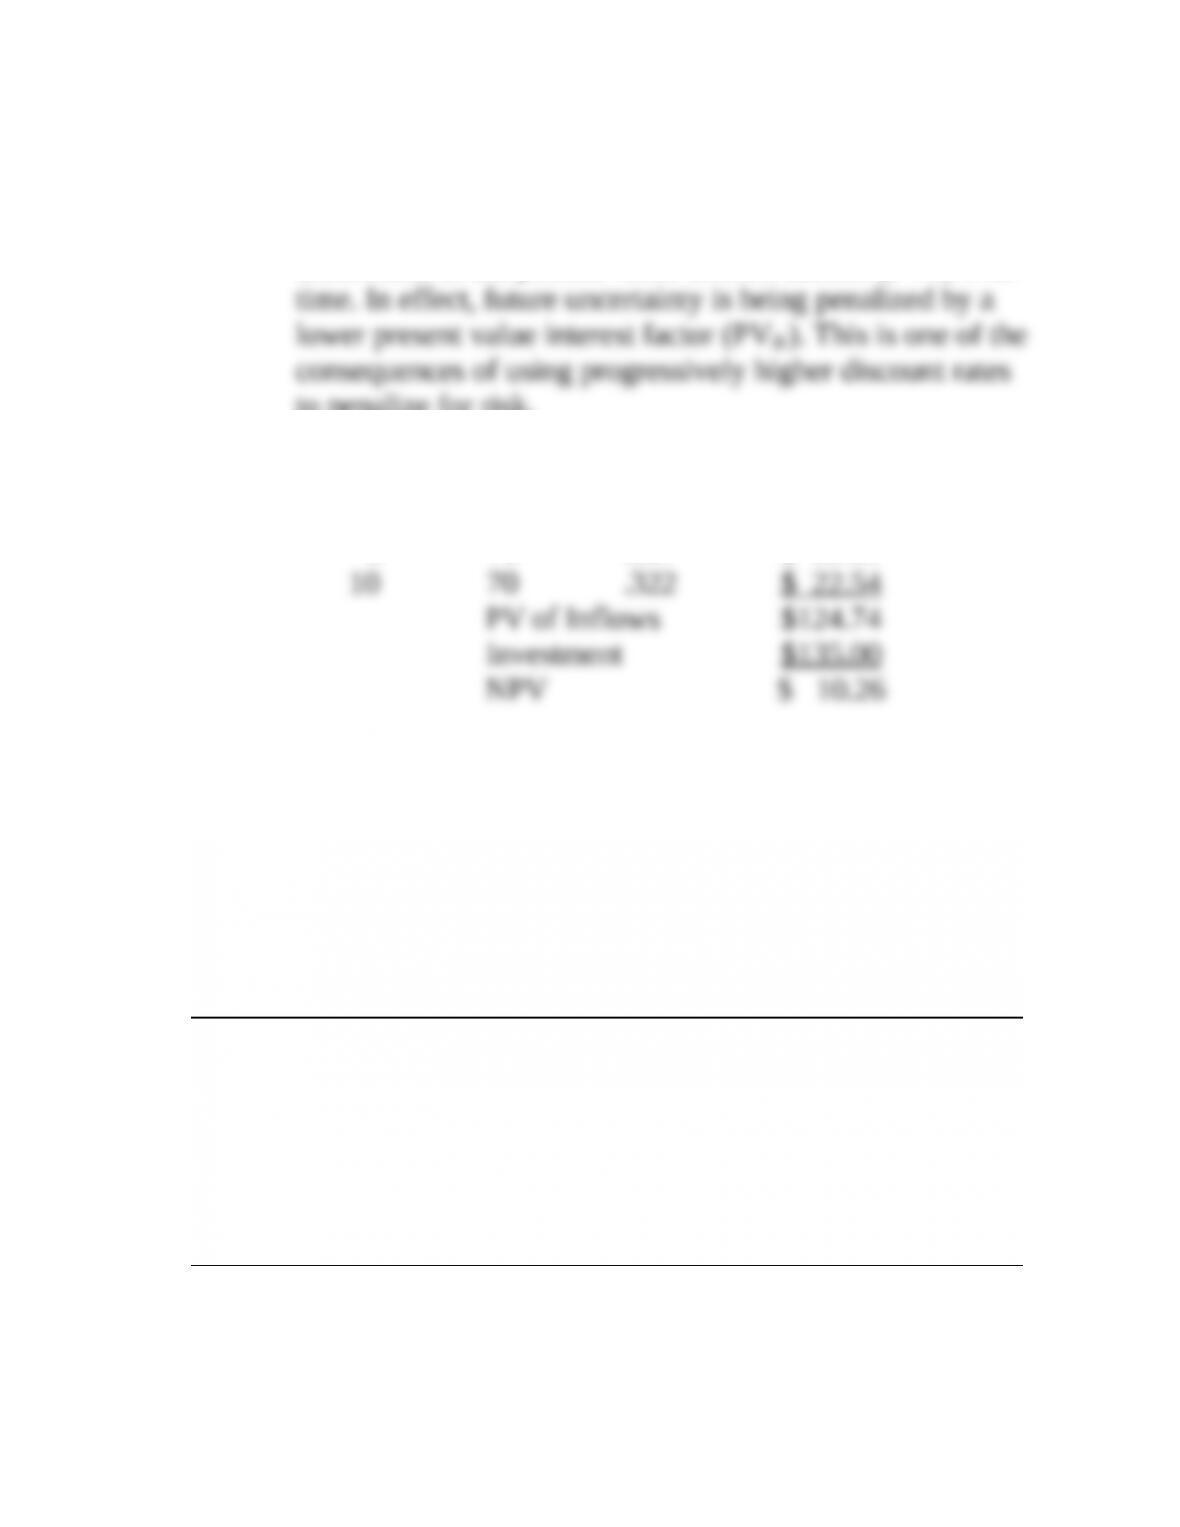
d. Yes. The larger risk over time is consistent with the larger
differences in the present value interest factors (PVIF) over
to penalize for risk.
Year Inflow PVIF (12%) PV
1 $70 .893 $ 62.51
5 70 .567 $ 39.69
d. Accept the investment.
22. Portfolio effect of a merger (LO13-5) Treynor Pie Company is a food company
specializing in high-calorie snack foods. It is seeking to diversify its food business and
lower its risks. It is examining three companies—a gourmet restaurant chain, a baby food
company, and a nutritional products firm. Each of these companies can be bought at the
same multiple of earnings. The following table represents information about all the
companies:
Company
Correlation
with Treynor
Pie Company
Sales
($ millions)
Expected
Earnings
($ millions)
Standard
Deviation
in Earnings
($ millions)
Treynor Pie Company............. + 1.0 $126 $10 $4.0
Gourmet restaurant………….….. + .4 63 9 1.4
Baby food company….…......... + .3 52 5 1.6
Nutritional products
company…………………….……… − .7 77 7 3.2
a. Using the last two columns, compute the coefficient of variation for each of the four
companies. Which company is the least risky? Which company is the most risky?
b. Discuss which of the acquisition candidates is most likely to reduce Treynor Pie
Company’s risk. Explain why.
13-22. Solution:
Treynor Pie Company
a.
Standard deviation
Coefficient of variation ( ) Expected value
V=
(millions)
Treynor Pie Company $4/$10 = .40
Gourmet Restaurant $1.4/$9 = .16
a. Because the nutritional products firm is highly negatively
correlated (–.7) with Treynor Pie Company, it is most likely
to reduce risk. It would appear that the demand for high-
23. Portfolio effect of a merger (LO13-5) Hooper Chemical Company, a major chemical firm
that uses such raw materials as carbon and petroleum as part of its production process, is
examining a plastics firm to add to its operations. Before the acquisition, the normal
expected outcomes for the firm were as follows:
Outcomes
($ millions) Probability
Recession……………………..… $20 .30
Normal economy….….……... 40 .40
Strong economy………………. 60 .30
After the acquisition, the expected outcomes for the firm would be:
Outcomes
($ millions) Probability
Recession……………………..… $10 .3
Normal economy….….……... 40 .4
Strong economy………………. 80 .3
a. Compute the expected value, standard deviation, and coefficient of variation before
the acquisition.
b. After the acquisition, these values are as follows:
Expected value…………….…….…….…….… 43.0 ($ millions)
Standard deviation…………………………….. 27.2 ($ millions)
Coefficient of variation………….…….….... .633
Comment on whether this acquisition appears desirable to you.
c. Do you think the firm’s stock price is likely to go up as a result of this acquisition?
d. If the firm was interested in reducing its risk exposure, which of the following three
industries would you advise it to consider for an acquisition? Briefly comment on
your answer.
(1) Chemical company
(2) Oil company
(3) Computer company
13-23. Solution:
Hooper Chemical Co.
D DP=å
D P PD
$20 .30 6
40 .40 16
2
( )D D Ps= –
å
D
D
( )D D–
2
( )D D–
P
2
( )D D–
P
$20 40 –20 400 .30 120
40 40 0 0 .40 0
b. No, it does not appear to be desirable. Although the expected
value is $3 million higher, the coefficient of variation is more
c. Probably not. There may be a higher discount rate applied
d. The oil company may provide the best risk reduction
benefits. Since petroleum is used as part of the firm’s
24. Efficient frontier (LO13-5) Ms. Sharp is looking at a number of different types of
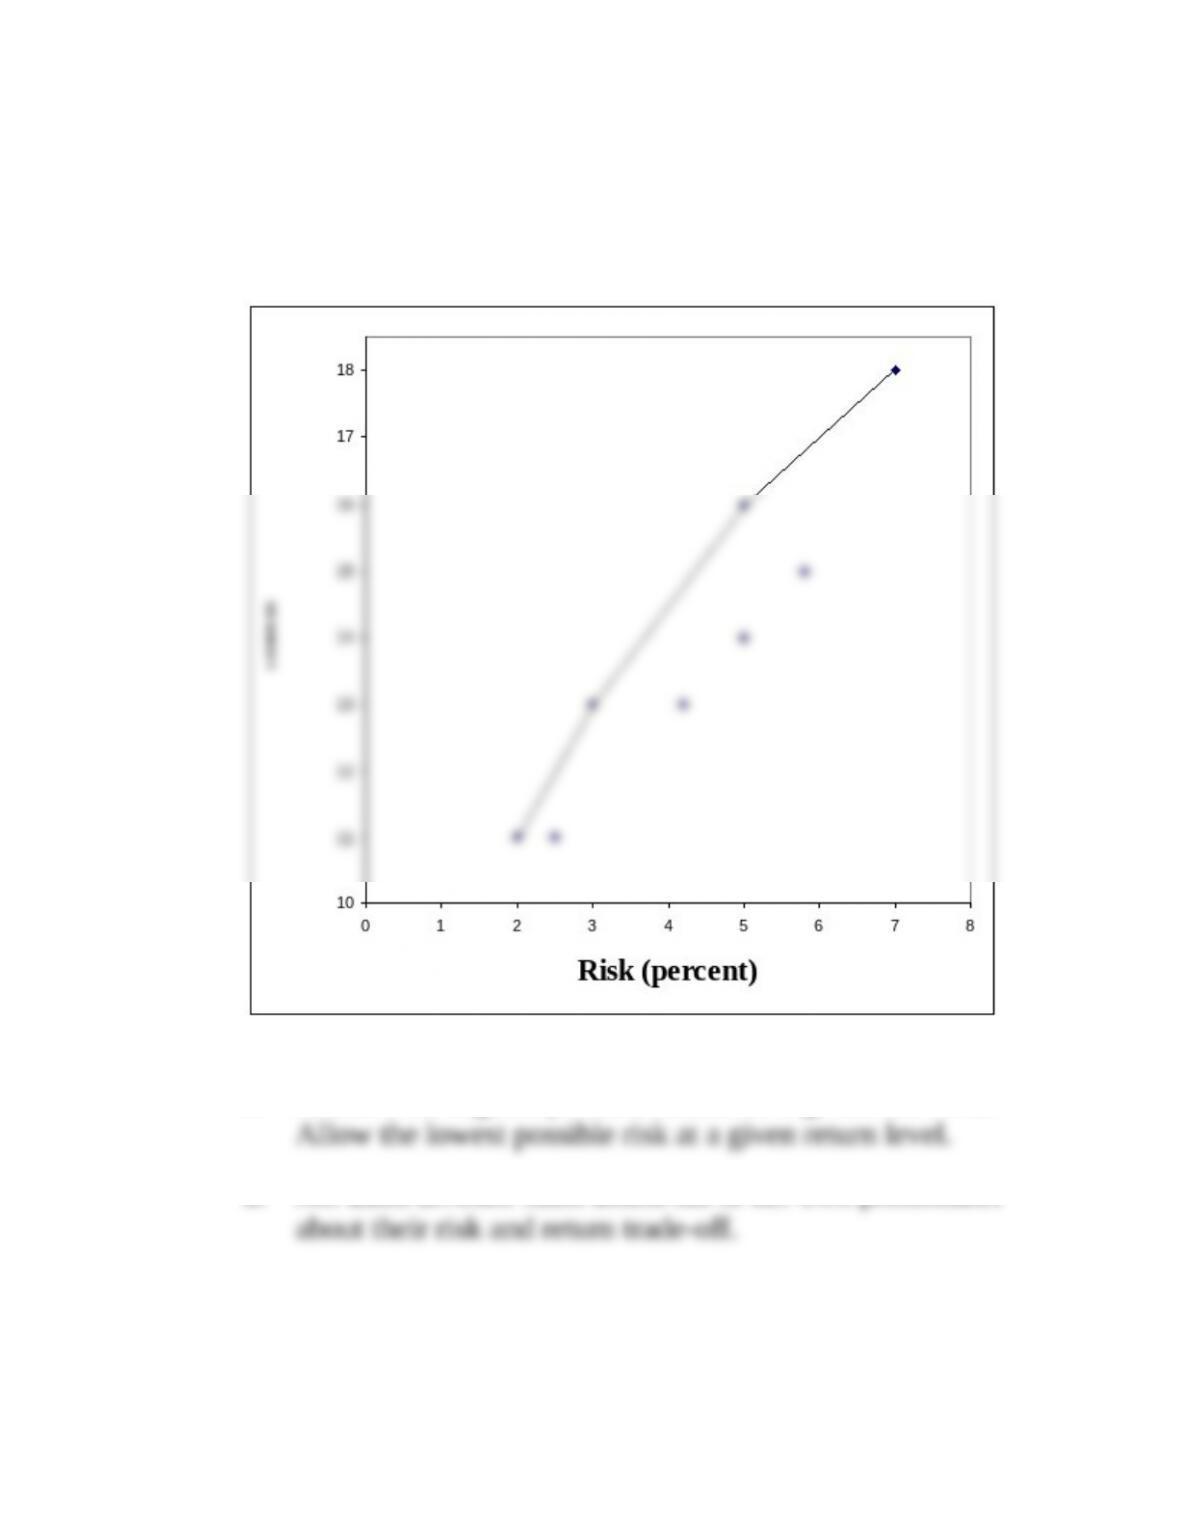
investments for her portfolio. She identifies eight possible investments.
Return Risk Return Risk
(a)……………… 11% 2% (e)……………… 14% 5.0%
(b)……………… 11 2.5 (f)………………. 16 5.0
(c)….……….…. 13 3.0 (g)……….….…. 15 5.8
(d)……………… 13 4.2 (h)……….….…. 18 7.0
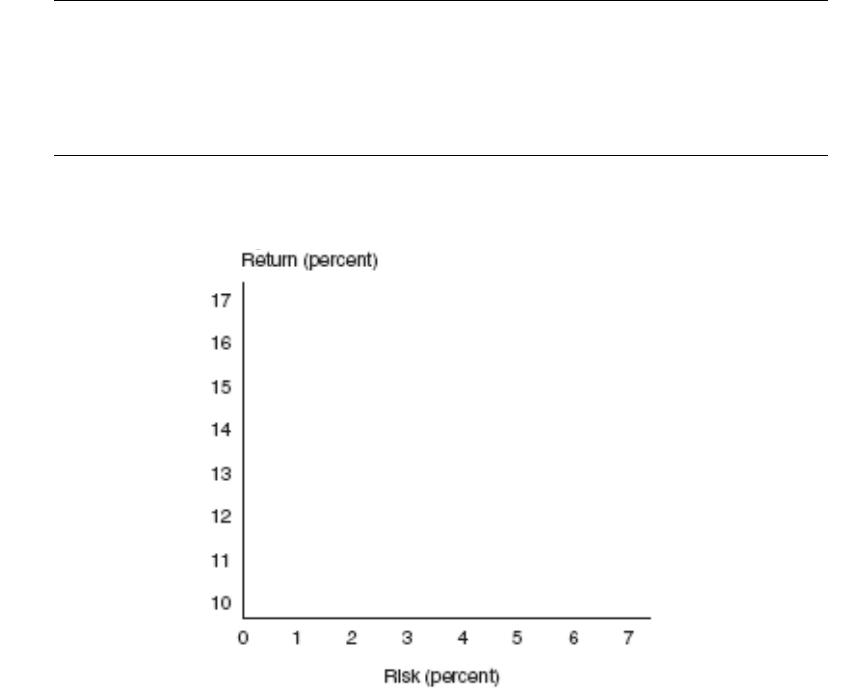
a. Graph the data in a manner similar to Figure 13-11. Use the axes that follow for your
data:
b. Draw a curved line representing the efficient frontier.
c. What two objectives do points on the efficient frontier satisfy?
d. Is there one point on the efficient frontier that is best for all investors?
13-24. Solution:
Ms. Sharp
a., b.
c. Achieve the highest possible return for a given risk level.
d. No. Each investor must assess his or her own preferences