Chem-Med Company Case 2
Ratio Analysis
Purpose: The case allows the student to go into financial analyses in more depth than in possible with
end-of-chapter problems. In addition to computing a series of ratios, the student must consider industry
data and trends for the purpose of evaluating relative performance. The student must also make use of the
Du Pont system of analysis. Of special interest are the debt and performance covenants established by the
potential financier. Finally, the student is forced to identify the impact of extraordinary income on ratio
analysis and how it can distort one year’s performance.
Relation to Text: The case should follow Chapter 3.
Complexity: The case is moderately complex. It should require 1-1½ hours.
Solutions
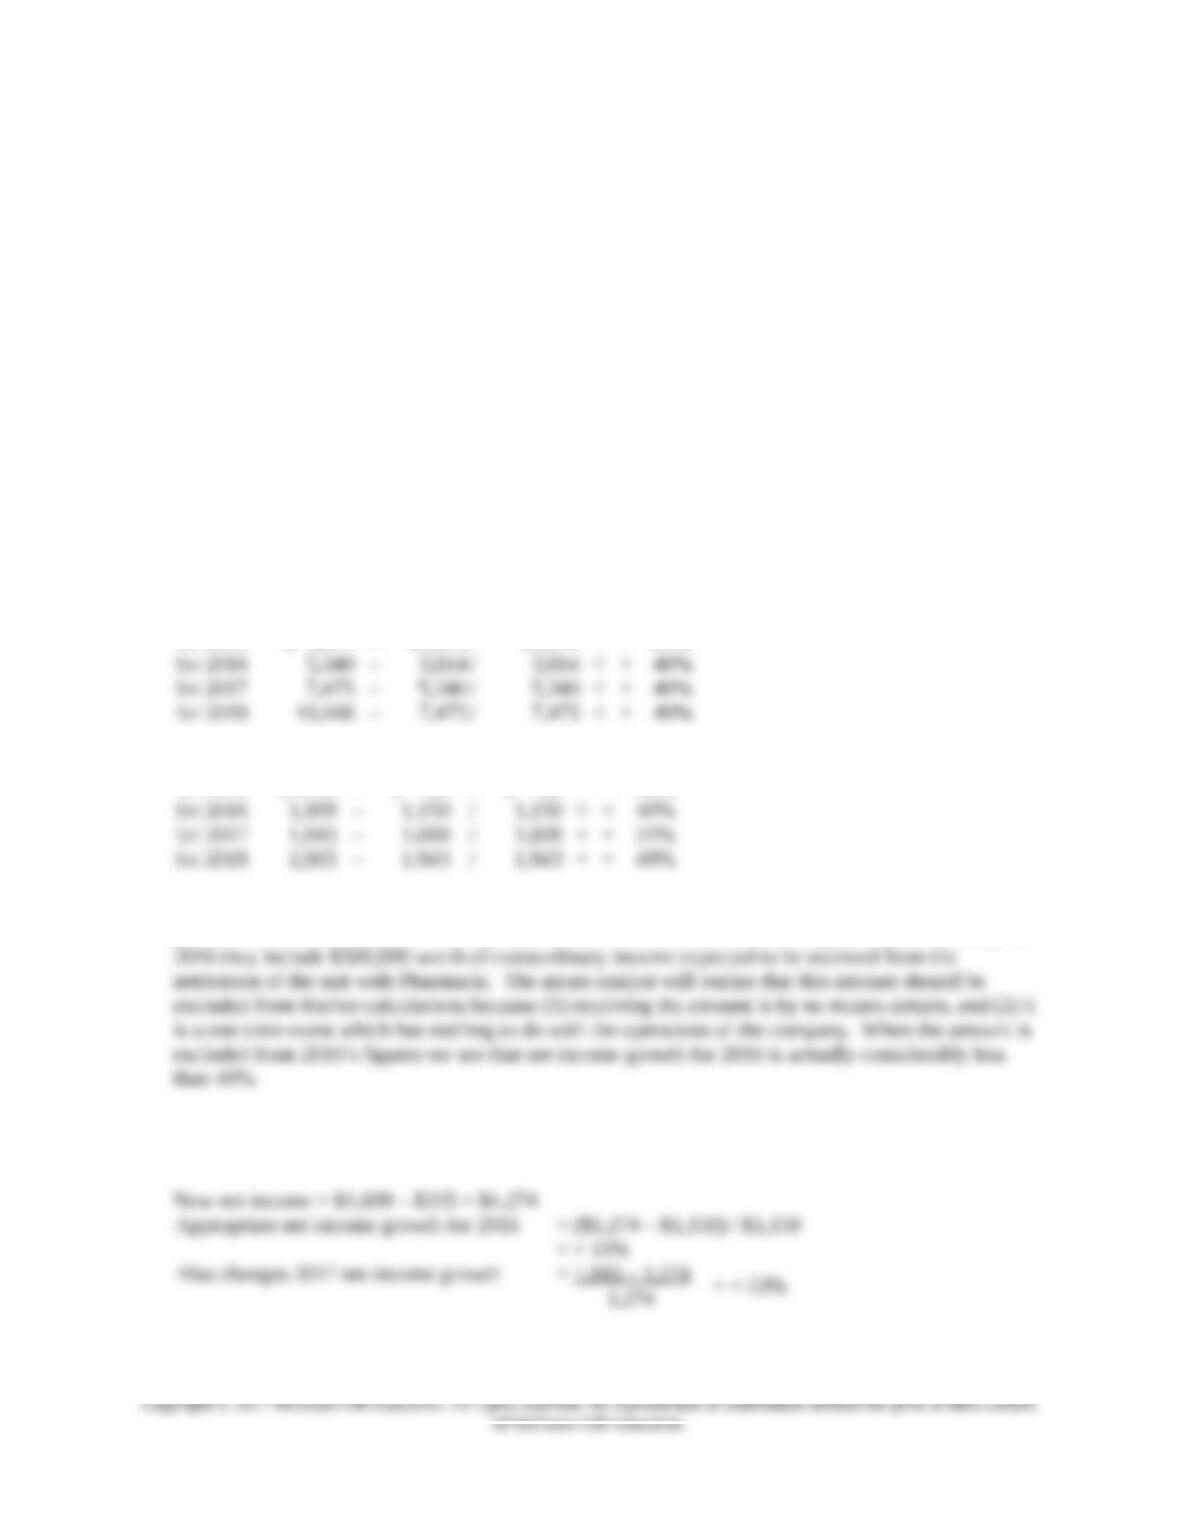
1. Sales Growth = (Sales this year – Sales last year) / Sales last year
for 2015 $ 3,814 – $3,051 / $3,051 = + 25%
2. Net income growth = (Net income this year – Net income last year) / Net Income last year
for 2015 $1,150 – $ 766 / $ 766 = + 50%
According to Dr. Swan’s estimates net income growth will exceed sales growth in 2015, match sales
growth in 2016, then slack off and rebound in 2018. However, Dr. Swan’s figures are misleading: in
Aftertax effect of removing $500,000 from gross income = $500 x (1 – tax rate) = $500 x
(1 – .33) = – $335
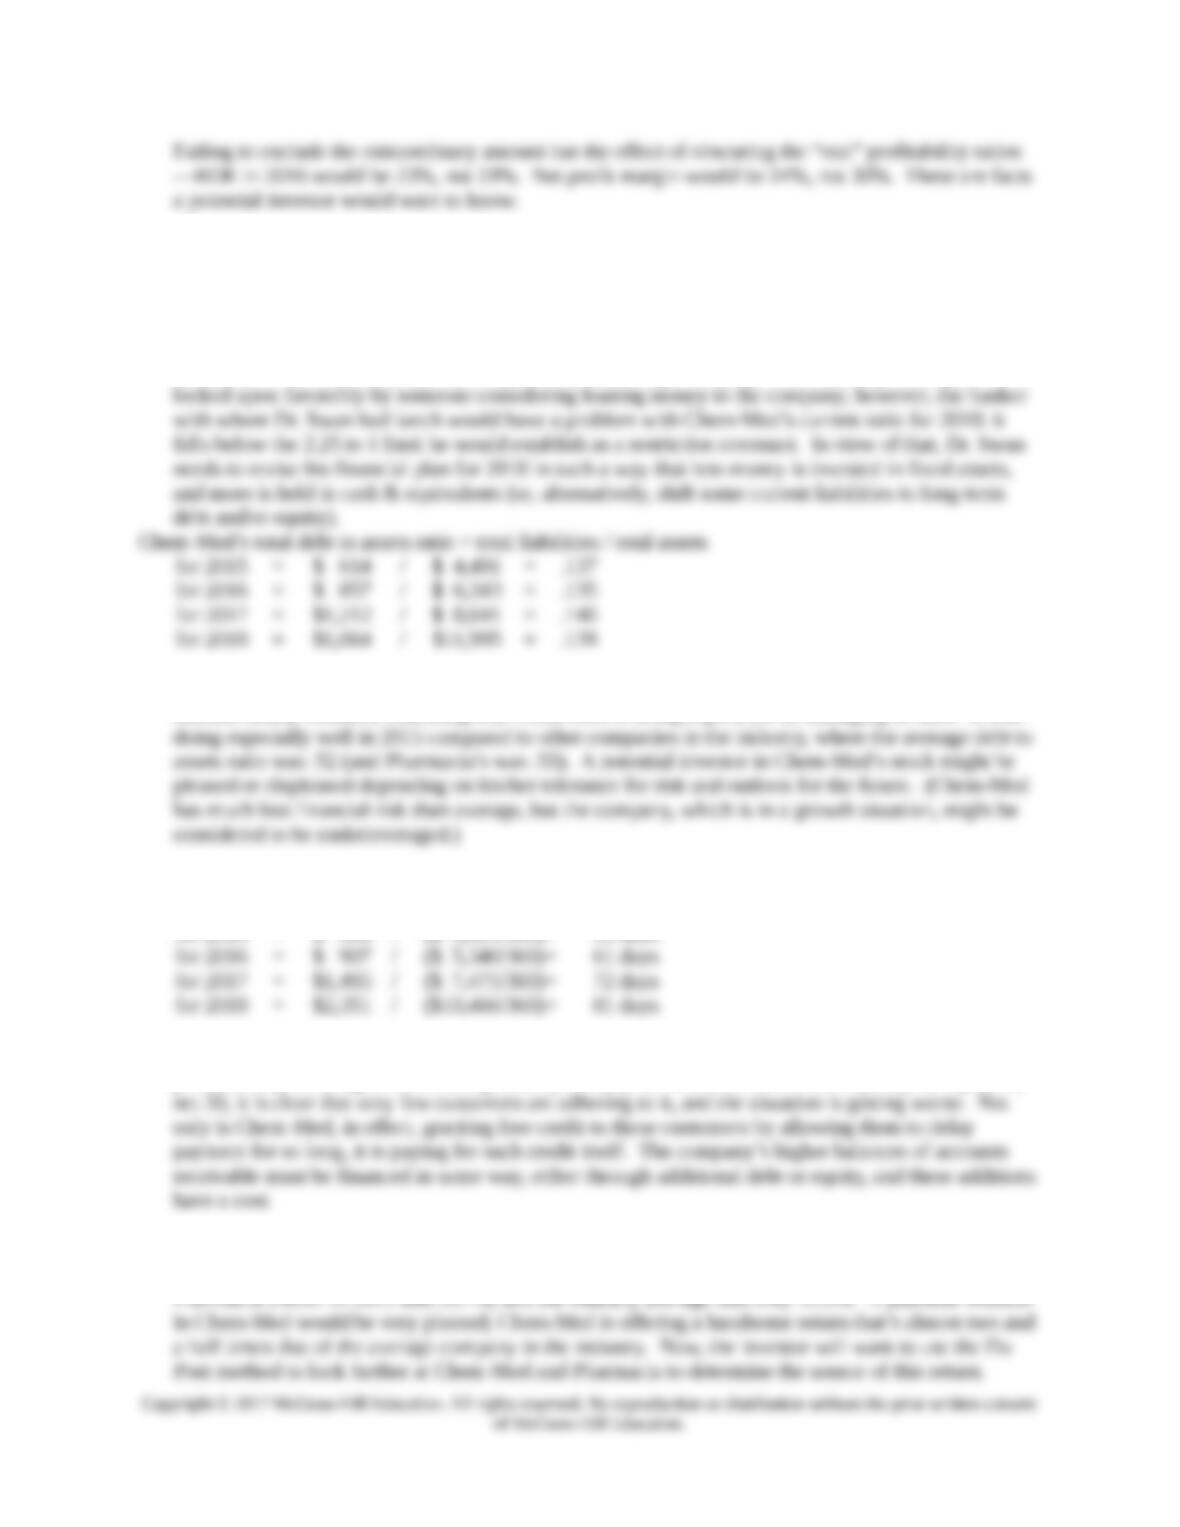
3. Chem-Med’s current ratio = Current Assets / Current Liabilities:
for 2015 = $1,720 / $ 593 = 2.90
for 2018 = $3,261 / $1,647 = 1.98
Pharmacia had a current ratio in 2015 of 2.8, and the industry average was 2.4. Chem-Med,
therefore, in 2015 was slightly more liquid than the average company. This would probably be
The variation from year to year is small—no trend can be established, except, of course, that the ratio
remains nearly constant, indicating that Chem-Med is doing a good job in managing its debt. It was
4. Chem-Med’s average accounts receivable collection period = accounts receivable / sales per day
for 2015 = $ 564 / ($ 3,814/360) = 53 days
This is not a good sign. The average length of time that Chem-Med’s customers are taking to pay for
products they’ve bought is increasing steadily every year. If Chem-Med’s credit policy is, say, 2/10,
5. Chem-Med’s return on equity ratio = net income / total equity for 2015 = $1,150 / $3,877 = 29.7%
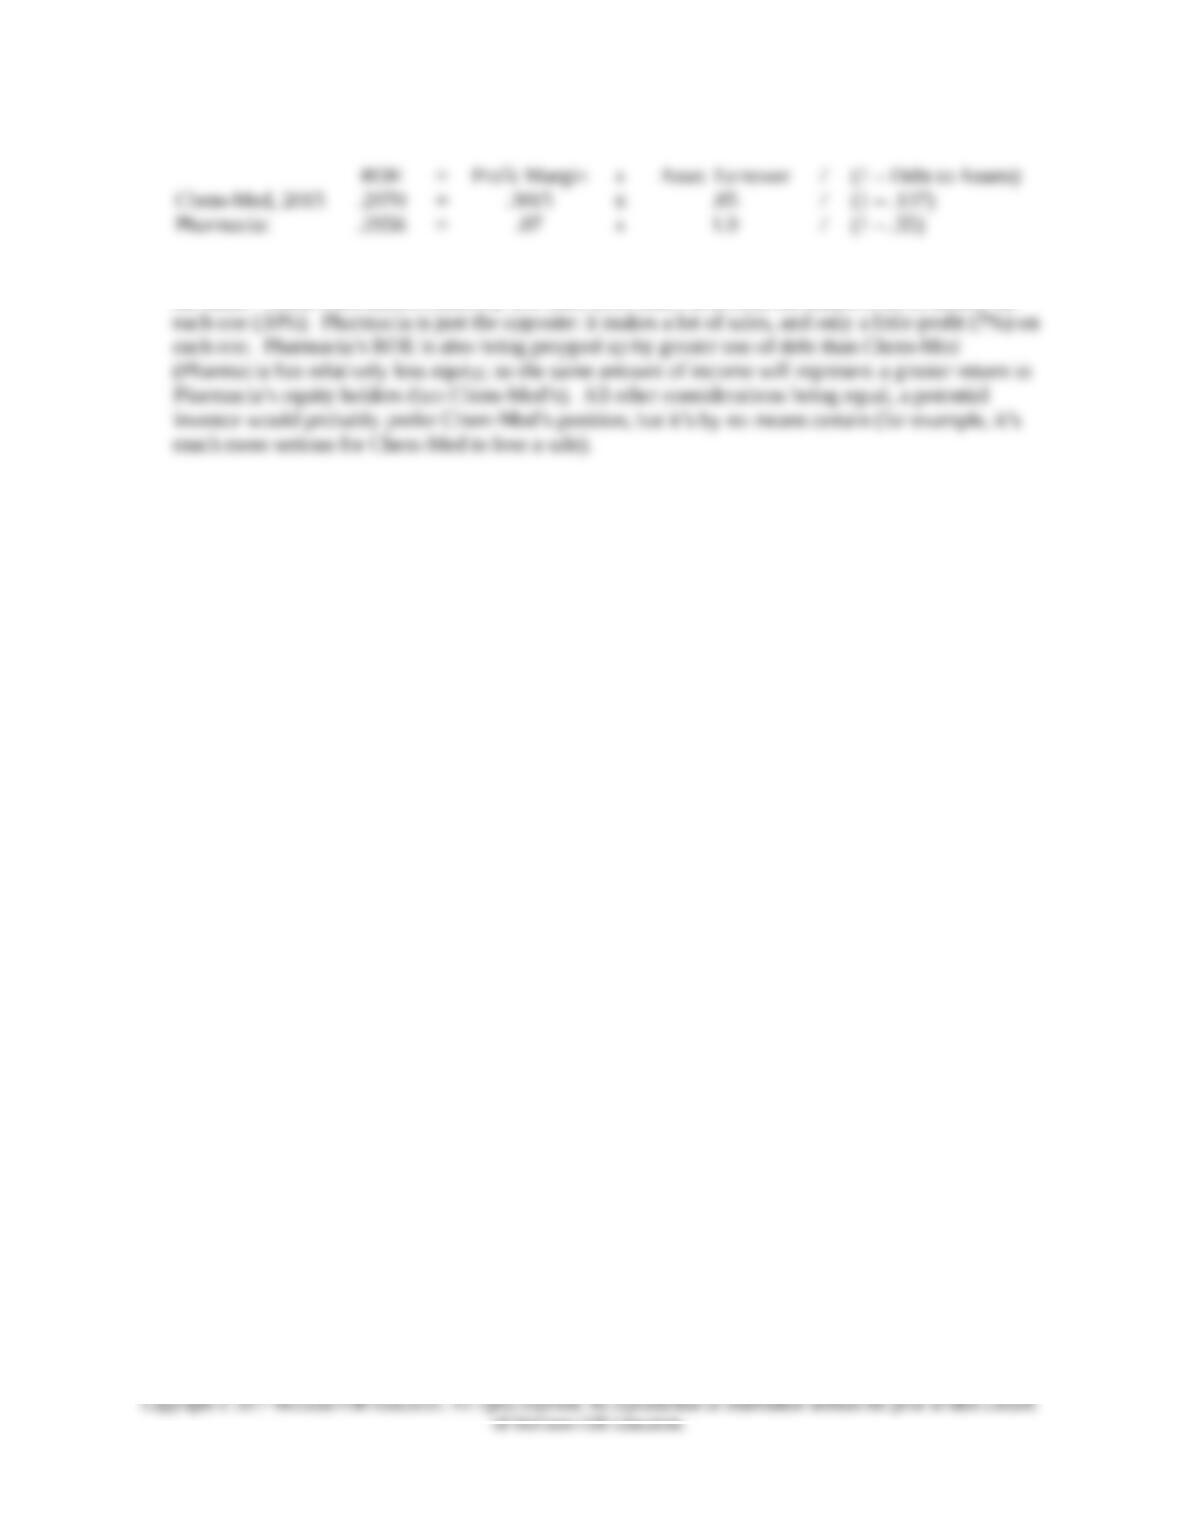
Note the drastic difference in the operation of the two companies, even though their ROEs are nearly
the same. Chem-Med makes relatively few sales (low asset turnover), but makes a lot of money on