CHAPTER 37: STRUCTURAL STAGNATION AND
GLOBALIZATION
Questions and Exercises
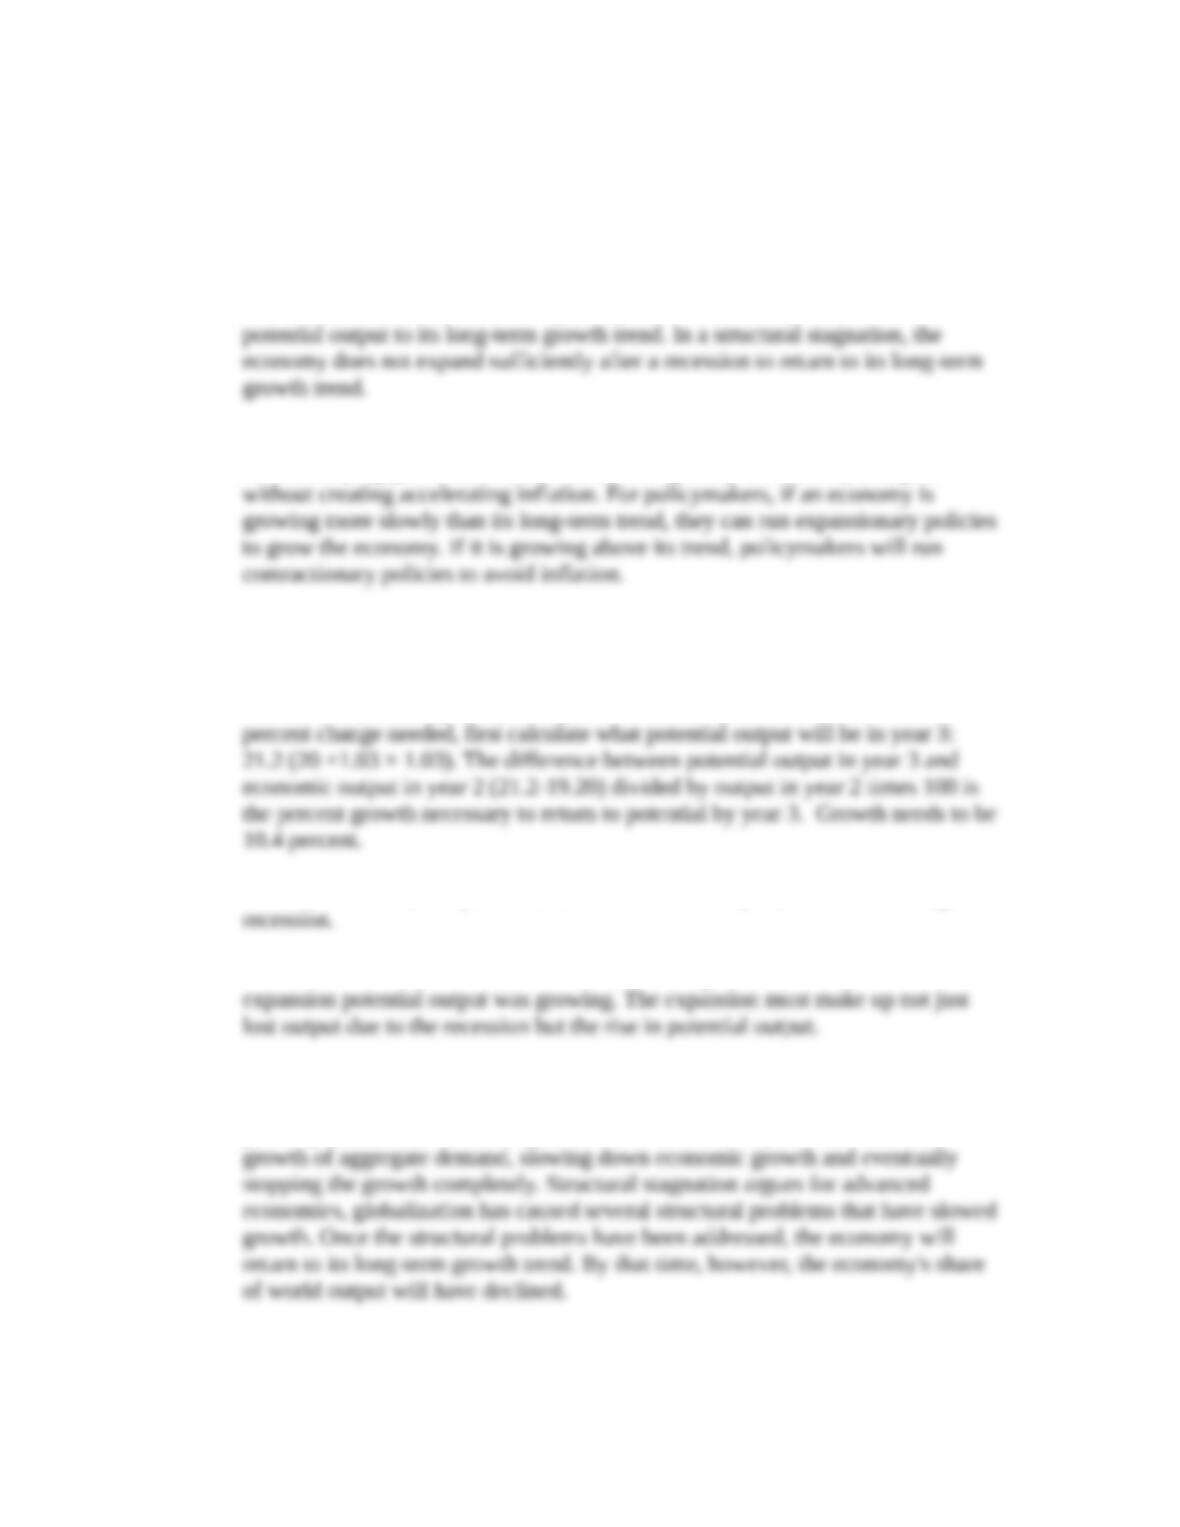
1. In a normal downturn, an economy is expected to recover quickly and return to its
2. The underlying growth trend determines how quickly an economy can grow
3. a. Economic output declined by 0.80.
b. The economy needs grow by 10.5 percent between years 2 and 3. To calculate the
c. The expansion necessary is more than three times the percent decline during the
d. The difference is accounted for the fact that during both the recession and the
4. The secular stagnation theory states that advanced countries will eventually stop
growing because investment opportunities will eventually be met. This slows the
1
© 2017 by McGraw-Hill Education. This is proprietary material solely for authorized instructor use. Not authorized for sale or distribution in
any manner. This document may not be copied, scanned, duplicated, forwarded, distributed, or posted on a website, in whole or part.
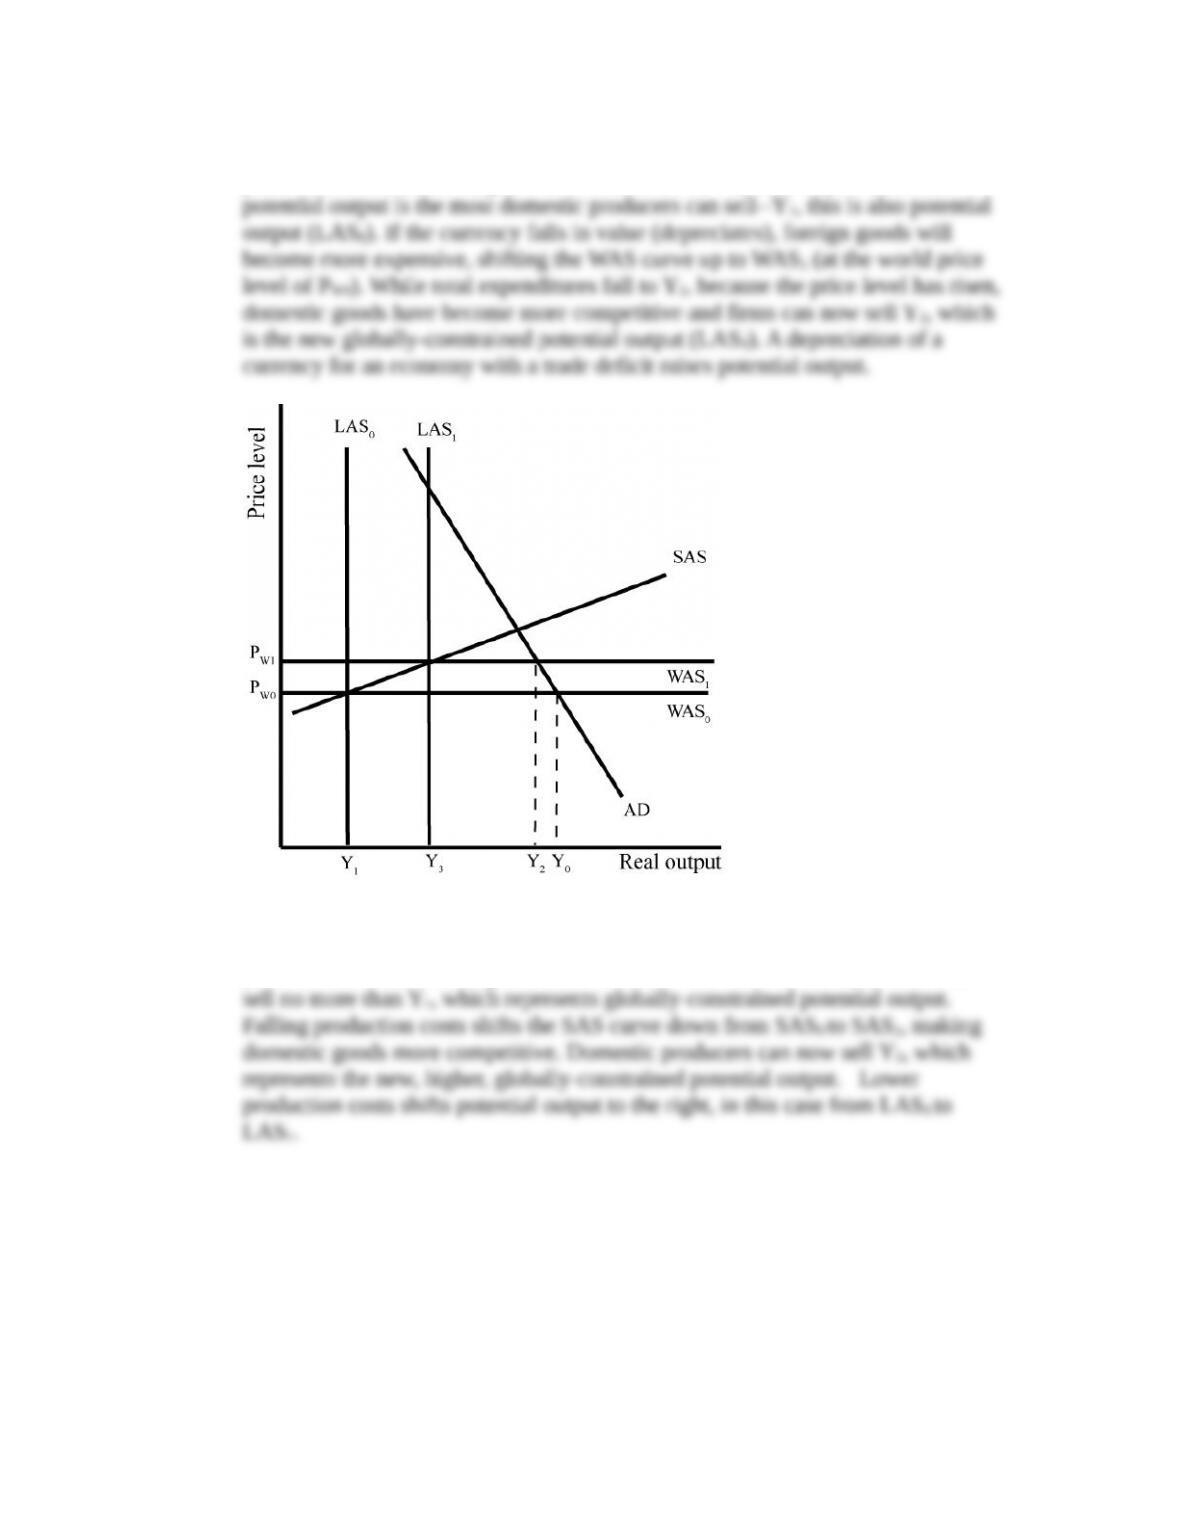
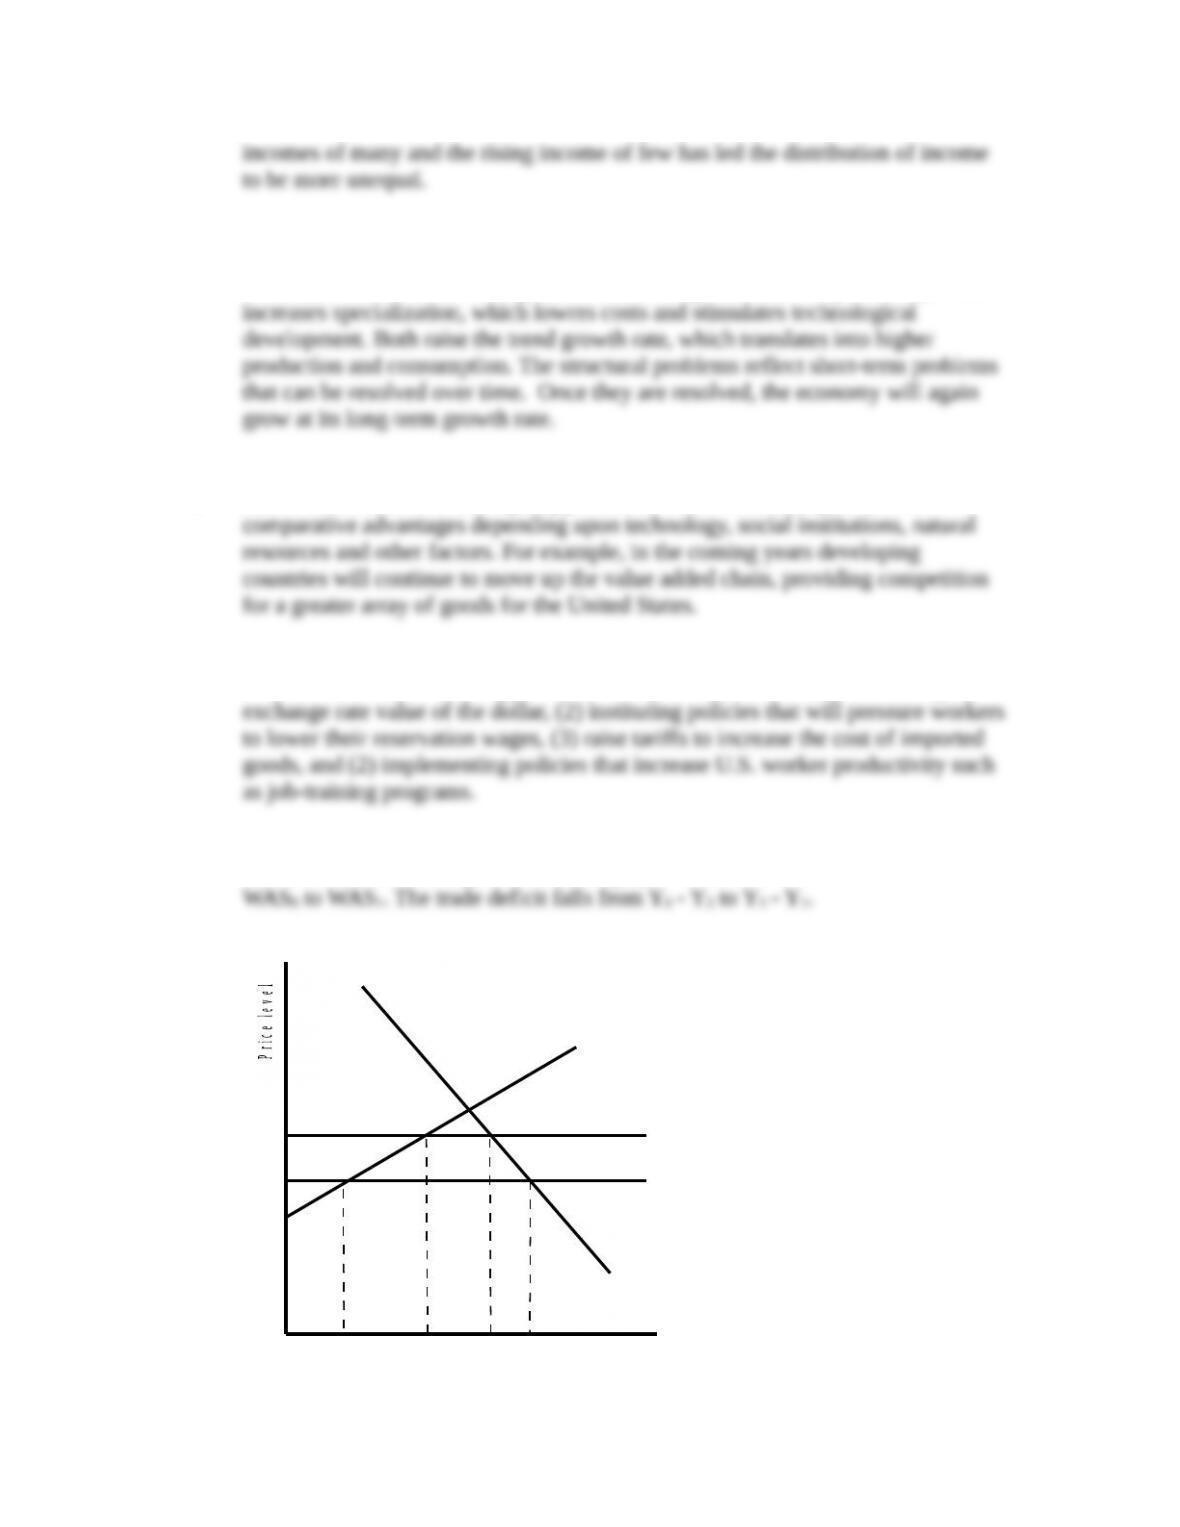
5. The economy begins with a world aggregate supply curve of WAS0 (at the world
price level of PW0) resulting in a trade deficit of Y0 – Y1. Globally-constrained
6. The economy begins with a world aggregate supply curve of WAS0 (at the world
price level of PW0) resulting in a trade deficit of Y0 – Y1. Domestic producers can
2
© 2017 by McGraw-Hill Education. This is proprietary material solely for authorized instructor use. Not authorized for sale or distribution in
any manner. This document may not be copied, scanned, duplicated, forwarded, distributed, or posted on a website, in whole or part.
Real output
Y0
PW0
Y1
AD
WAS0
SAS0
SAS1
Y2
LAS0LAS1
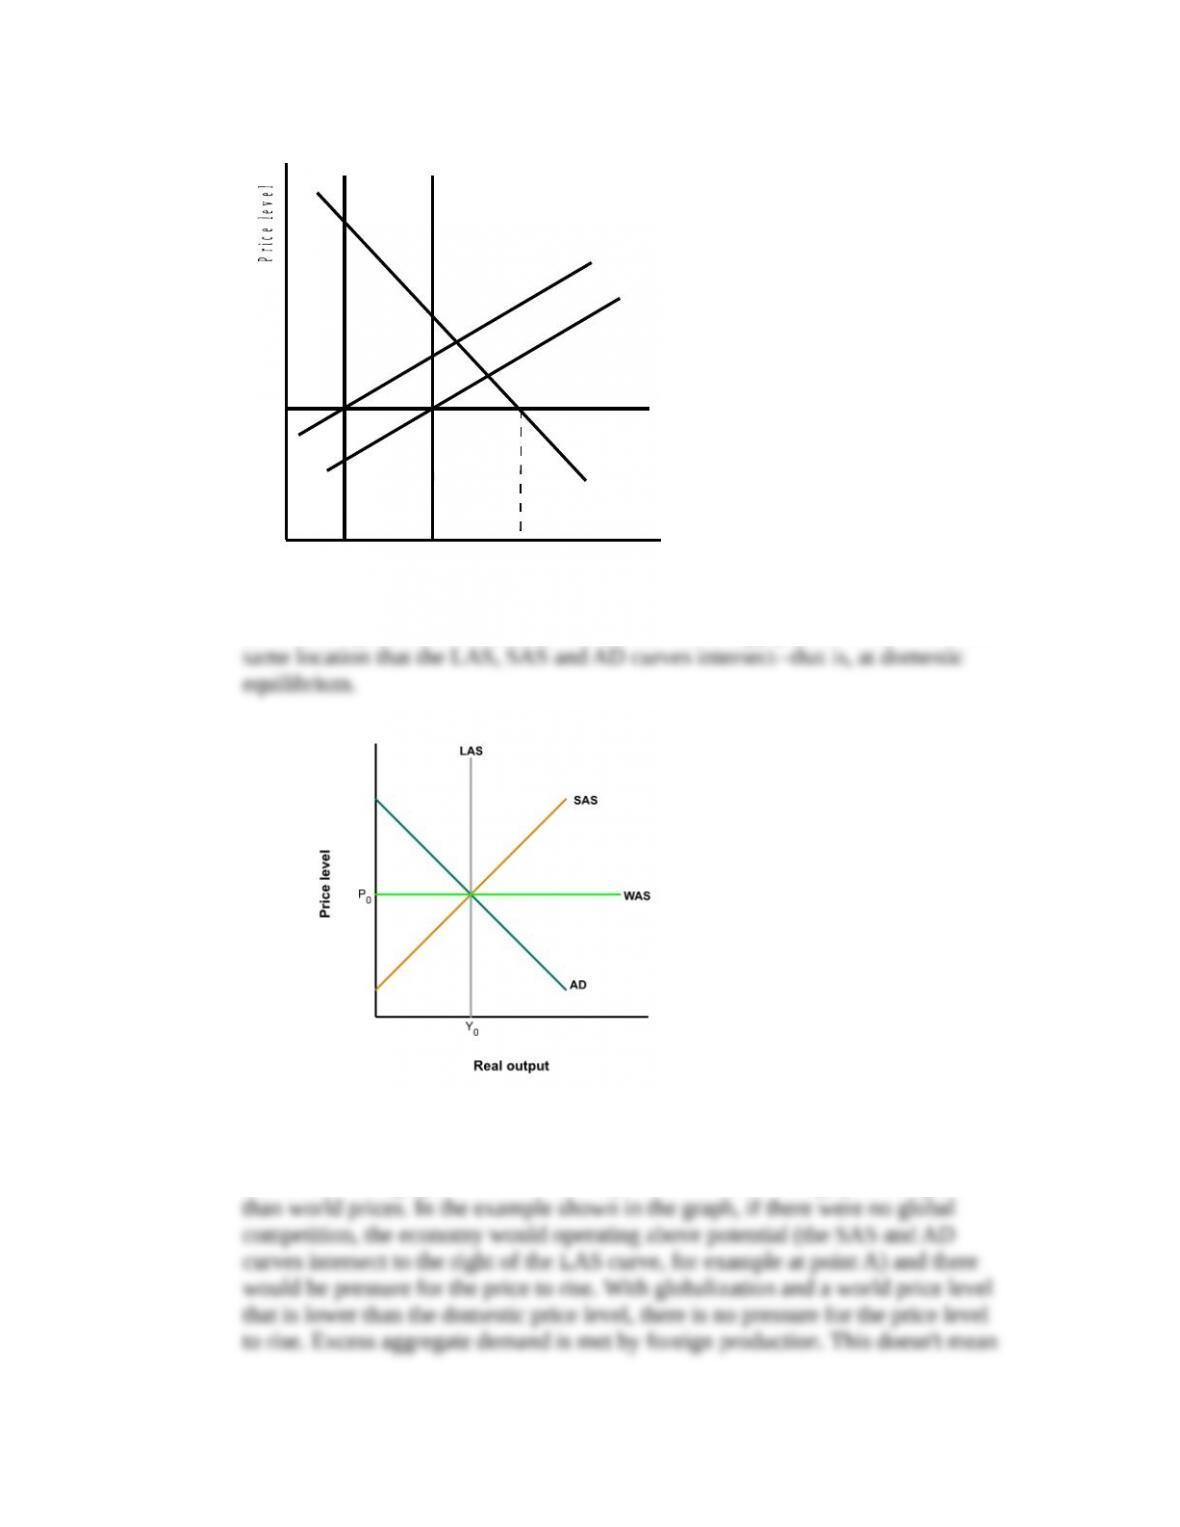
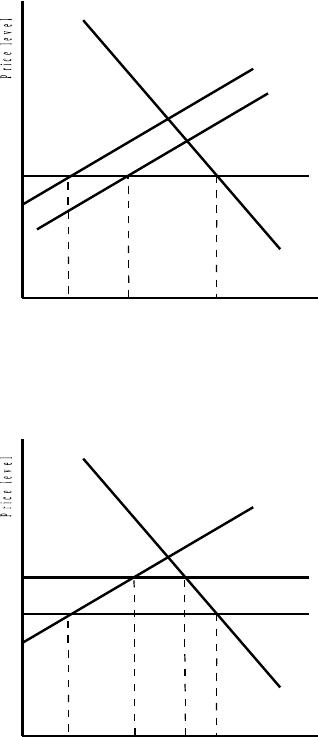
7. If the country does not run a trade deficit, the world supply curve intersects at the
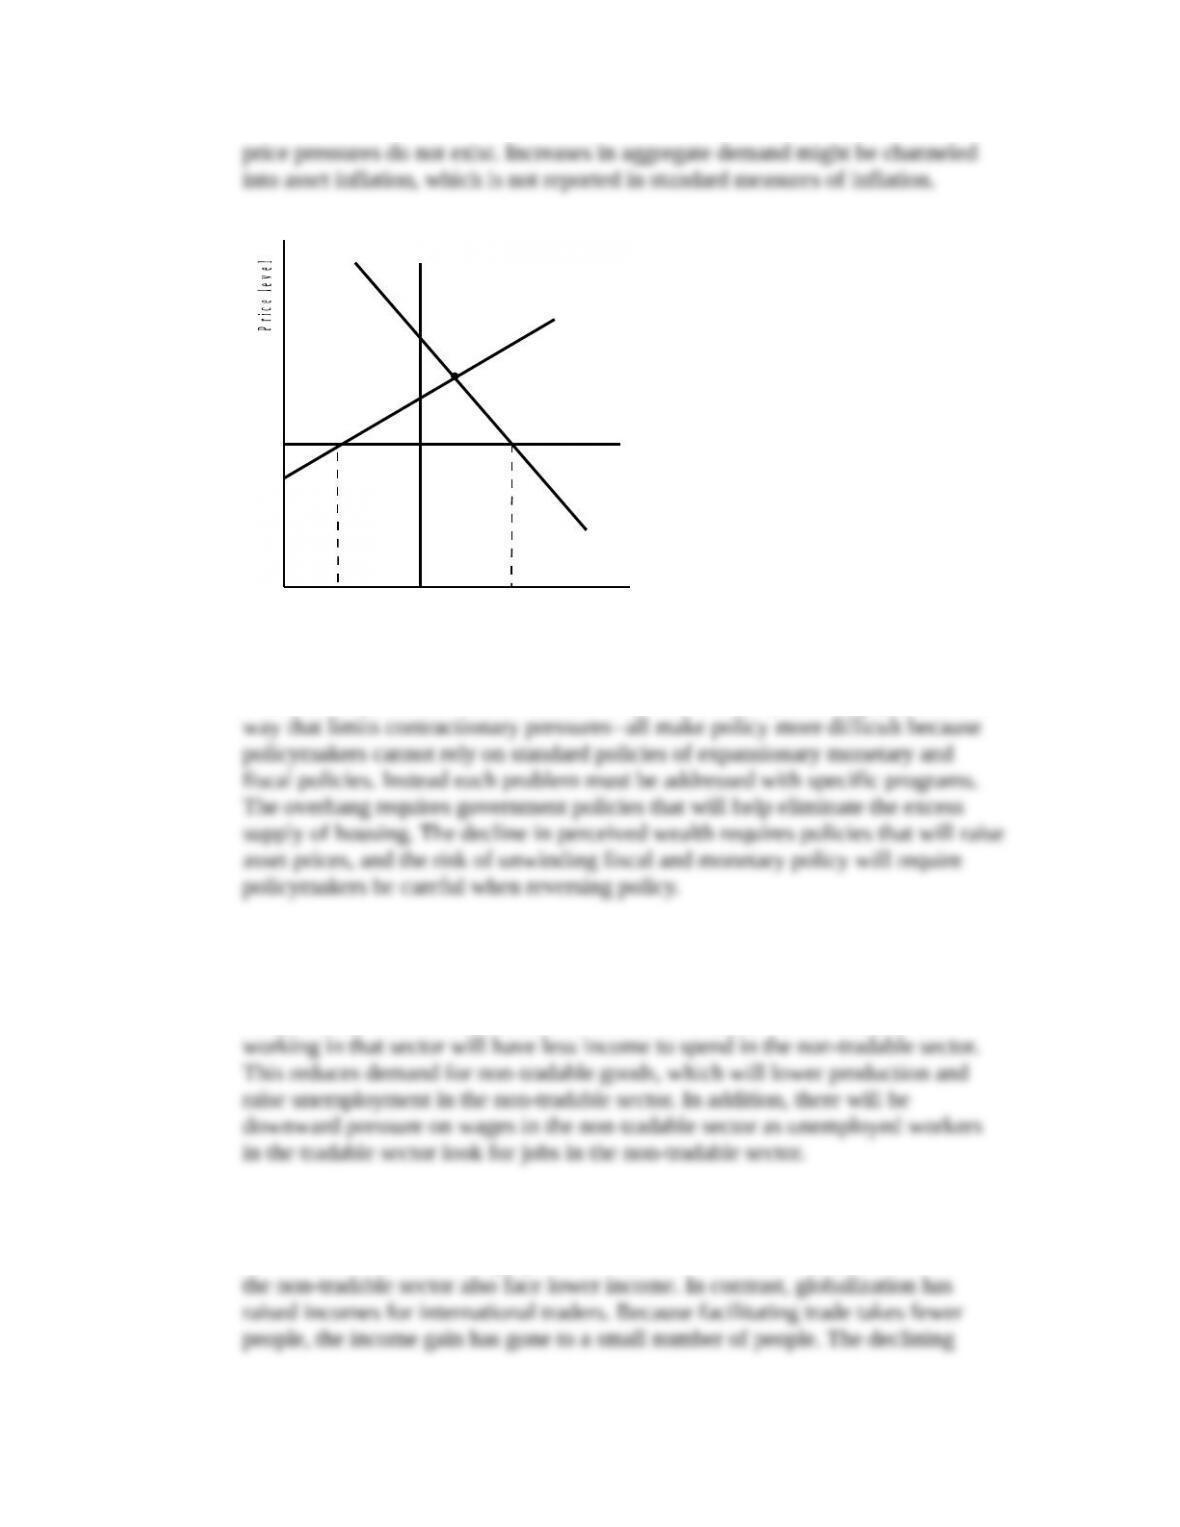
8. Globalization masks inflation by putting a ceiling on the price of domestic goods
as shown in the graph below. Domestic producers cannot charge prices higher
3
© 2017 by McGraw-Hill Education. This is proprietary material solely for authorized instructor use. Not authorized for sale or distribution in
any manner. This document may not be copied, scanned, duplicated, forwarded, distributed, or posted on a website, in whole or part.
Real output
Y0
PW
Y1
AD
WAS
SAS
Y2
LAS
A
9. The structural problems resulting from the financial crisis–housing overhang, a
reduction in perceived wealth, and the need to unwind expansionary policies in a
10. False. Even though jobs in the non-tradable sector do not face direct foreign
competition, the health of the non-tradable sector depends on employment and
income in the tradable sector. As incomes in the tradable sector decline, those
11. Globalization has made the distribution of income more unequal by lowering income
for the unskilled and not-highly skilled workers in the tradable sector. Workers in
4
© 2017 by McGraw-Hill Education. This is proprietary material solely for authorized instructor use. Not authorized for sale or distribution in
any manner. This document may not be copied, scanned, duplicated, forwarded, distributed, or posted on a website, in whole or part.
12. False. Globalization should not be restricted because while it may cause
short-term costs, there are long-term benefits to globalization. Specifically, trade
13. False. Globalization is an ongoing process in which countries gain and lose
14. Policies to deal with the long-run structural problems include (1) decreasing the
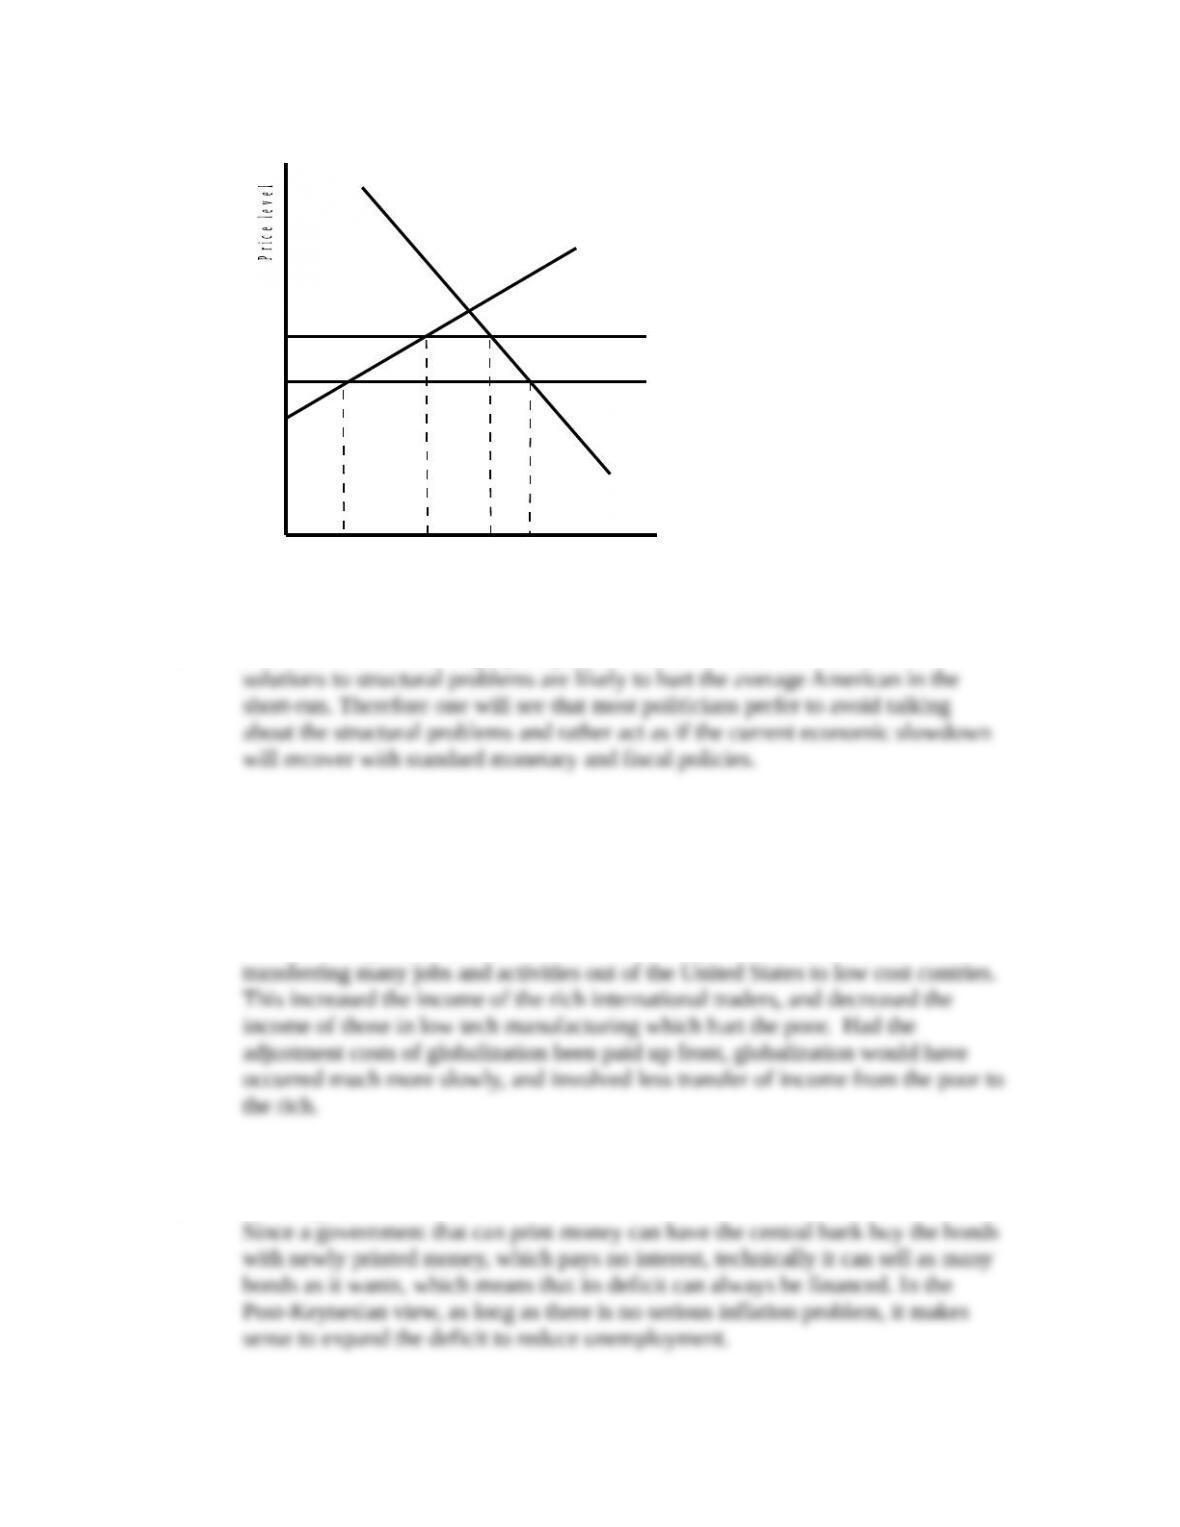
15. a. The WAS curve shifts up, shown in the graph as rise in the WAS curve from
Real output
Y0
Y1
AD
SAS
Y2
WAS0
WAS1
Y3
5
© 2017 by McGraw-Hill Education. This is proprietary material solely for authorized instructor use. Not authorized for sale or distribution in
any manner. This document may not be copied, scanned, duplicated, forwarded, distributed, or posted on a website, in whole or part.
b. The SAS curve shifts down, shown in the graph as fall in the SAS curve from
SAS0 to SAS1. The trade deficit falls from Y0 – Y2 to Y0 – Y1.
Real output
Y
0
Y
1
AD
Y
2
WAS
SAS
0
SAS
1
c. The WAS curve shifts down, shown as decline in the WAS curve from WAS0 to
WAS1. The trade deficit rises from Y1 – Y0 to Y3 – Y2.
Real output
Y
3
Y
1
AD
SAS
Y
2
WAS
1
WAS
0
Y
0
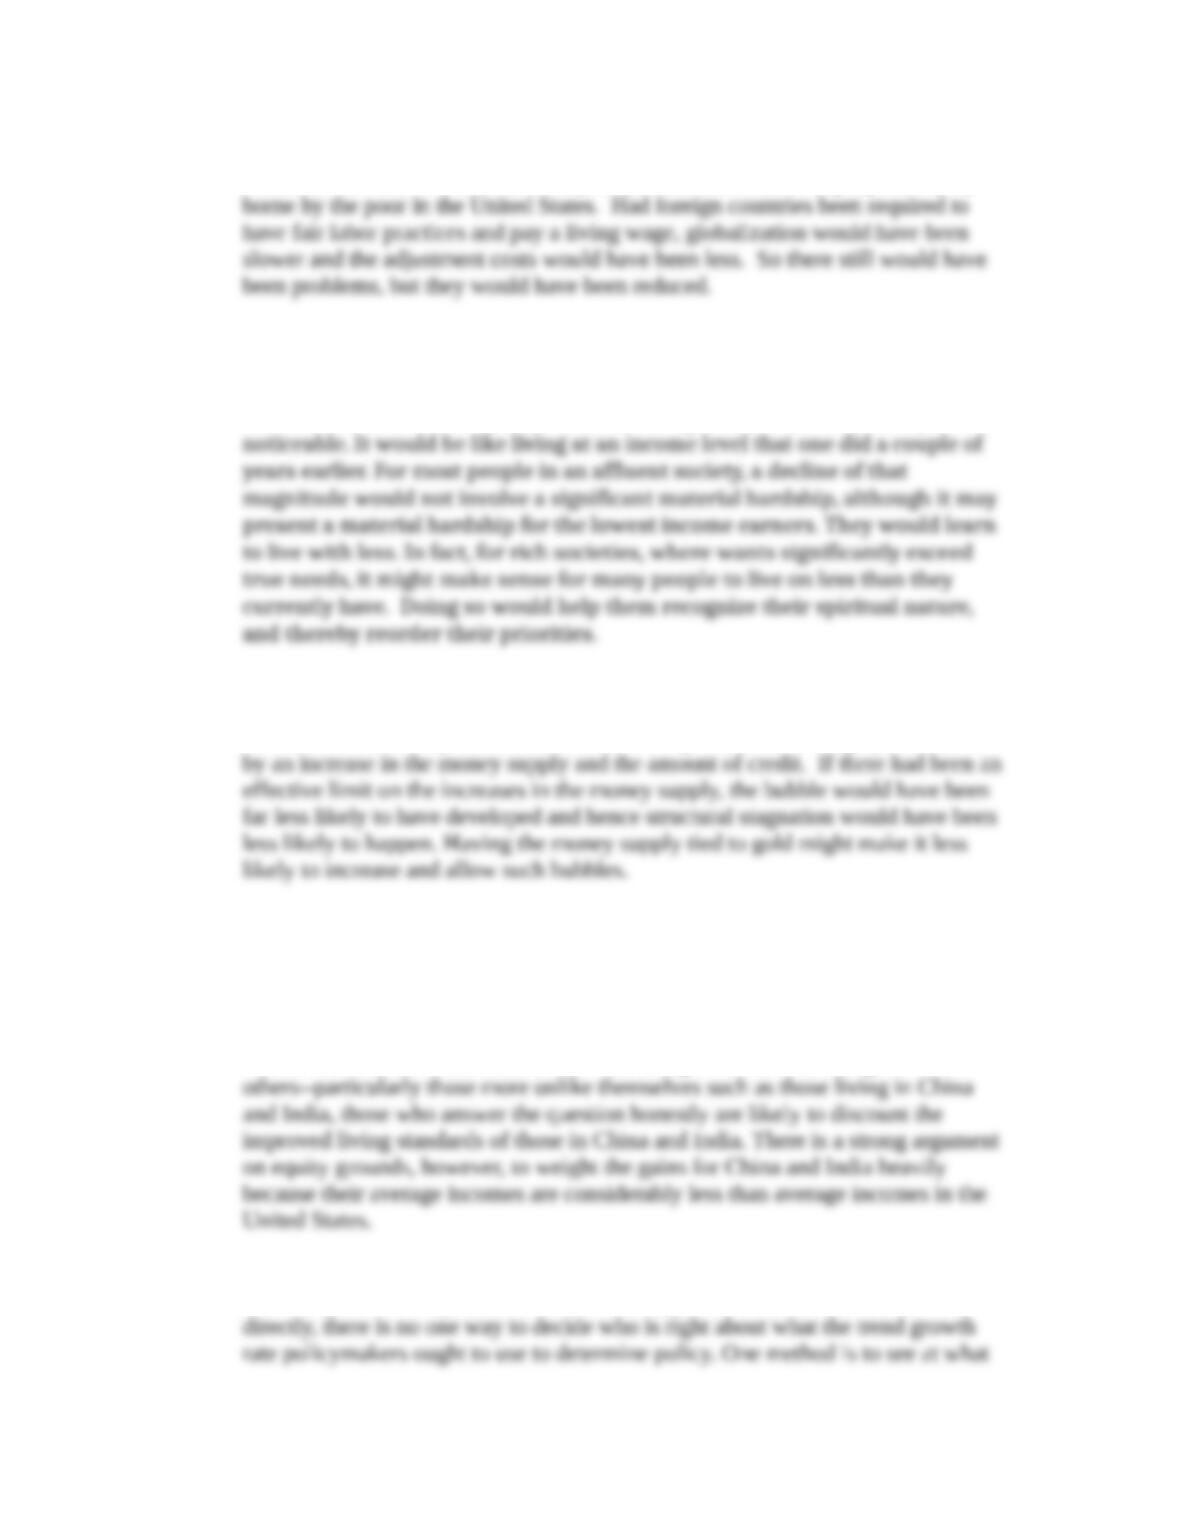
d. The answer, is the same as for part a. The WAS curve shifts up, shown as rise in
the WAS curve from WAS0 to WAS1. The trade deficit falls from Y0 – Y2 to Y3 –
Y1.
6
© 2017 by McGraw-Hill Education. This is proprietary material solely for authorized instructor use. Not authorized for sale or distribution in
any manner. This document may not be copied, scanned, duplicated, forwarded, distributed, or posted on a website, in whole or part.
Real output
Y0
Y1
AD
SAS
Y2
WAS0
WAS1
Y3
16. Politicians do not like to propose policies that have clear downsides, and the
Questions from Alternative Perspectives
1. Radical
Structural stagnation resulted from the costs of globalization, which involved
2. Post-Keynesian
7
© 2017 by McGraw-Hill Education. This is proprietary material solely for authorized instructor use. Not authorized for sale or distribution in
any manner. This document may not be copied, scanned, duplicated, forwarded, distributed, or posted on a website, in whole or part.
3. Institutionalist
Globalization involved enormous adjustment costs that were disproportionately
4. Religious
In a recession, output falls only by about 3 to 5%, which in a rich society, if
the fall in income were equally divided among residents, would hardly be
5. Austrian
The bubble that led up to the U.S. structural stagnation was in large part caused
Issues to Ponder
1. This is a normative question about which opinions differ. Because people in the
United States tend to value their own well-being over the well-being of
2. Because potential output, and therefore trend growth, cannot be measured
8
© 2017 by McGraw-Hill Education. This is proprietary material solely for authorized instructor use. Not authorized for sale or distribution in
any manner. This document may not be copied, scanned, duplicated, forwarded, distributed, or posted on a website, in whole or part.
3. Policymakers have a difficult time coming to a compromise because both options
have significant downsides. Tax increases are unpopular and will lower disposable
4. It is difficult to say how much of a safety net could be provided. It depends on
how many people would be eligible and what programs would be offered. The
safety net could include job-training programs, income support, and a better
educational system. To begin the discussion some back-of-the-envelope
9
© 2017 by McGraw-Hill Education. This is proprietary material solely for authorized instructor use. Not authorized for sale or distribution in
any manner. This document may not be copied, scanned, duplicated, forwarded, distributed, or posted on a website, in whole or part.