CHAPTER 2 APPENDIX:
GRAPHISH: THE LANGUAGE OF GRAPHS
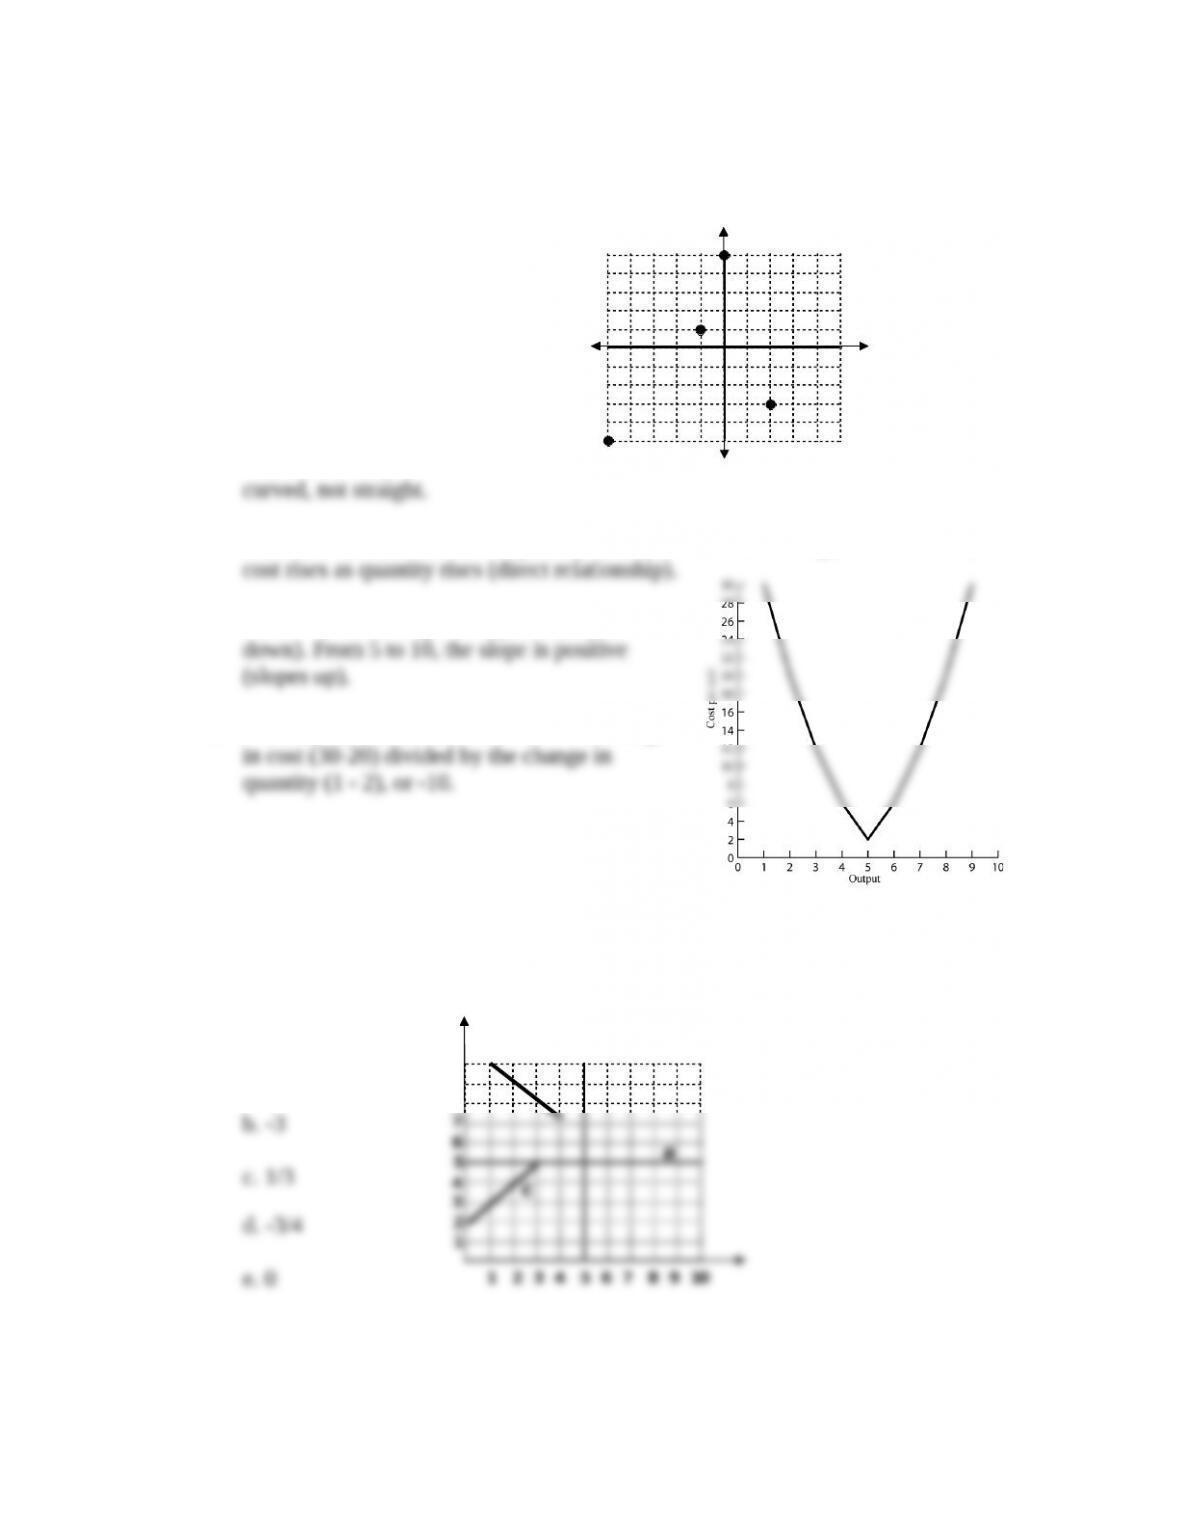
1. See the accompanying graph.
2. See the accompanying graph.
a. The relationship is nonlinear because it is
b. From 0 to 5, cost declines as quantity rises (inverse relationship). From 5 to 10,
c. From 0 to 5, the slope is negative (slopes
d. The slope between 1 and 2 units is the change
3. See the accompanying graph.
4. a. 1
5. a. C
1
© 2017 by McGraw-Hill Education. This is proprietary material solely for authorized instructor use. Not authorized for sale or distribution in
any manner. This document may not be copied, scanned, duplicated, forwarded, distributed, or posted on a website, in whole or part.
b
9
10
8
d
a
b
c
d.
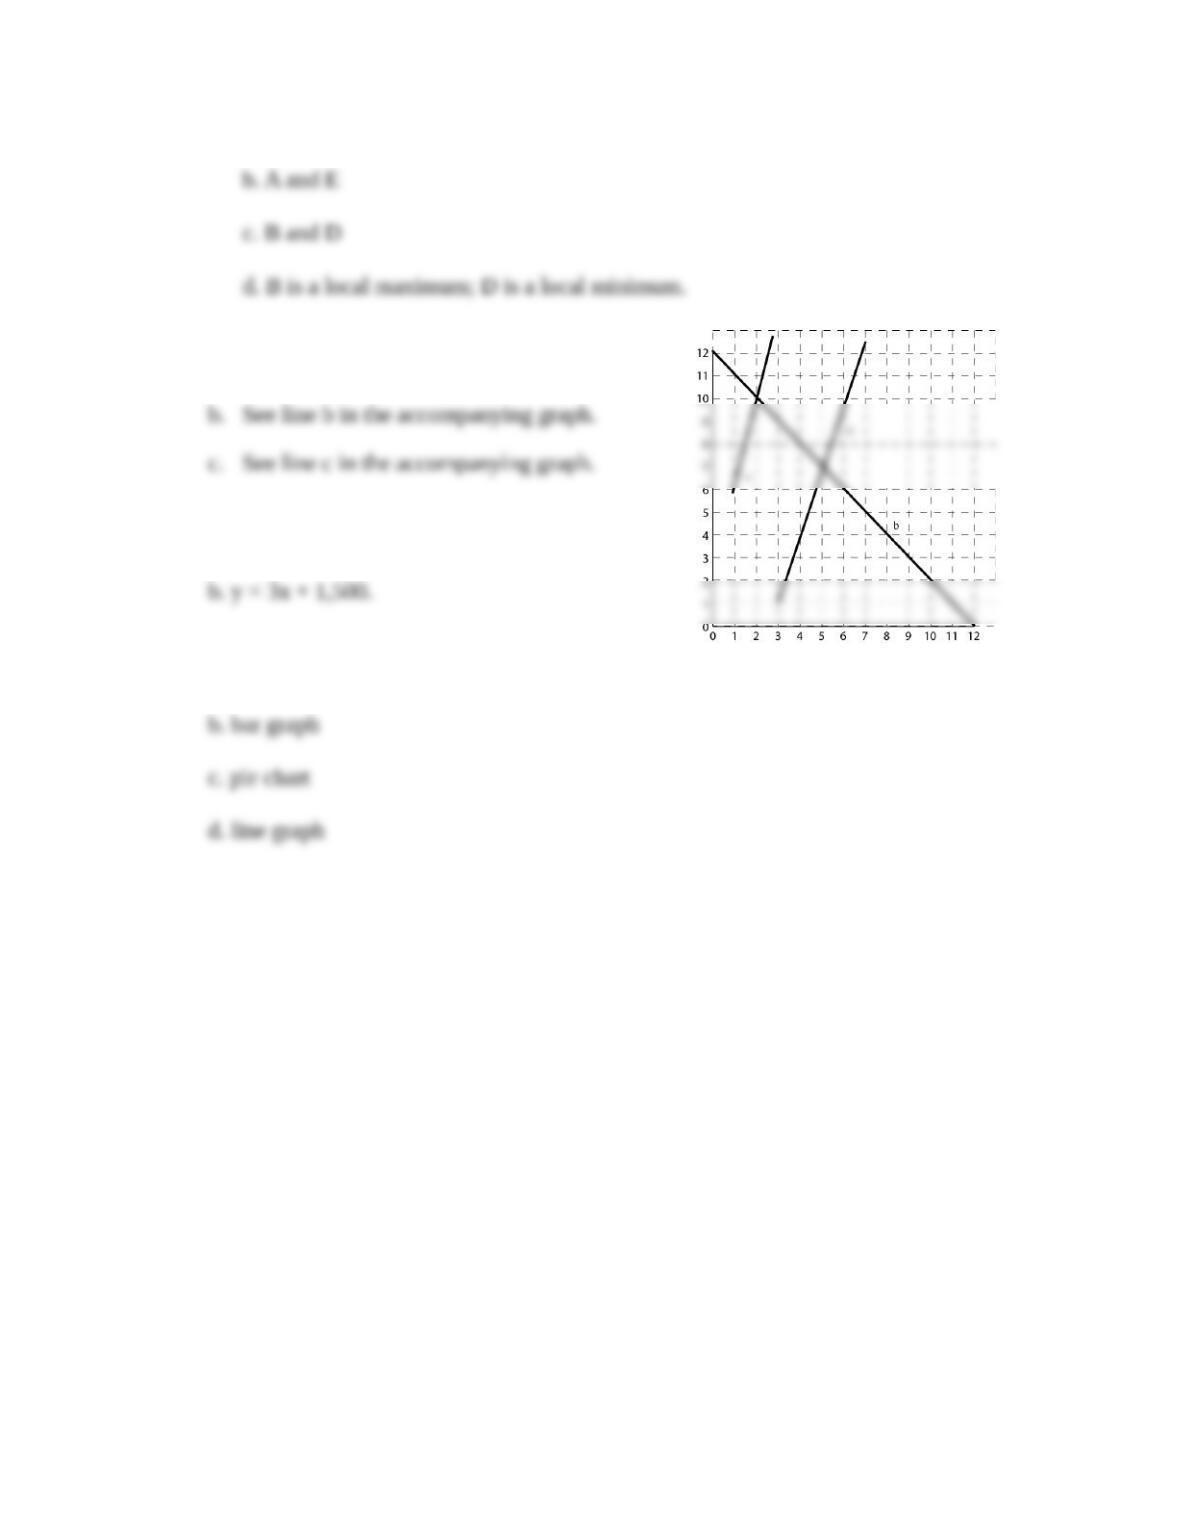
6. a. See line a in the accompanying graph.
7. a. y = 5x + 1,000
8. a. line graph
2
© 2017 by McGraw-Hill Education. This is proprietary material solely for authorized instructor use. Not authorized for sale or distribution in
any manner. This document may not be copied, scanned, duplicated, forwarded, distributed, or posted on a website, in whole or part.