Solutions Manual, Chapter 5 11
Exercise 5-4 (10 minutes)
Total
Company
Weedban
Greengrow
Sales* ……………………………..
$300,000
$90,000
$210,000
Variable expenses** …………..
183,000
36,000
147,000
Contribution margin ……………
117,000
54,000
63,000
Traceable fixed expenses ……..
66,000
45,000
21,000
Product line segment margin ..
51,000
$ 9,000
$ 42,000
Common fixed expenses not
traceable to products ………..
33,000
Net operating income ………….
$ 18,000
*
Weedban: 15,000 units × $6.00 per unit = $90,000.
Greengrow: 28,000 units × $7.50 per unit = $210,000.
**
Weedban: 15,000 units × $2.40 per unit = $36,000.
Greengrow: 28,000 units × $5.25 per unit = $147,000.
12 Managerial Accounting for Managers, 4th Edition
Exercise 5-5 (10 minutes)
1. The companywide break-even point is computed as follows:
Dollar sales for company
to break even
=
Traceable fixed expenses + Common fixed expenses
Overall CM ratio
=
$120,000 + $50,000
0.40
=
$170,000
0.40
=
$425,000
2. The break-even point for the North region is computed as follows:
Dollar sales for a
segment to break even
=
Segment traceable fixed expenses
Segment CM ratio
=
$60,000
0.30
=
$200,000

Solutions Manual, Chapter 5 13
Exercise 5-5 (continued)
3. The break-even point for the South region is computed as follows:
Dollar sales for a
segment to break even
=
Segment traceable fixed expenses
Segment CM ratio
=
$60,000
0.60
=
$100,000
14 Managerial Accounting for Managers, 4th Edition
Exercise 5-6 (30 minutes)
1. a. The unit product cost under absorption costing would be:
Direct materials……………………………………………………..
$ 6
Direct labor…………………………………………………………..
9
Variable manufacturing overhead ………………………………
3
Total variable costs …………………………………………………
18
Fixed manufacturing overhead ($300,000 ÷ 25,000 units)
12
Absorption costing unit product cost ………………………….
$30
b. The absorption costing income statement:
Sales (20,000 units × $50 per unit) ………………………
$1,000,000
Cost of goods sold (20,000 units × $30 per unit) …….
600,000
Gross margin …………………………..………………………
400,000
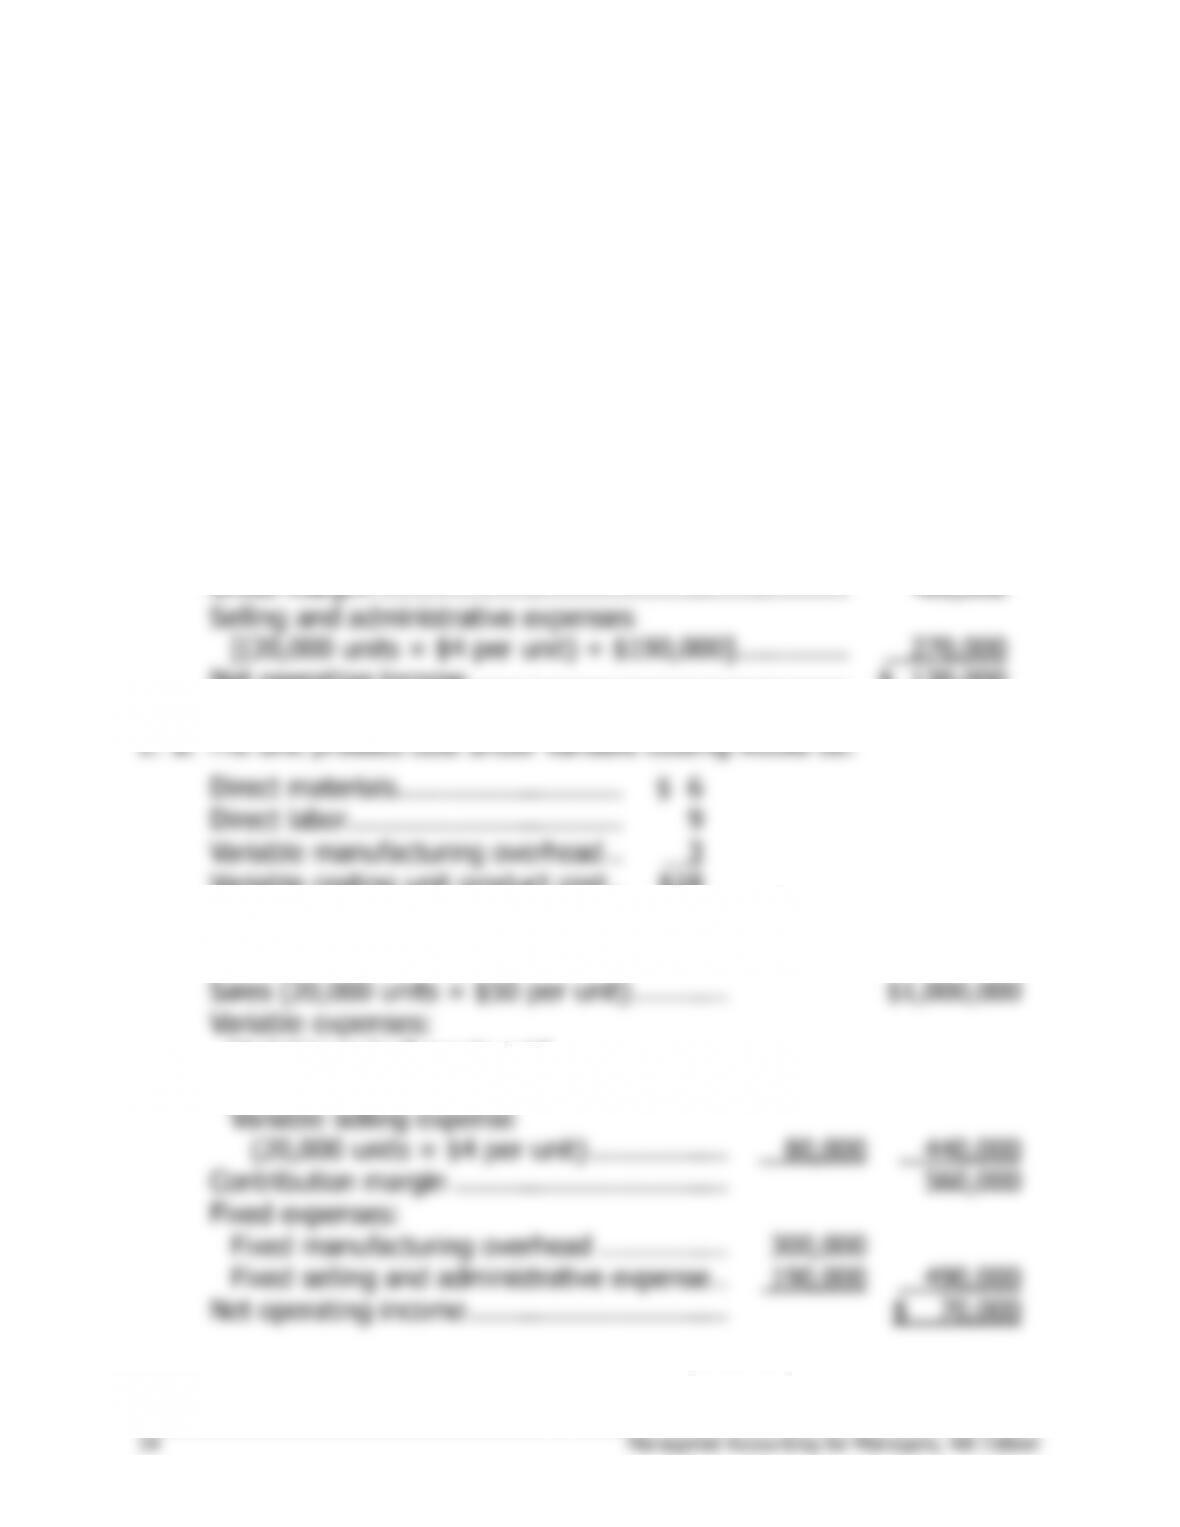
Selling and administrative expenses
[(20,000 units × $4 per unit) + $190,000] …………..
270,000
Net operating income ………………………………………..
$ 130,000
2. a. The unit product cost under variable costing would be:
Direct materials……………………….
$ 6
Direct labor…………………………….
9
Variable manufacturing overhead ..
3
Variable costing unit product cost ..
$18
b. The variable costing income statement:
Sales (20,000 units × $50 per unit) …………
$1,000,000
Variable expenses:
Variable cost of goods sold
(20,000 units × $18 per unit) ……………
$360,000
Variable selling expense
(20,000 units × $4 per unit) ……………..
80,000
440,000
Contribution margin …………………………….
560,000
Fixed expenses:
Fixed manufacturing overhead …………….
300,000
Fixed selling and administrative expense ..
190,000
490,000
Net operating income …………………………..
$ 70,000
Solutions Manual, Chapter 5 15
Exercise 5-7 (10 minutes)
Divisions
Total Company
North
South
Amount
%
Amount
%
Amount
%
Sales ………………………………………..
$500,000
100.0
$300,000
100.0
$200,000
100.0
Variable expenses ……………………….
270,000
54.0
150,000
50.0
120,000
60.0
Contribution margin …………………….
230,000
46.0
150,000
50.0
80,000
40.0
Traceable fixed expenses ………………
130,000
26.0
80,000
26.7
50,000
25.0
Territorial segment margin ……………
100,000
20.0
$ 70,000
23.3
$30,000
15.0
Common fixed expenses ………………
90,000
18.0
Net operating income …………………..
$ 10,000
2.0

16 Managerial Accounting for Managers, 4th Edition
Exercise 5-8 (10 minutes)
Sales were above the company’s break-even sales and yet the company
sustained a loss. The apparent contradiction is explained by the fact that
the CVP analysis is based on variable costing, whereas the income reported
break-even point on a variable costing basis.
Solutions Manual, Chapter 5 17
Exercise 5-9 (30 minutes)
1 a. Under variable costing, only the variable manufacturing costs are
included in product costs.
Year 1
Year 2
Direct materials ………………………………
$25
$25
Direct labor ……………………………………
15
15
Variable manufacturing overhead ……….
5
5
Variable costing unit product cost ……….
$45
$45
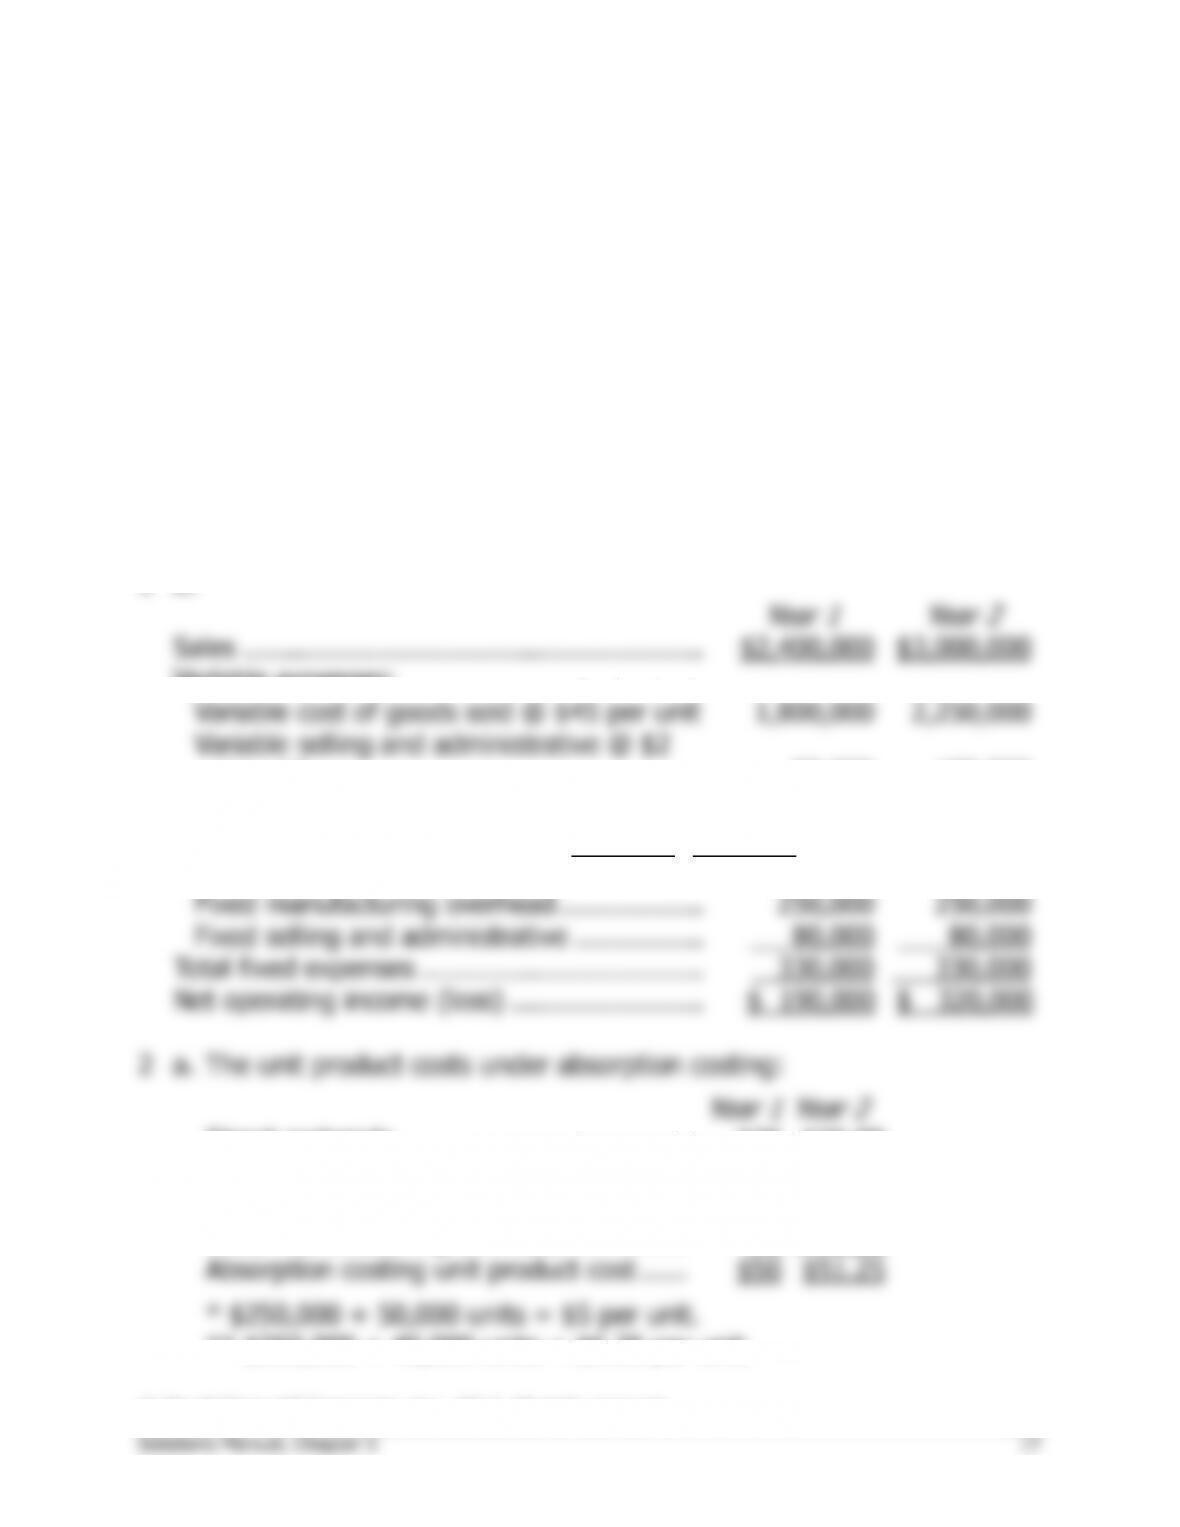
1 b.
Year 1
Year 2
Sales …………………………………………………
$2,400,000
$3,000,000
Variable expenses:
Variable cost of goods sold @ $45 per unit
1,800,000
2,250,000
Variable selling and administrative @ $2
per unit …………………………..…………….
80,000
100,000
Total variable expenses ………………………….
1,880,000
2,350,000
Contribution margin ………………………………
520,000
650,000
Fixed expenses:
Fixed manufacturing overhead ………………
250,000
250,000
Fixed selling and administrative …………….
80,000
80,000
Total fixed expenses ……………………………..
330,000
330,000
Net operating income (loss) ……………………
$ 190,000
$ 320,000
2 a. The unit product costs under absorption costing:
Year 1
Year 2
Direct materials ………………………………
$25
$25.00
Direct labor ……………………………………
15
15.00
Variable manufacturing overhead ……….
5
5.00
Fixed manufacturing overhead …………..
*5
**6.25
Absorption costing unit product cost ……
$50
$51.25
* $250,000 ÷ 50,000 units = $5 per unit.
** $250,000 ÷ 40,000 units = $6.25 per unit.
18 Managerial Accounting for Managers, 4th Edition
Exercise 5-9 (continued)
2 b. The absorption costing income statements appears below:
Year 1
Year 2
Sales …………………………..…………………
$2,400,000
$3,000,000
Cost of goods sold…………………………….
*2,000,000
**2,550,000
Gross margin …………………………………..
400,000
450,000
Selling and administrative expenses ……..
160,000
180,000
Net operating income ………………………..
$ 240,000
$ 270,000
* 40,000 units × $50 per unit = $2,000,000
** (40,000 units × $51.25 per unit) + (10,000 units × $50 per unit)
= $2,550,000
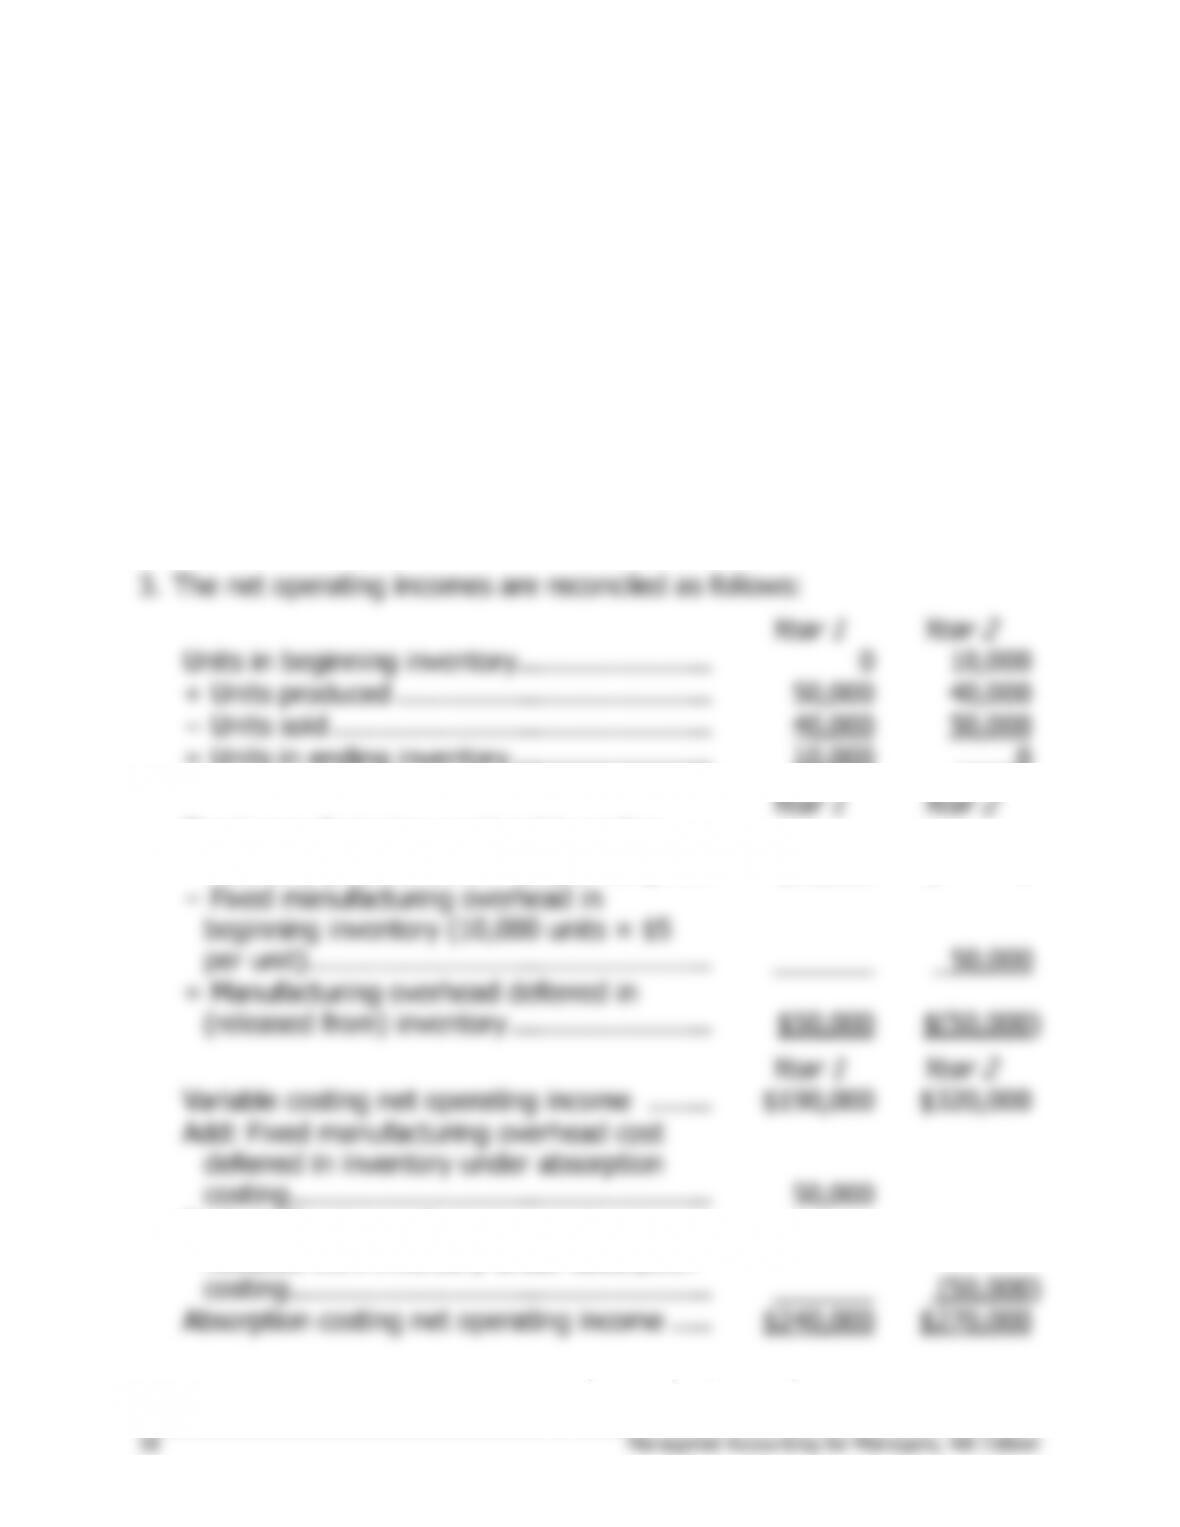
Year 1
Year 2
Units in beginning inventory ……………………
0
10,000
+ Units produced …………………………..…….
50,000
40,000
− Units sold ………………………………………..
40,000
50,000
= Units in ending inventory …………………….
10,000
0
Year 1
Year 2
Fixed manufacturing overhead in ending
inventory (10,000 units × $5 per unit) ……
$50,000
$ 0
− Fixed manufacturing overhead in
beginning inventory (10,000 units × $5
per unit) …………………………………………..
50,000
= Manufacturing overhead deferred in
(released from) inventory …………………….
$50,000
$(50,000)
Year 1
Year 2
Variable costing net operating income ……..
$190,000
$320,000
Add: Fixed manufacturing overhead cost
deferred in inventory under absorption
costing …………………………………………….
50,000
Deduct: Fixed manufacturing overhead cost
released from inventory under absorption
costing …………………………………………….
(50,000)
Absorption costing net operating income …..
$240,000
$270,000
Solutions Manual, Chapter 5 19
Exercise 5-10 (20 minutes)
1. The companywide break-even point is computed as follows:
Dollar sales for company
to break even
=
Traceable fixed expenses + Common fixed expenses
Overall CM ratio
=
$141,000 + $59,000
0.25
=
$200,000
0.25
=
$800,000
2. The break-even point for the East region is computed as follows:
Dollar sales for a
segment to break even
=
Segment traceable fixed expenses
Segment CM ratio
=
$50,000
0.20
=
$250,000
20 Managerial Accounting for Managers, 4th Edition
Exercise 5-10 (continued)
3. The break-even point for the West region is computed as follows:
Dollar sales for a
segment to break even
=
Segment traceable fixed expenses
Segment CM ratio
=
$91,000
0.35
=
$260,000
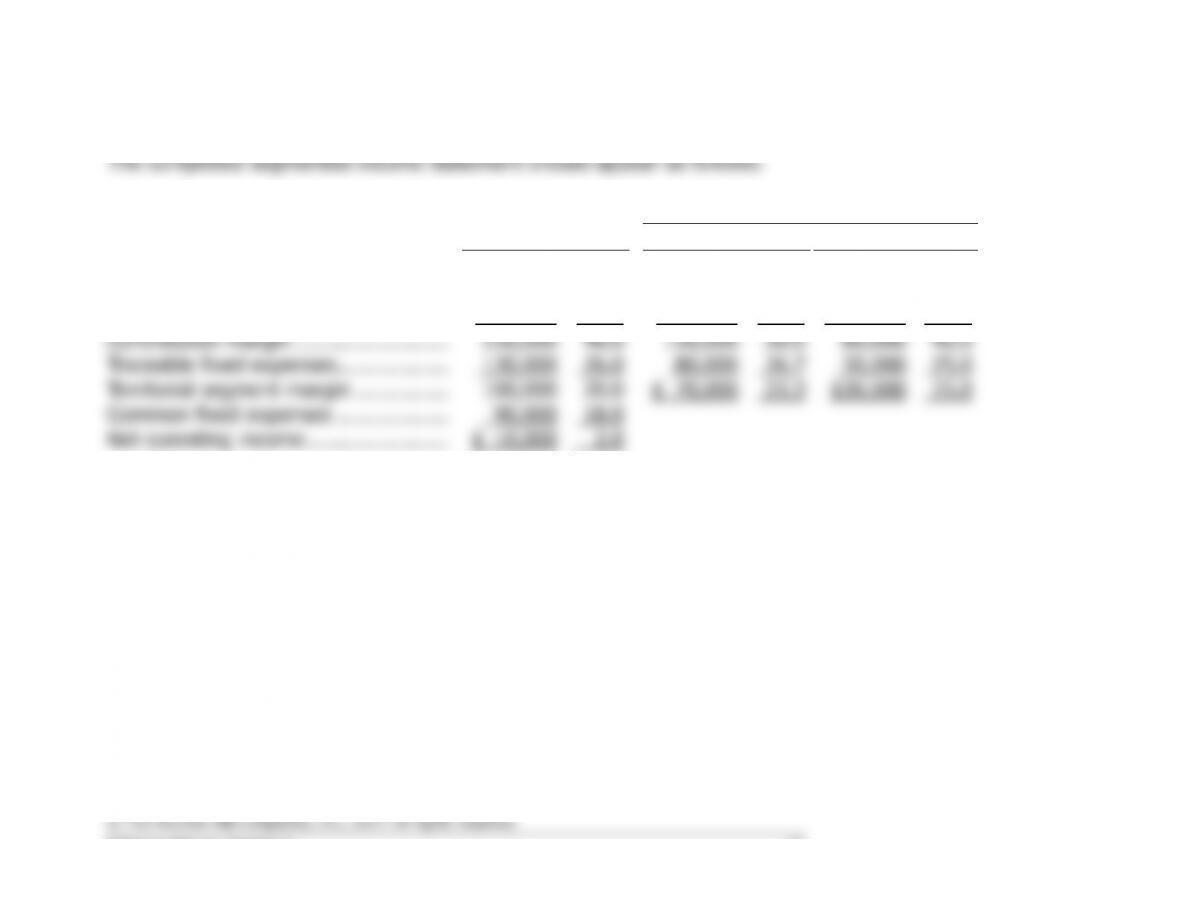
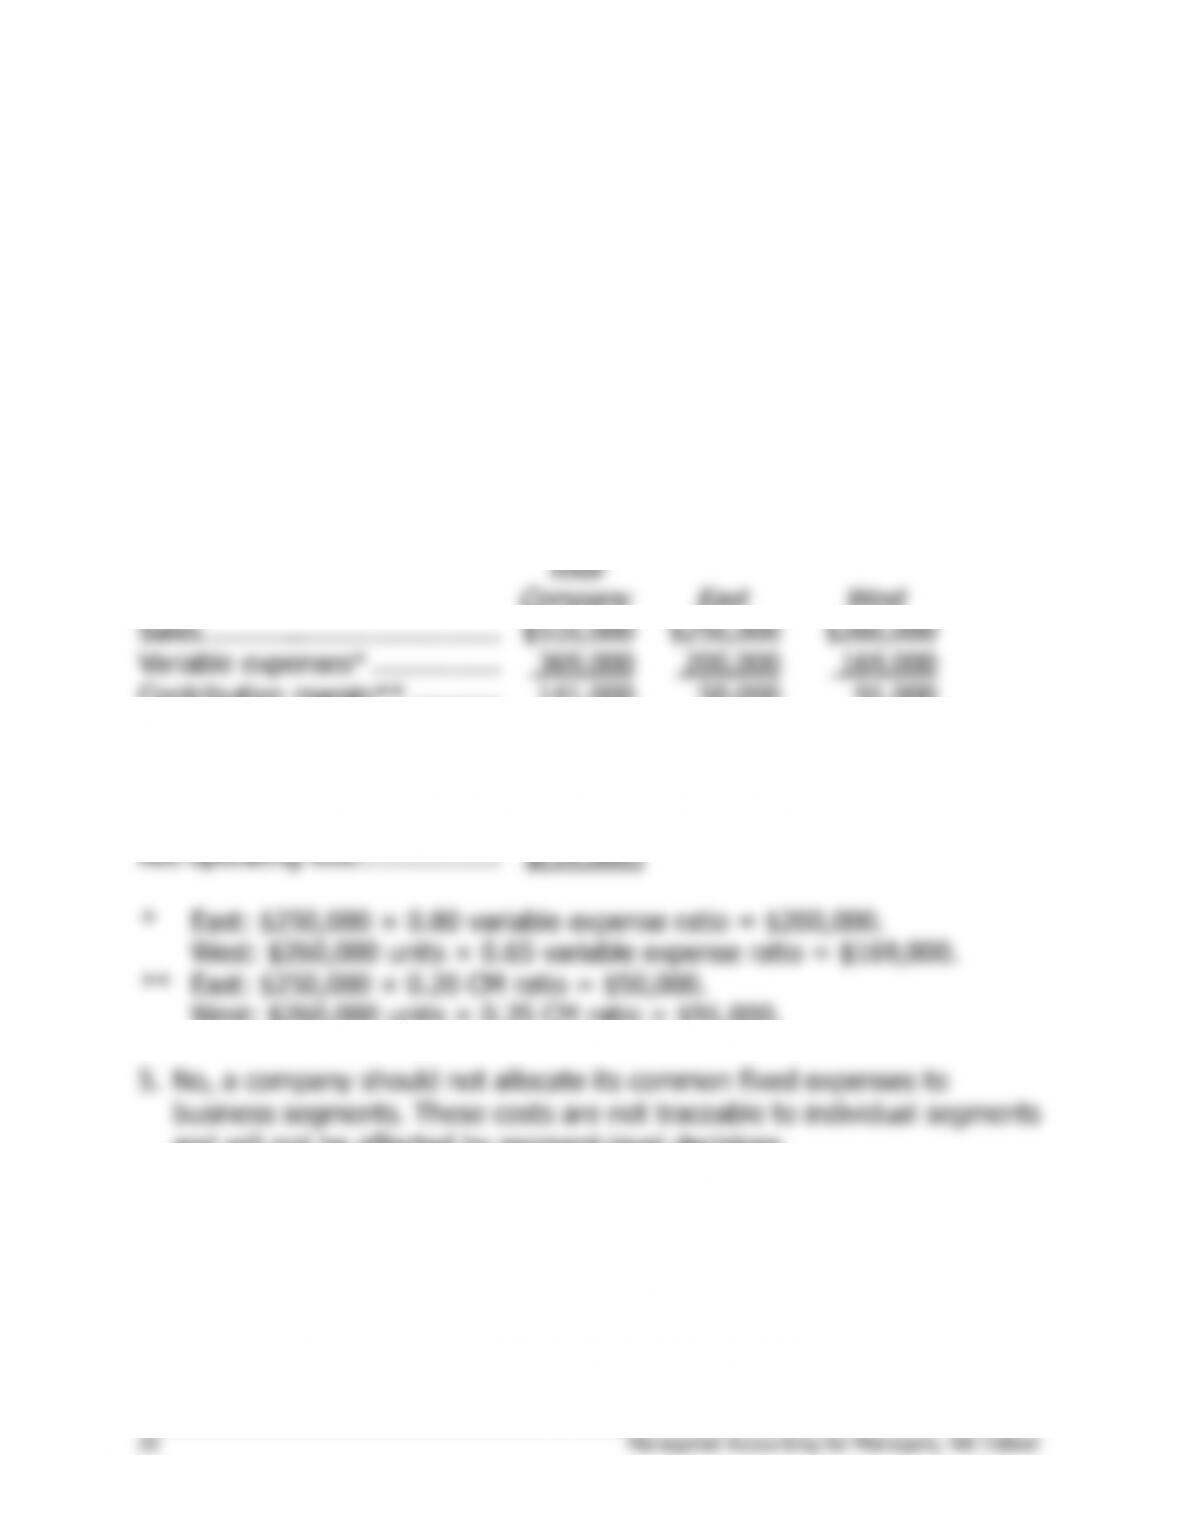
4. The new segmented income statement is computed as follows:
Total
Company
East
West
Sales ……………………………….
$510,000
$250,000
$260,000
Variable expenses* …………….
369,000
200,000
169,000
Contribution margin** ………..
141,000
50,000
91,000
Traceable fixed expenses ……..
141,000
50,000
91,000
Product line segment margin ..
0
$ 0
$ 0
Common fixed expenses not
traceable to products ………..
59,000
Net operating loss ………………
$(59,000)
*
East: $250,000 × 0.80 variable expense ratio = $200,000.
West: $260,000 units × 0.65 variable expense ratio = $169,000.
**
East: $250,000 × 0.20 CM ratio = $50,000.
West: $260,000 units × 0.35 CM ratio = $91,000.
5. No, a company should not allocate its common fixed expenses to