Solutions Manual, Chapter 3 11
Exercise 3-3 (continued)
This can be verified as follows:
Profit
= Unit CM × Q − Fixed expenses
= $5 × Q − $16,000
= $5 × 3,200 − $16,000
= $16,000 − $16,000
= $0
12 Managerial Accounting for Managers, 4th Edition
Exercise 3-4 (10 minutes)
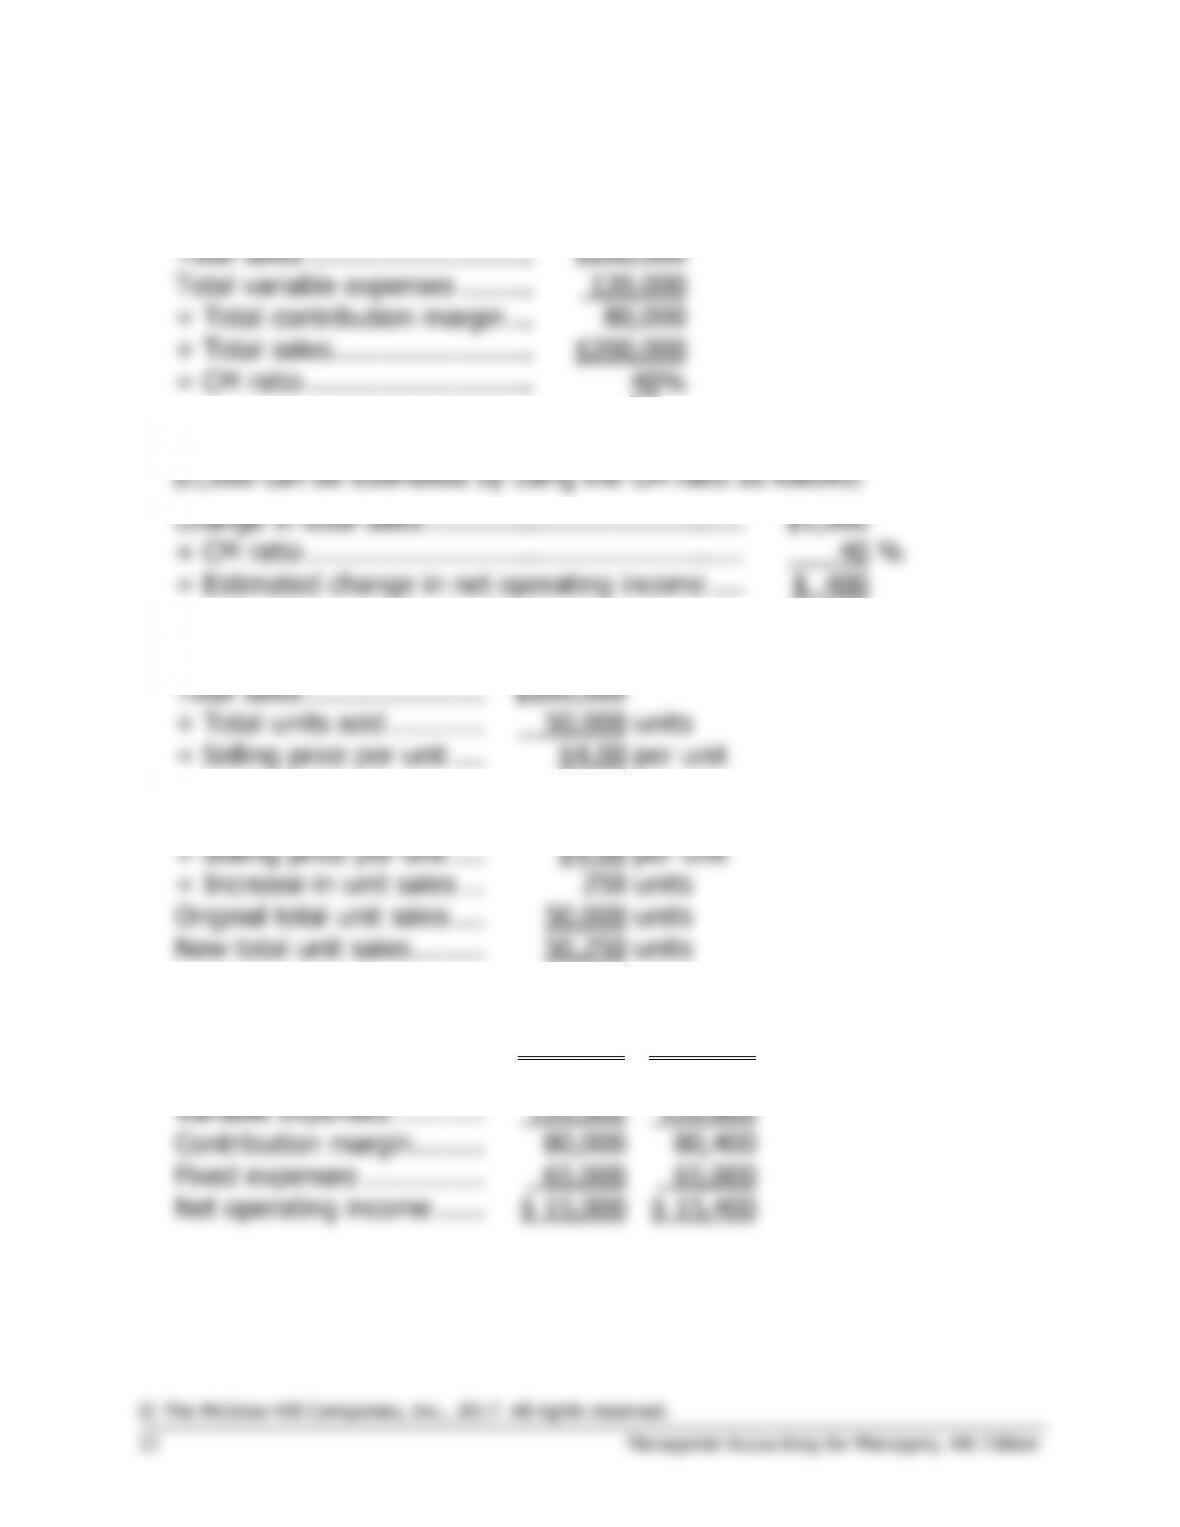
1. The company’s contribution margin (CM) ratio is:
Total sales ……………………….
$200,000
Total variable expenses ………
120,000
= Total contribution margin …
80,000
÷ Total sales …………………….
$200,000
= CM ratio ……………………….
40%
2. The change in net operating income from an increase in total sales of
Change in total sales …………………………………
$1,000
× CM ratio ………………………………………………
40
%
= Estimated change in net operating income ….
$ 400
This computation can be verified as follows:
Total sales ………………….
$200,000
÷ Total units sold …………
50,000
units
= Selling price per unit ….
$4.00
per unit
Increase in total sales ……
$1,000
÷ Selling price per unit ….
$4.00
per unit
= Increase in unit sales …
250
units
Original total unit sales ….
50,000
units
New total unit sales ………
50,250
units
Original
New
Total unit sales…………….
50,000
50,250
Sales …………………………
$200,000
$201,000
Variable expenses ………..
120,000
120,600
Contribution margin ………
80,000
80,400
Fixed expenses ……………
65,000
65,000
Net operating income ……
$ 15,000
$ 15,400
Solutions Manual, Chapter 3 13
Exercise 3-5 (20 minutes)
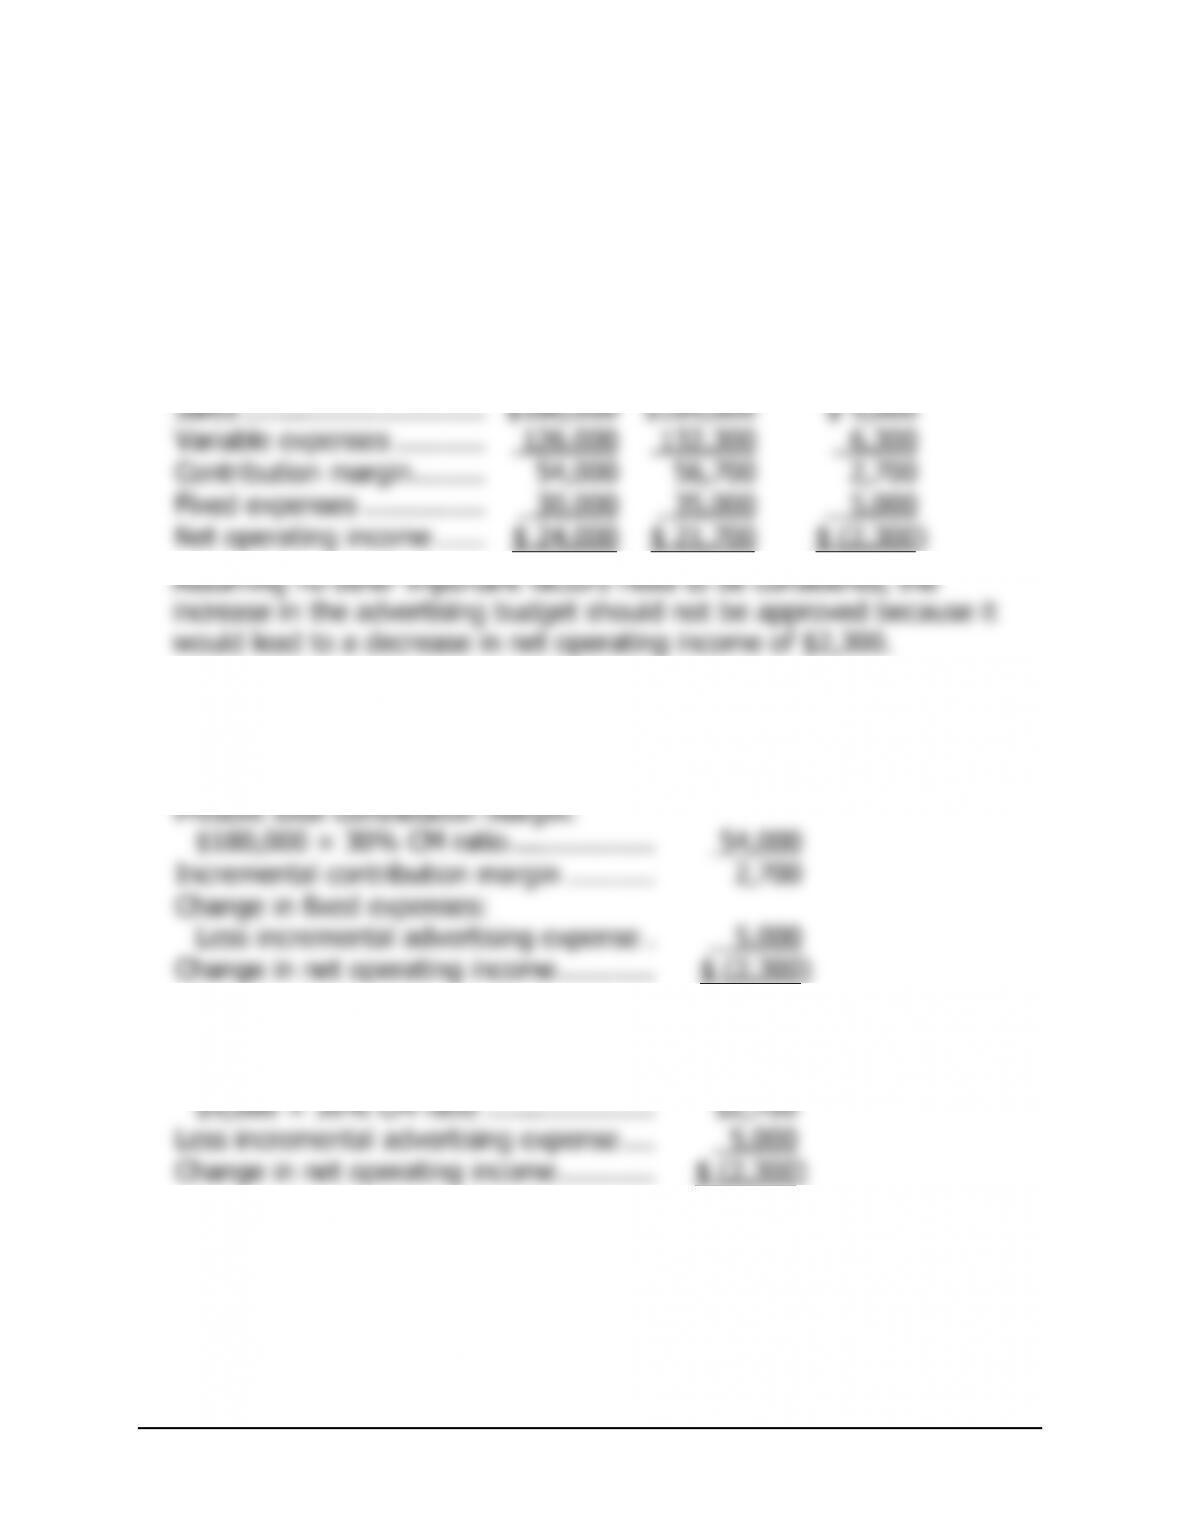
1. The following table shows the effect of the proposed change in monthly
advertising budget:
Sales With
Additional
Current
Advertising
Sales
Budget
Difference
Sales …………………………
$180,000
$189,000
$ 9,000
Variable expenses ………..
126,000
132,300
6,300
Contribution margin ………
54,000
56,700
2,700
Fixed expenses ……………
30,000
35,000
5,000
Net operating income ……
$ 24,000
$ 21,700
$ (2,300)
Alternative Solution 1
Expected total contribution margin:
$189,000 × 30% CM ratio ………………
$56,700
Present total contribution margin:
$180,000 × 30% CM ratio ………………
54,000
Incremental contribution margin ………..
2,700
Change in fixed expenses:
Less incremental advertising expense .
5,000
Change in net operating income …………
$ (2,300)
Alternative Solution 2
Incremental contribution margin:
$9,000 × 30% CM ratio …………………
$2,700
Less incremental advertising expense ….
5,000
Change in net operating income …………
$ (2,300)
14 Managerial Accounting for Managers, 4th Edition
Exercise 3-5 (continued)
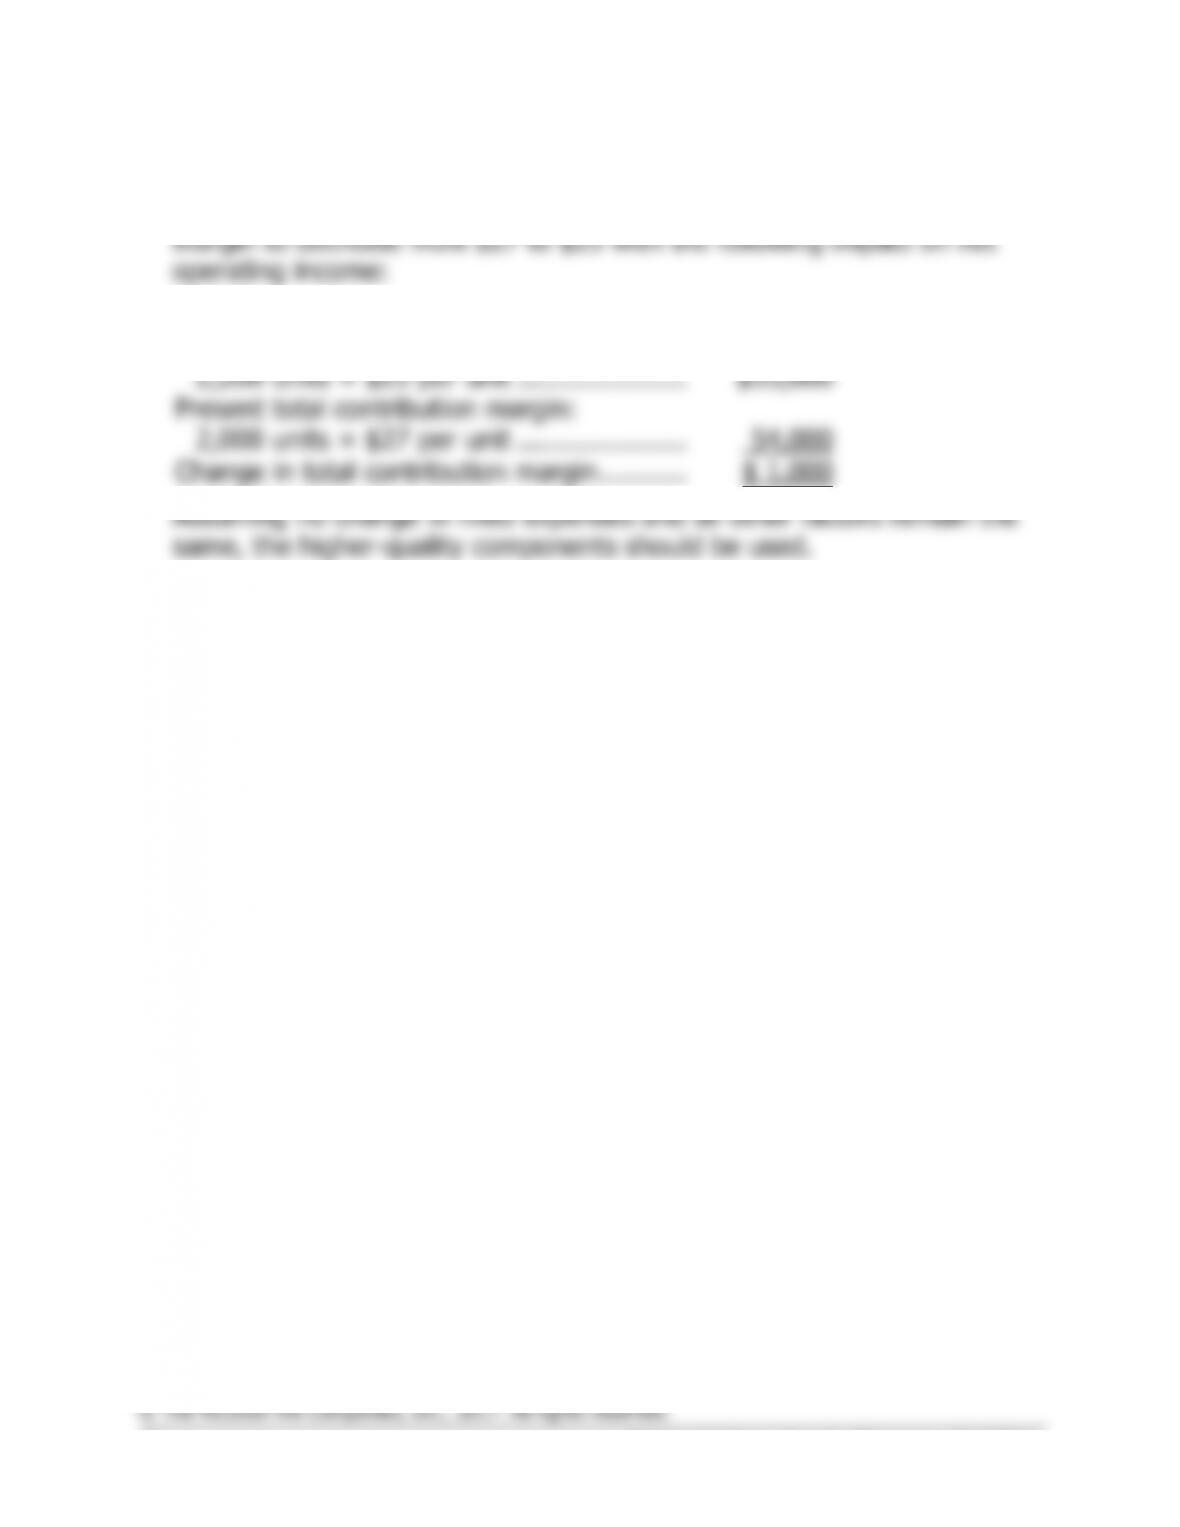
2. The $2 increase in variable expense will cause the unit contribution
Expected total contribution margin with the
higher-quality components:
2,200 units × $25 per unit …………………
$55,000
Present total contribution margin:
2,000 units × $27 per unit …………………
54,000
Change in total contribution margin ………..
$ 1,000
Exercise 3-6 (20 minutes)
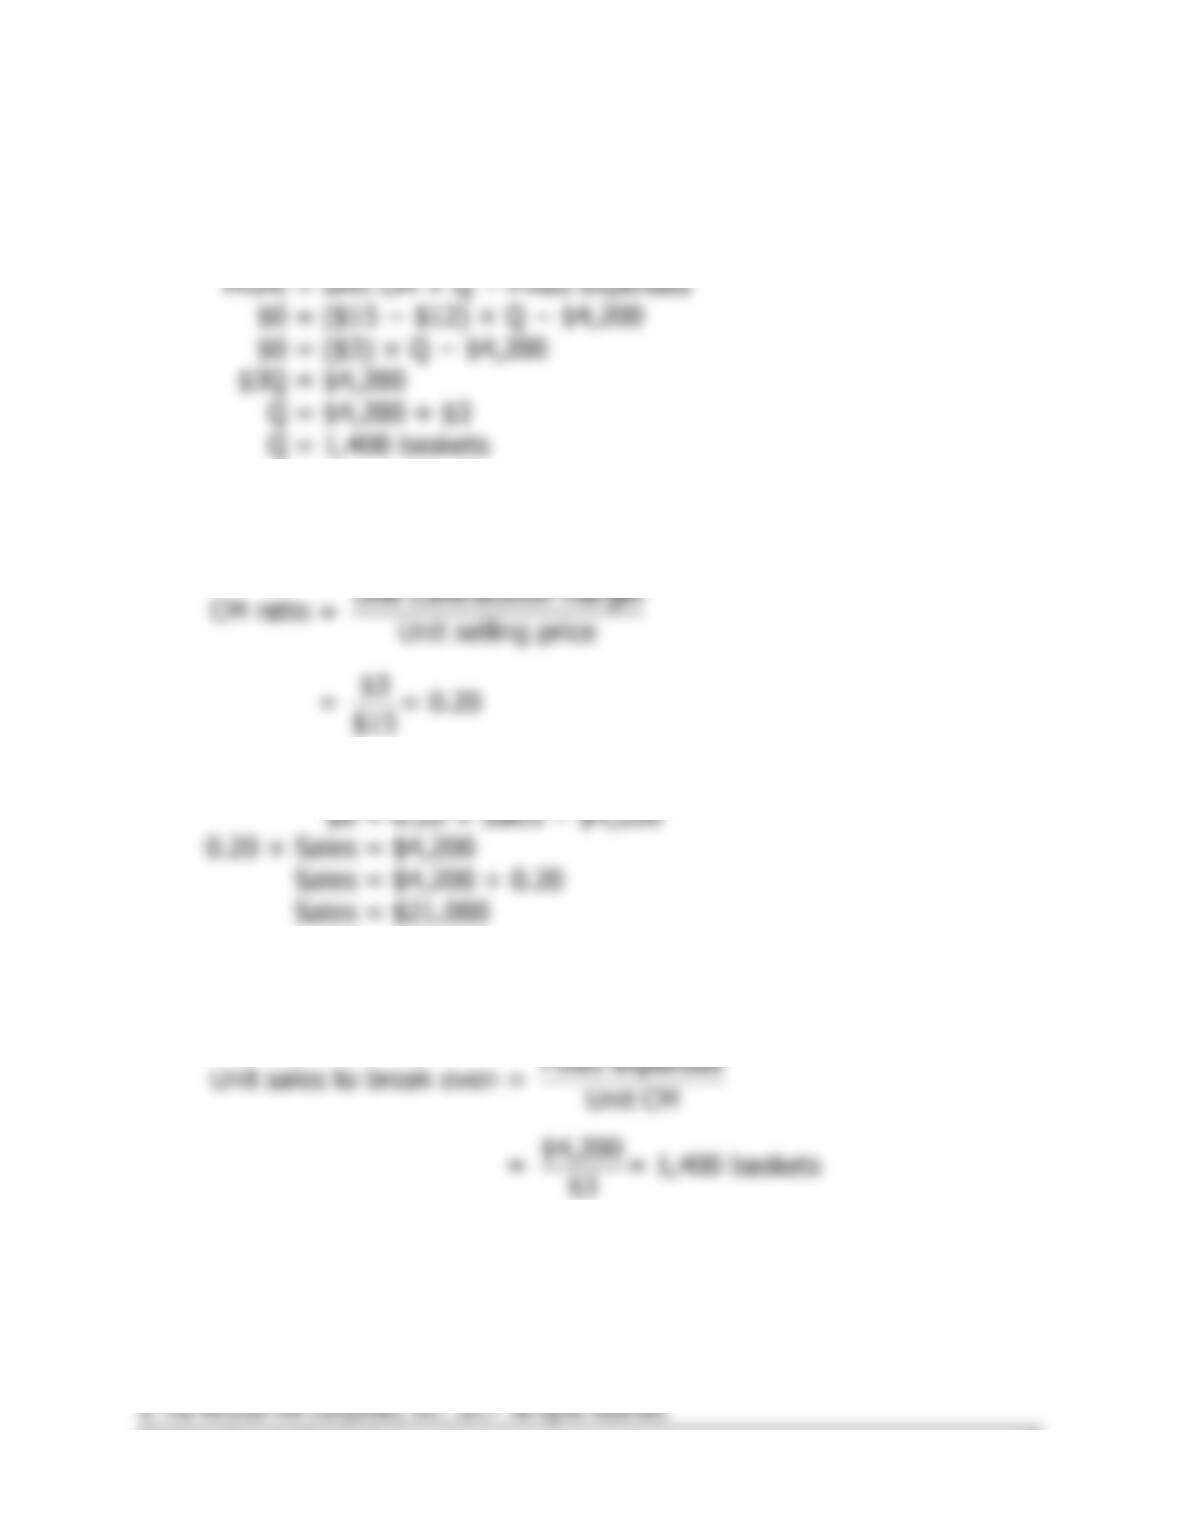
1. The equation method yields the break-even point in unit sales, Q, as
follows:
Profit
= Unit CM × Q − Fixed expenses
$0
= ($15 − $12) × Q − $4,200
$0
= ($3) × Q − $4,200
$3Q
= $4,200
Q
= $4,200 ÷ $3
Q
= 1,400 baskets
2. The equation method can be used to compute the break-even point in
dollar sales as follows:
Unit contribution margin
CM ratio = Unit selling price
$3
= = 0.20
$15
Profit
= CM ratio × Sales − Fixed expenses
$0
= 0.20 × Sales − $4,200
0.20 × Sales
= $4,200
Sales
= $4,200 ÷ 0.20
Sales
= $21,000
3. The formula method gives an answer that is identical to the equation
method for the break-even point in unit sales:
Fixed expenses
Unit sales to break even = Unit CM
$4,200
= = 1,400 baskets
$3
Exercise 3-6 (continued)
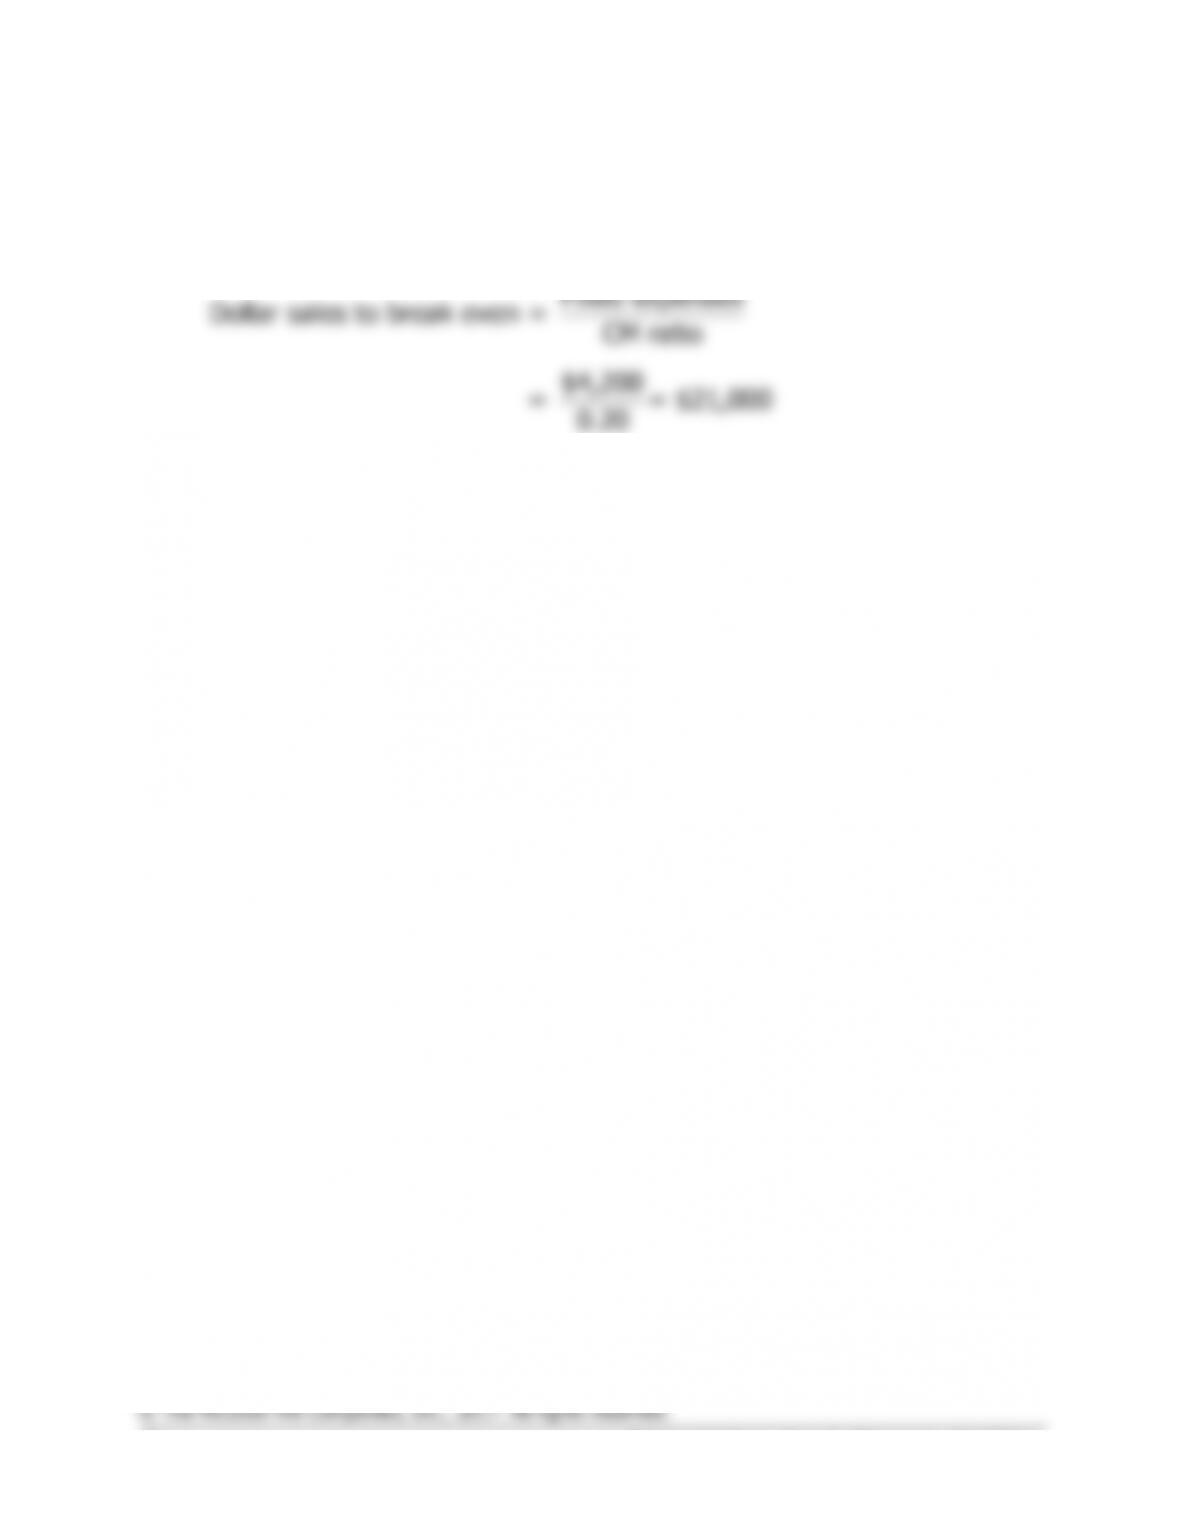
4. The formula method also gives an answer that is identical to the
equation method for the break-even point in dollar sales:
Fixed expenses
Dollar sales to break even = CM ratio
$4,200
= = $21,000
0.20
Exercise 3-7 (10 minutes)
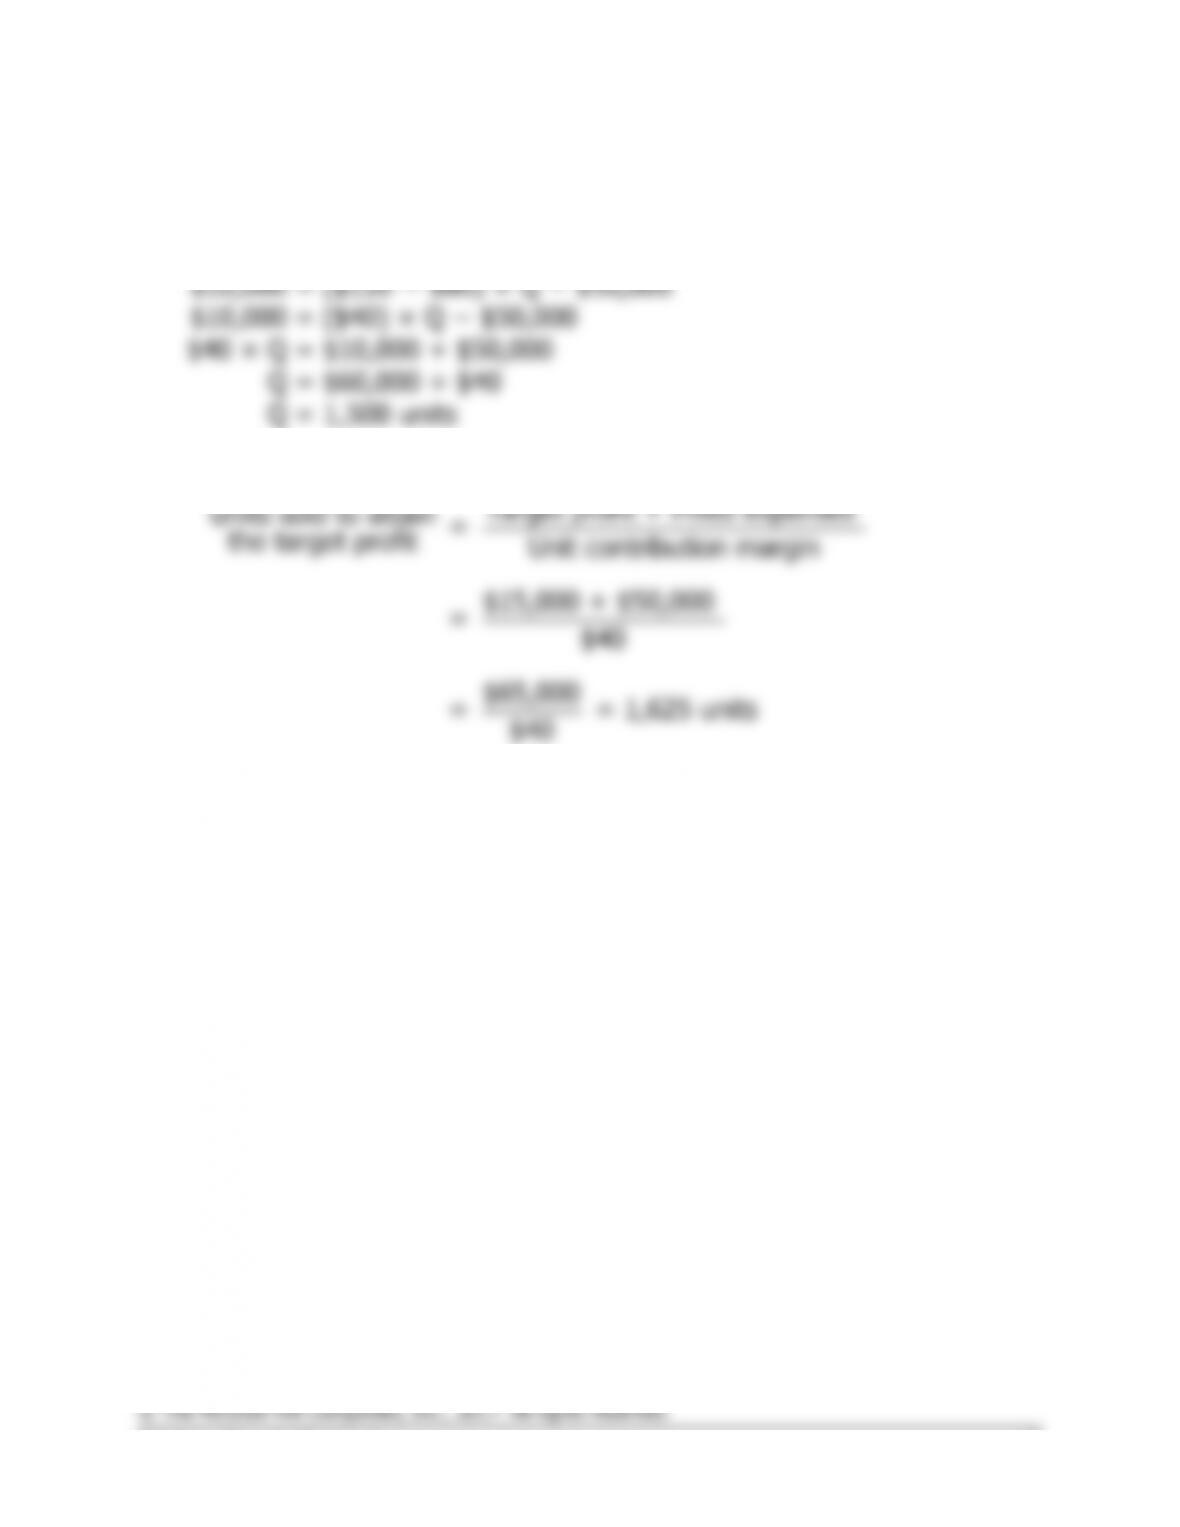
1. The equation method yields the required unit sales, Q, as follows:
Profit
= Unit CM × Q − Fixed expenses
$10,000
= ($120 − $80) × Q − $50,000
$10,000
= ($40) × Q − $50,000
$40 × Q
= $10,000 + $50,000
Q
= $60,000 ÷ $40
Q
= 1,500 units
2. The formula approach yields the required unit sales as follows:
Target profit + Fixed expenses
Units sold to attain =
the target profit Unit contribution margin
$15,000 + $50,000
= $40
$65,000
= = 1,625 units
$40
18 Managerial Accounting for Managers, 4th Edition
Exercise 3-8 (10 minutes)
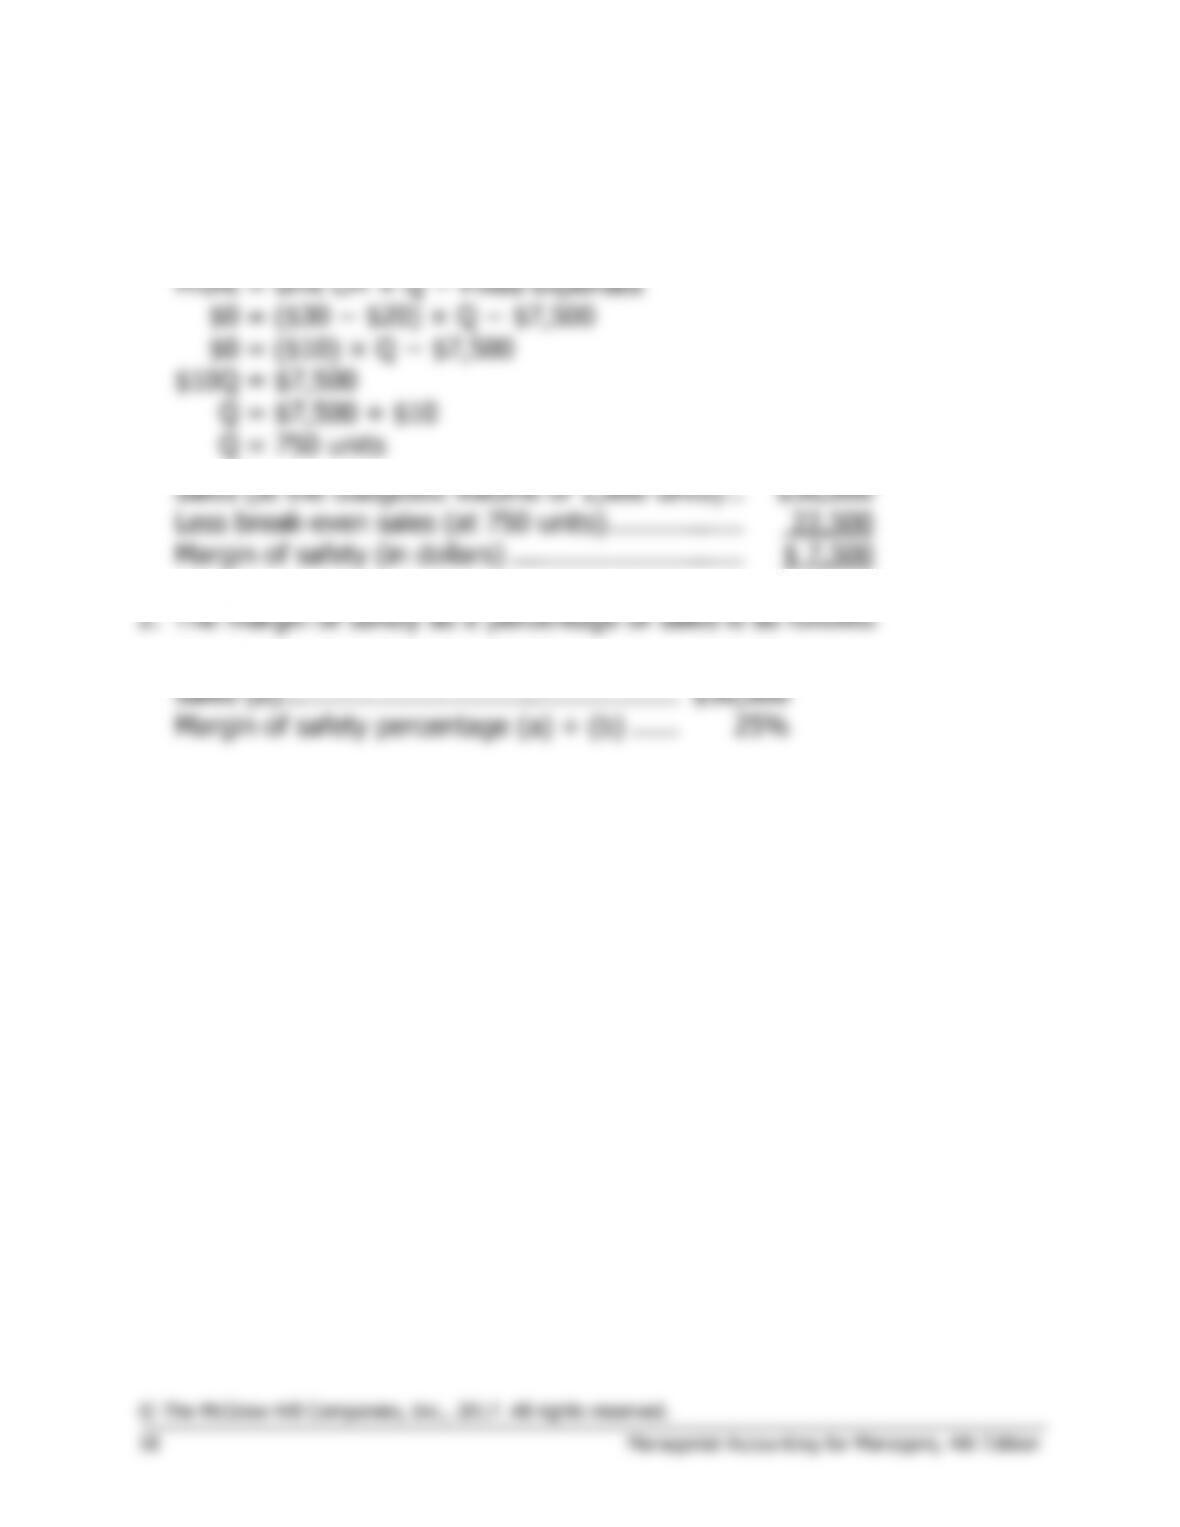
1. To compute the margin of safety, we must first compute the break-even
unit sales.
Profit
= Unit CM × Q − Fixed expenses
$0
= ($30 − $20) × Q − $7,500
$0
= ($10) × Q − $7,500
$10Q
= $7,500
Q
= $7,500 ÷ $10
Q
= 750 units
Sales (at the budgeted volume of 1,000 units) ..
$30,000
Less break-even sales (at 750 units) ……………..
22,500
Margin of safety (in dollars) ………………………..
$ 7,500
Margin of safety (in dollars) (a) …………….
$7,500
Sales (b) ………………………………………….
$30,000
Margin of safety percentage (a) ÷ (b) ……
25%
Solutions Manual, Chapter 3 19
Exercise 3-9 (20 minutes)
1. The company’s degree of operating leverage would be computed as
follows:
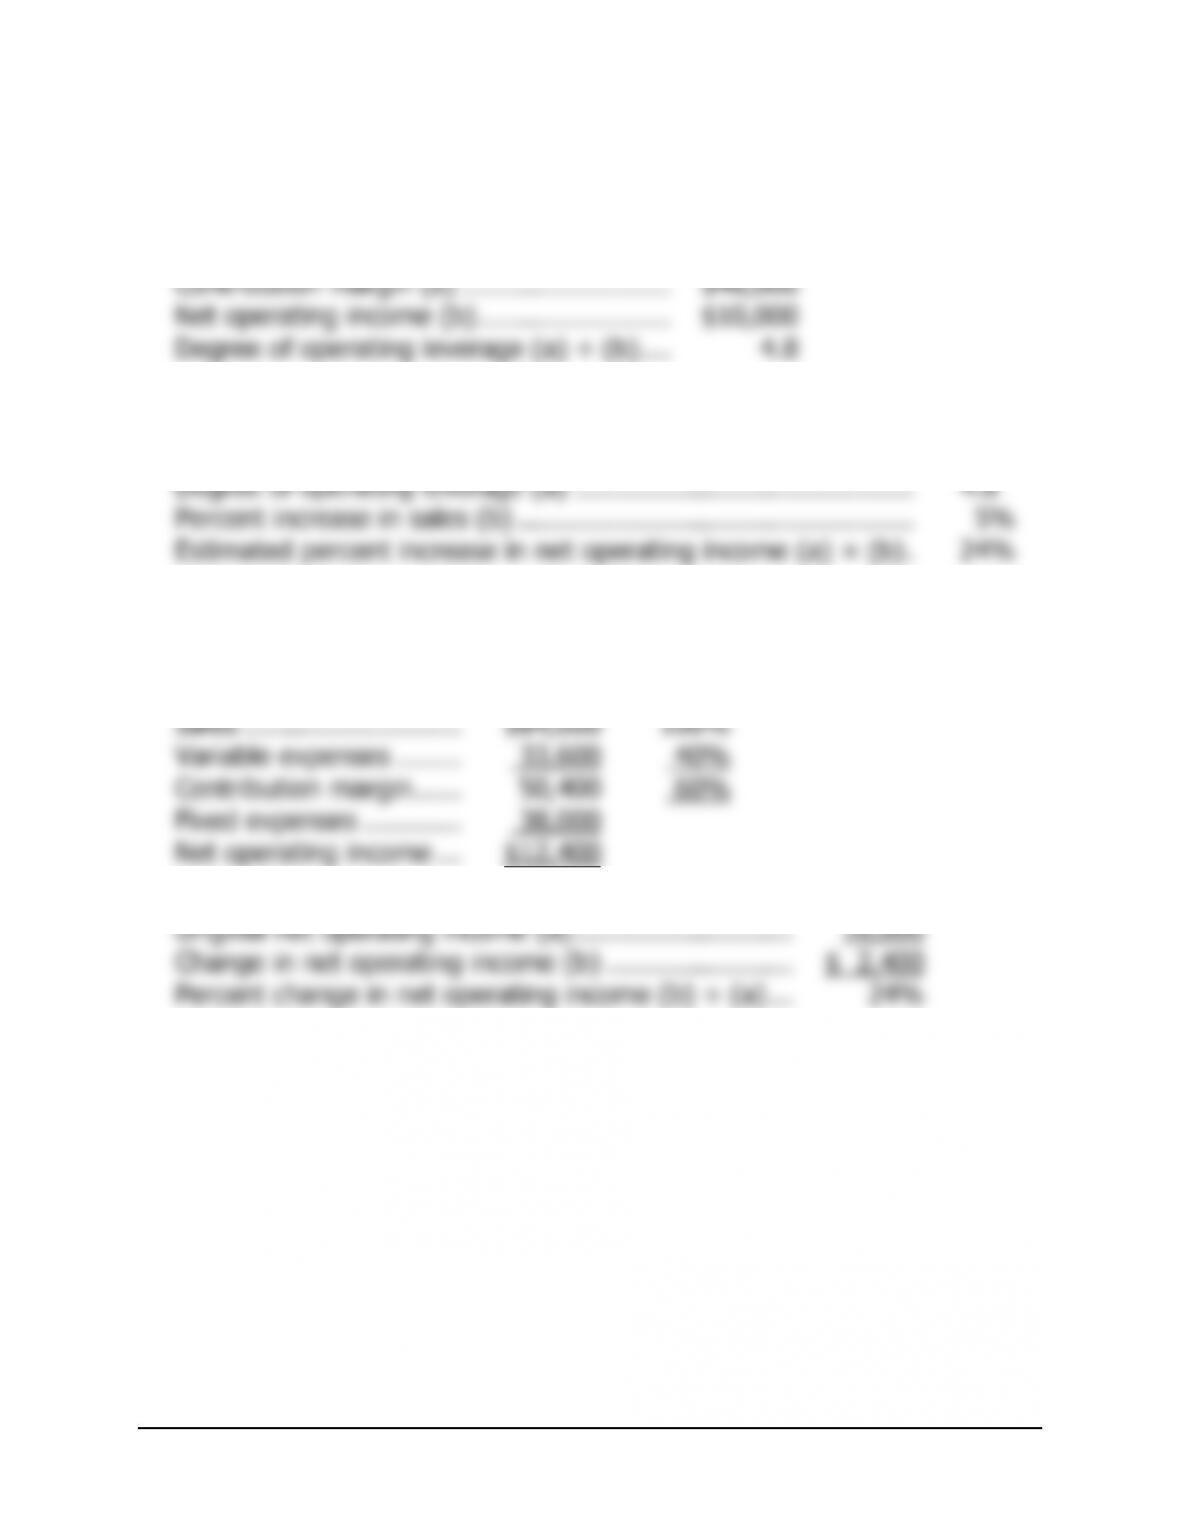
Contribution margin (a) ……………………..
$48,000
Net operating income (b) ……………………
$10,000
Degree of operating leverage (a) ÷ (b) ….
4.8
2. A 5% increase in sales should result in a 24% increase in net operating
income, computed as follows:
Degree of operating leverage (a) …………………………..……….
4.8
Percent increase in sales (b) ………………………………………….
5%
Estimated percent increase in net operating income (a) × (b) .
24%
3. The new income statement reflecting the change in sales is:
Amount
Percent
of Sales
Sales ………………………
$84,000
100%
Variable expenses ……..
33,600
40%
Contribution margin ……
50,400
60%
Fixed expenses …………
38,000
Net operating income …
$12,400
Net operating income reflecting change in sales ……
$12,400
Original net operating income (a) ………………………
10,000
Change in net operating income (b) …………………..
$ 2,400
Percent change in net operating income (b) ÷ (a) …
24%
Exercise 3-10 (20 minutes)
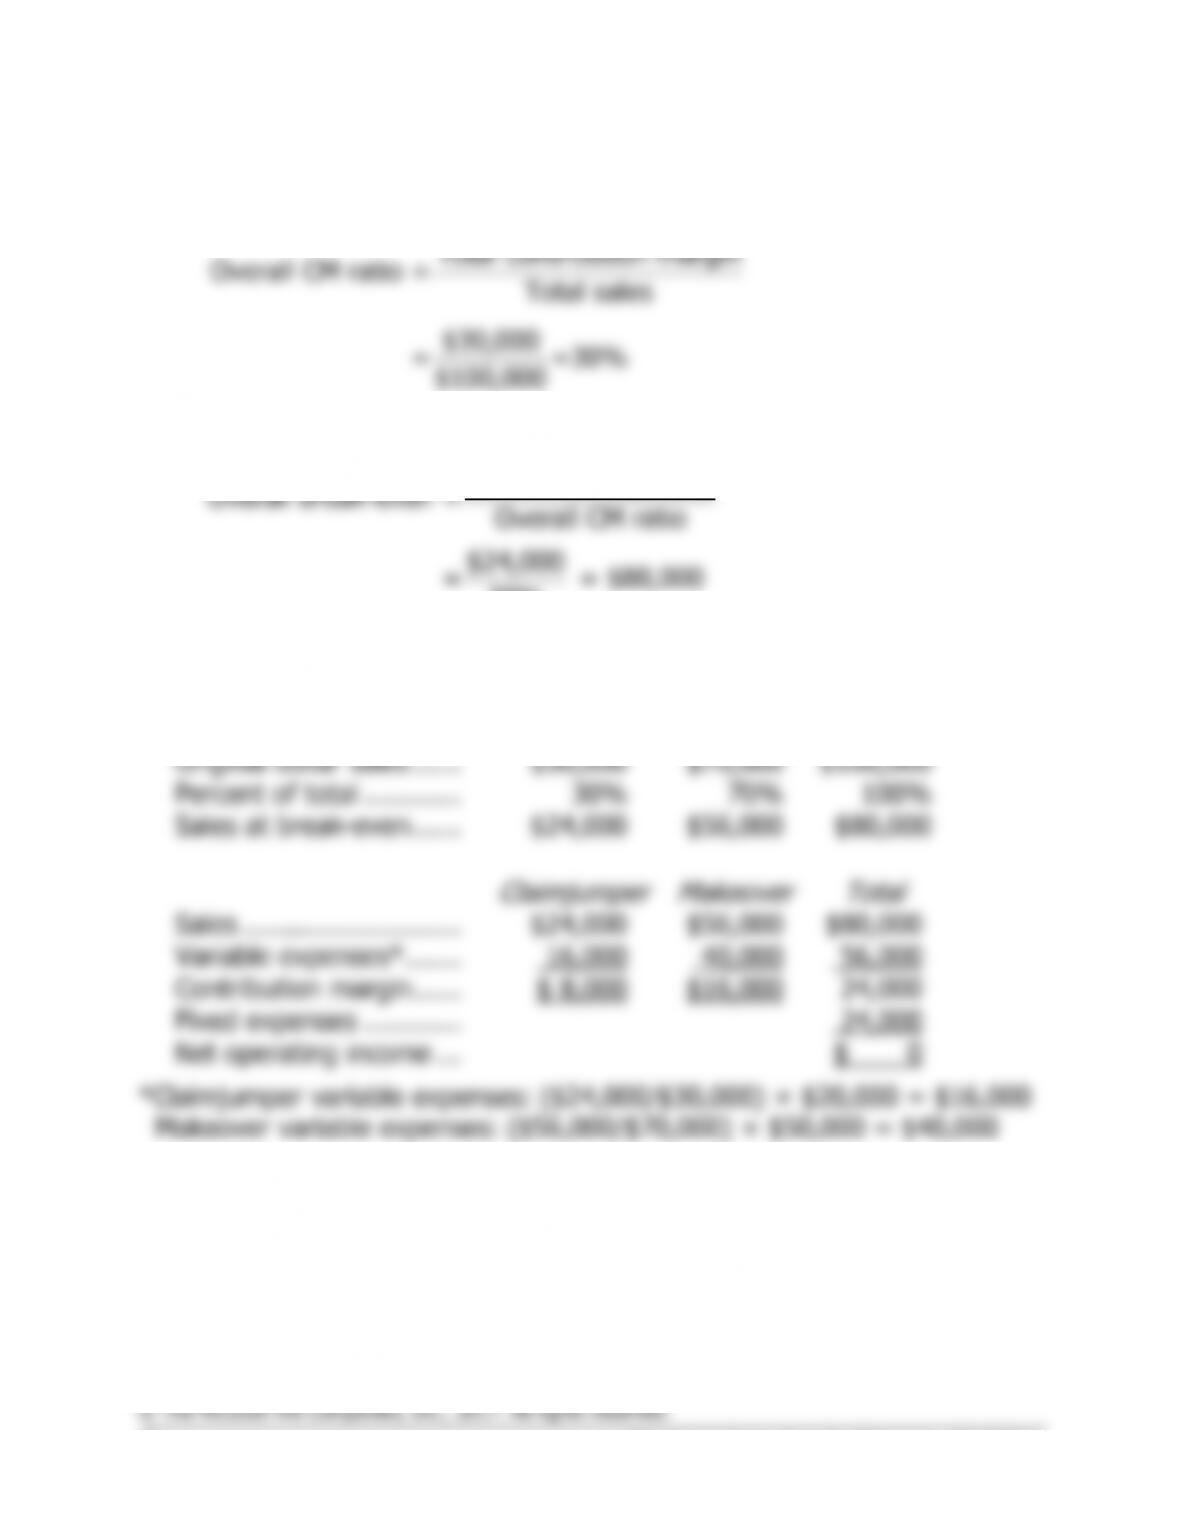
1. The overall contribution margin ratio can be computed as follows:
Total contribution margin
Overall CM ratio = Total sales
$30,000
= =30%
$100,000
2. The overall break-even point in dollar sales can be computed as follows:
Total fixed expenses
3. To construct the required income statement, we must first determine
the relative sales mix for the two products:
Claimjumper
Makeover
Total
Original dollar sales ……
$30,000
$70,000
$100,000
Percent of total …………
30%
70%
100%
Sales at break-even ……
$24,000
$56,000
$80,000
Claimjumper
Makeover
Total
Sales ………………………
$24,000
$56,000
$80,000
Variable expenses* …….
16,000
40,000
56,000
Contribution margin ……
$ 8,000
$16,000
24,000
Fixed expenses …………
24,000
Net operating income …
$ 0
*Claimjumper variable expenses: ($24,000/$30,000) × $20,000 = $16,000
Makeover variable expenses: ($56,000/$70,000) × $50,000 = $40,000