Unlock document.
This document is partially blurred.
Unlock all pages and 1 million more documents.
Get Access

50 Managerial Accounting for Managers, 4th Edition
Exercise 2A-2 (20 minutes)
1. and 2.
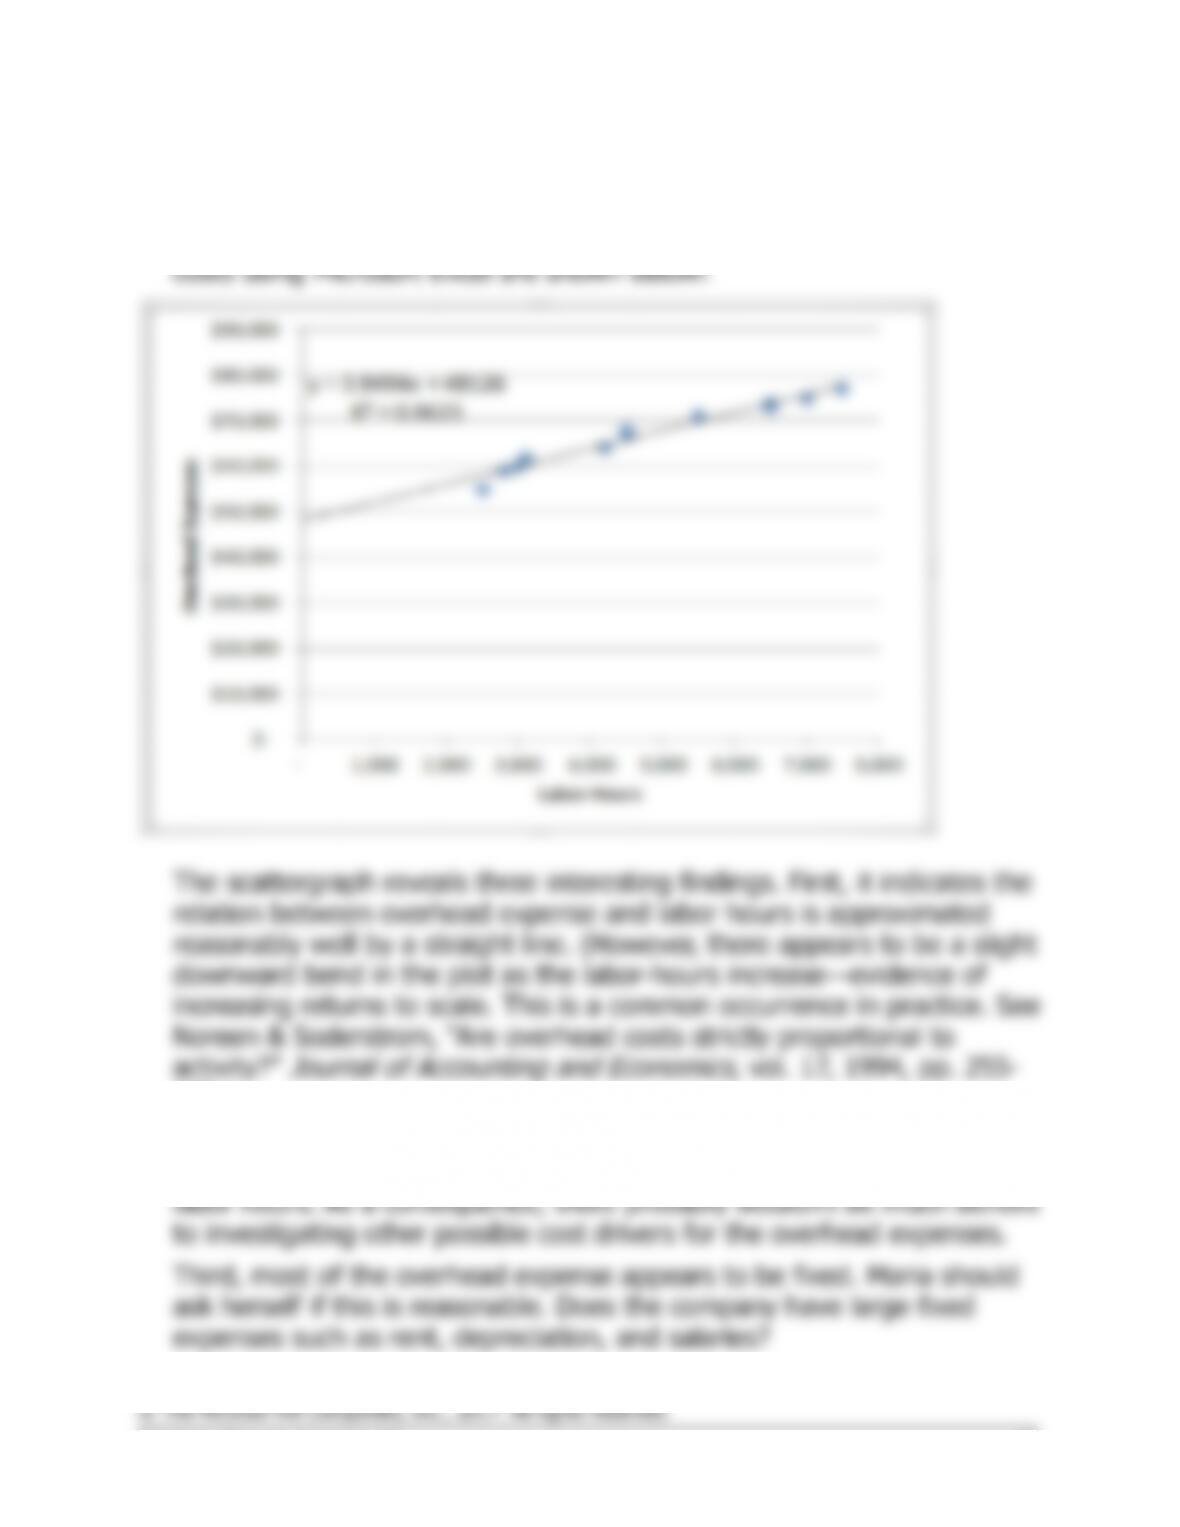
The scattergraph plot and regression estimates of fixed and variable
3. Total expected etching cost if 5 units are processed:
Variable cost: 5 units × $1.54 per unit .....
$ 7.70
Fixed cost ..............................................
12.32
Total expected cost .................................
$20.02
Solutions Manual, Appendix 2A 51
Problem 2A-3 (30 minutes)
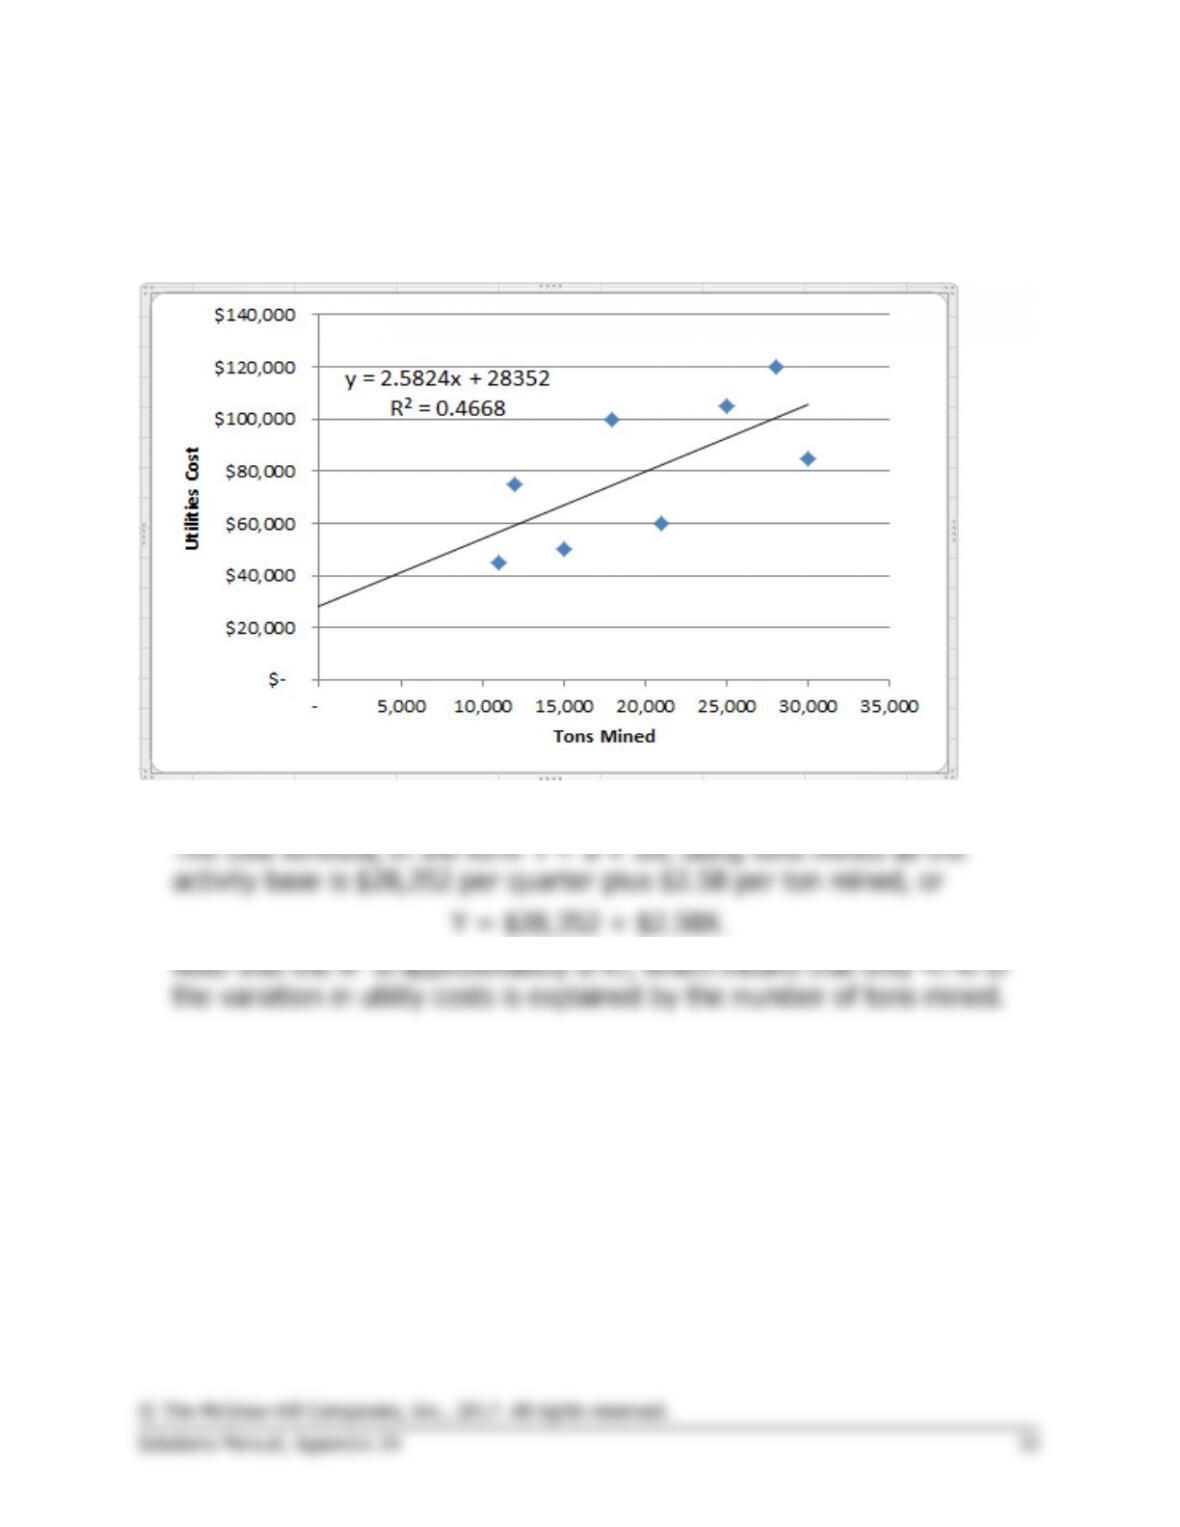
1. The scattergraph plot and regression estimates of fixed and variable
costs using Microsoft Excel are shown below:
52 Managerial Accounting for Managers, 4th Edition
Problem 2A-3 (continued)
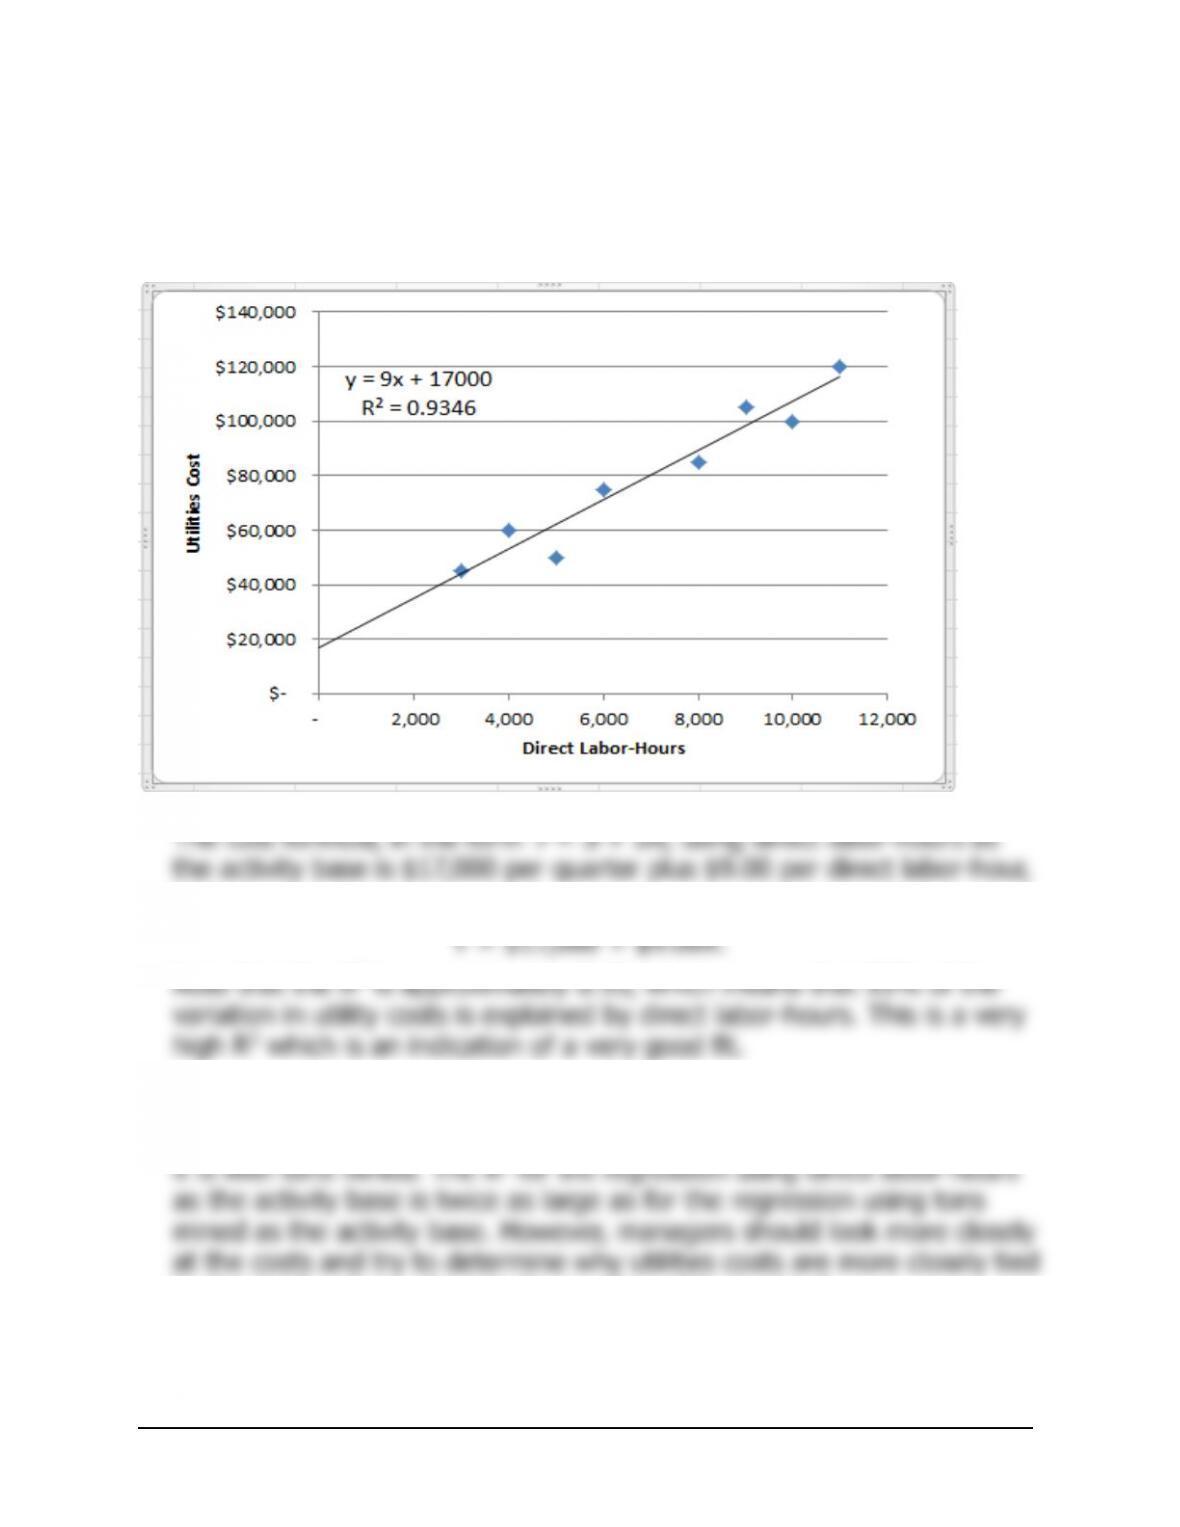
2. The scattergraph plot and regression estimates of fixed and variable
costs using Microsoft Excel are shown below:
or:
3. The company should probably use direct labor-hours as the activity
base, since the fit of the regression line to the data is much tighter than
to direct labor-hours than to the number of tons mined.
Solutions Manual, Appendix 2A 53
Problem 2A-4 (30 minutes)
1. and 2.
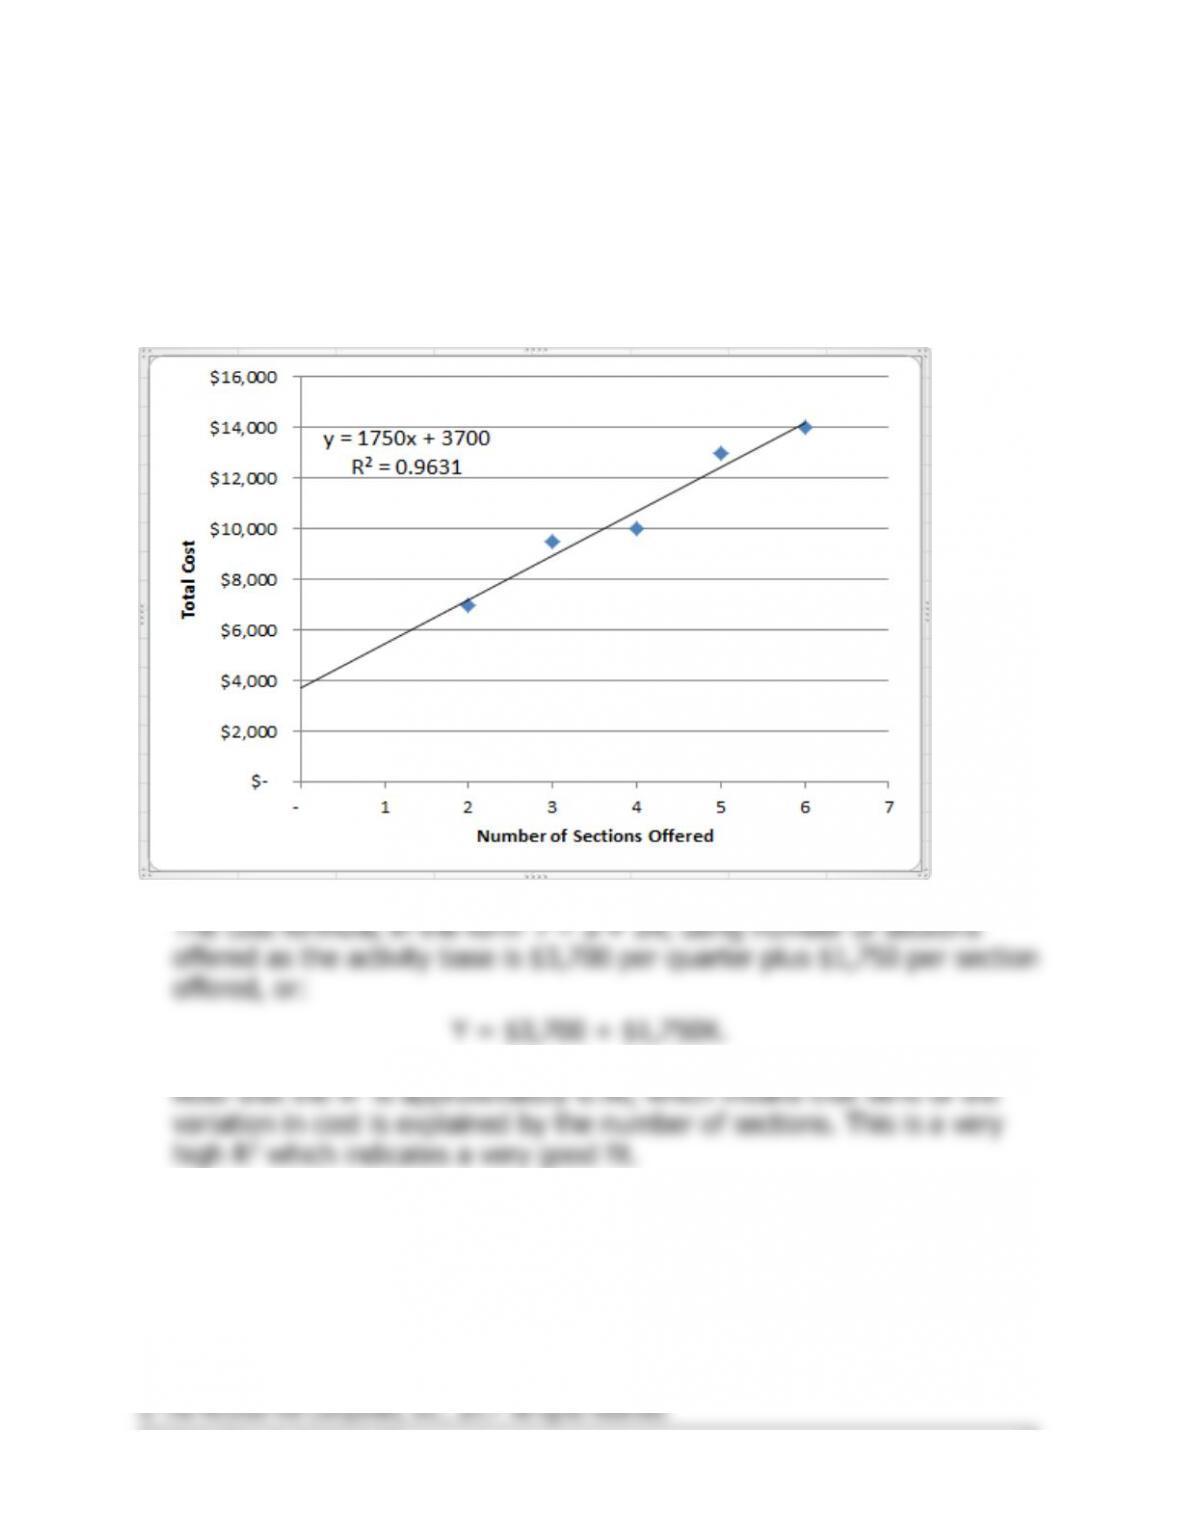
The scattergraph plot and regression estimates of fixed and variable costs
using Microsoft Excel are shown below:
54 Managerial Accounting for Managers, 4th Edition
Problem 2A-4 (continued)
3. Expected total cost would be:
Fixed cost .......................................................
$ 3,700
Variable cost (8 sections × $1,750 per section) .
14,000
Total cost ........................................................
$17,700
offered. These approximations appear to be reasonably accurate within
Solutions Manual, Appendix 2A 55
CASE 2A-5 (45 minutes)
1. and 2.
The scattergraph plot and regression estimates of fixed and variable
278.)
Second, the data points are all fairly close to the straight line. This
indicates that most of the variation in overhead expenses is explained by
56 Managerial Accounting for Managers, 4th Edition
CASE 2A-5 (continued)
The cost formula, in the form
Y
=
a
+
bX
, using labor-hours as the
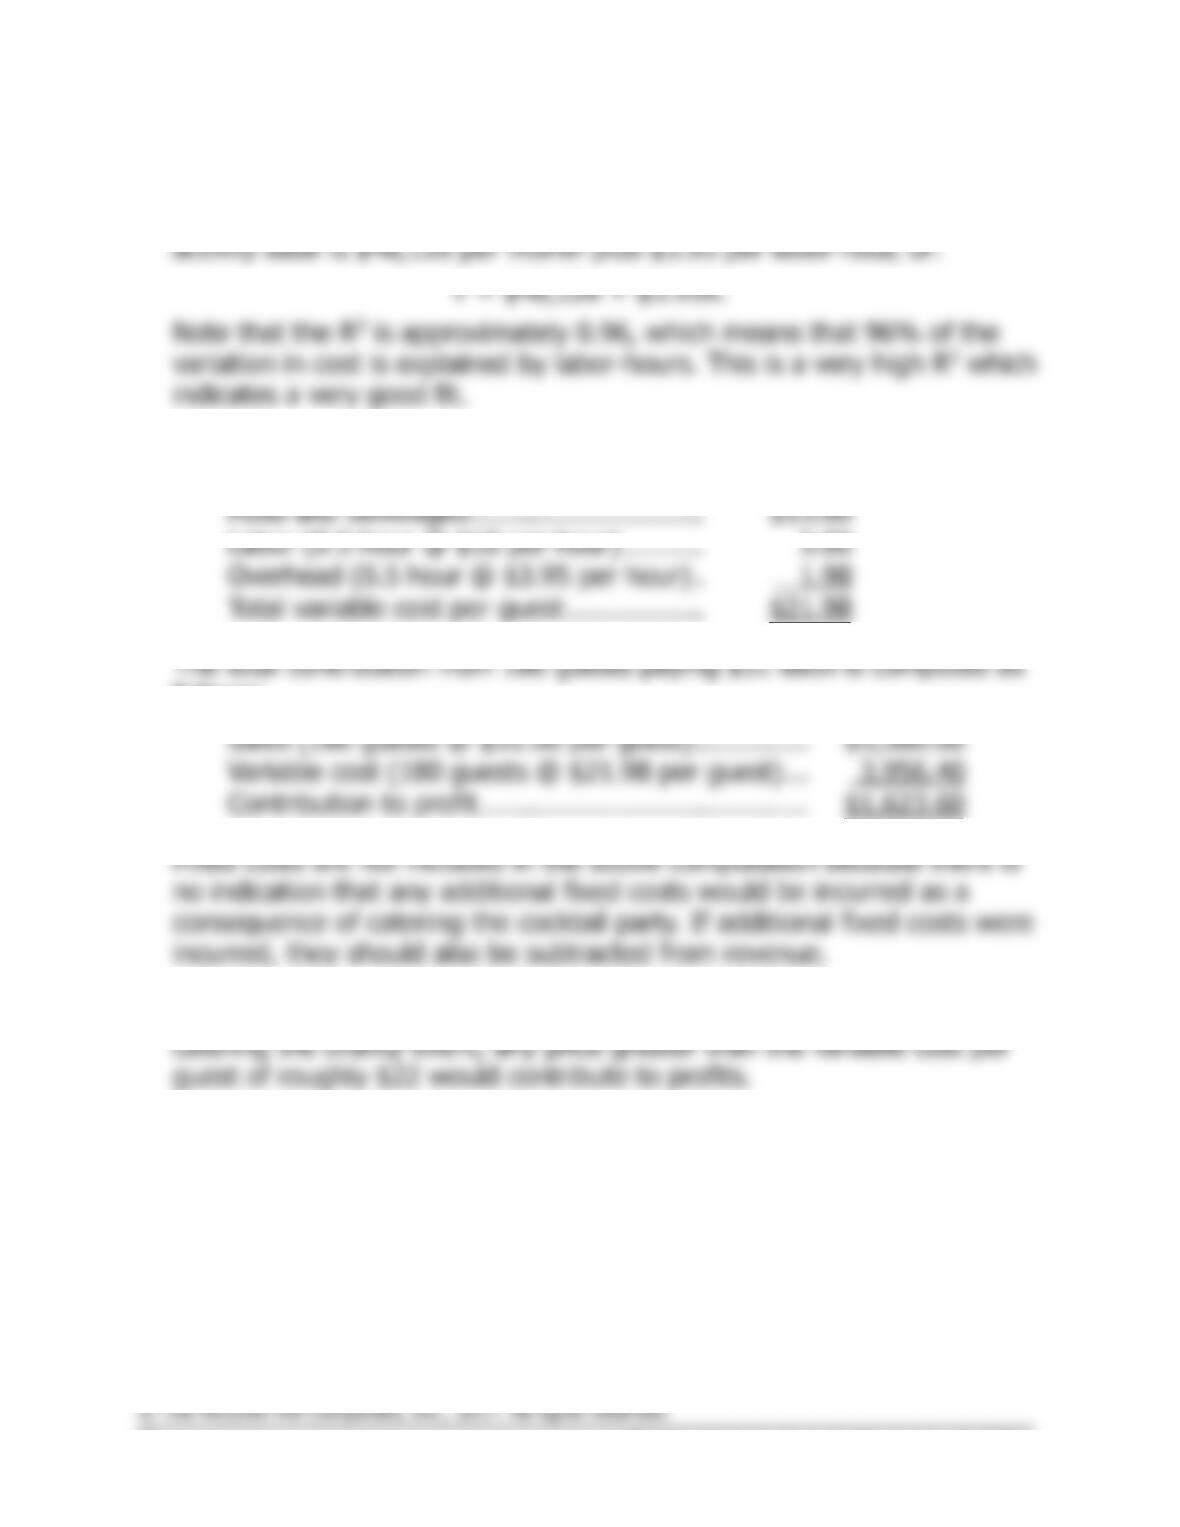
3. Using the least-squares regression estimate of the variable overhead
cost, the total variable cost per guest is computed as follows:
Food and beverages .............................
$15.00
Labor (0.5 hour @ $10 per hour) ..........
5.00
Overhead (0.5 hour @ $3.95 per hour) .
1.98
Total variable cost per guest .................
$21.98
follows:
Sales (180 guests @ $31.00 per guest) ..............
$5,580.00
Variable cost (180 guests @ $21.98 per guest) ...
3,956.40
Contribution to profit.........................................
$1,623.60
4. Assuming that no additional fixed costs are incurred as a result of
Solutions Manual, Appendix 2A 57
CASE 2A-5 (continued)
initiate a price war among caterers. However, the price need not be


