Problem 12-16 (continued)
3. Students’ answers may differ in some details from this solution.
Sales
Contribution
margin per ton
Financial
Time to fill
an order
Customer satisfaction with
breadth of product offerings
Number of new
customers acquired
Customer
Average change-
over time
Number of different
paper grades produced
Average
manufacturing
Internal
Business
Processes
Number of employees
trained to support the
flexibility strategy
Learning
and Growth
+
–
+
+
–
+
+
+
+
32 Managerial Accounting for Managers, 4th Edition
Problem 12-16 (continued)
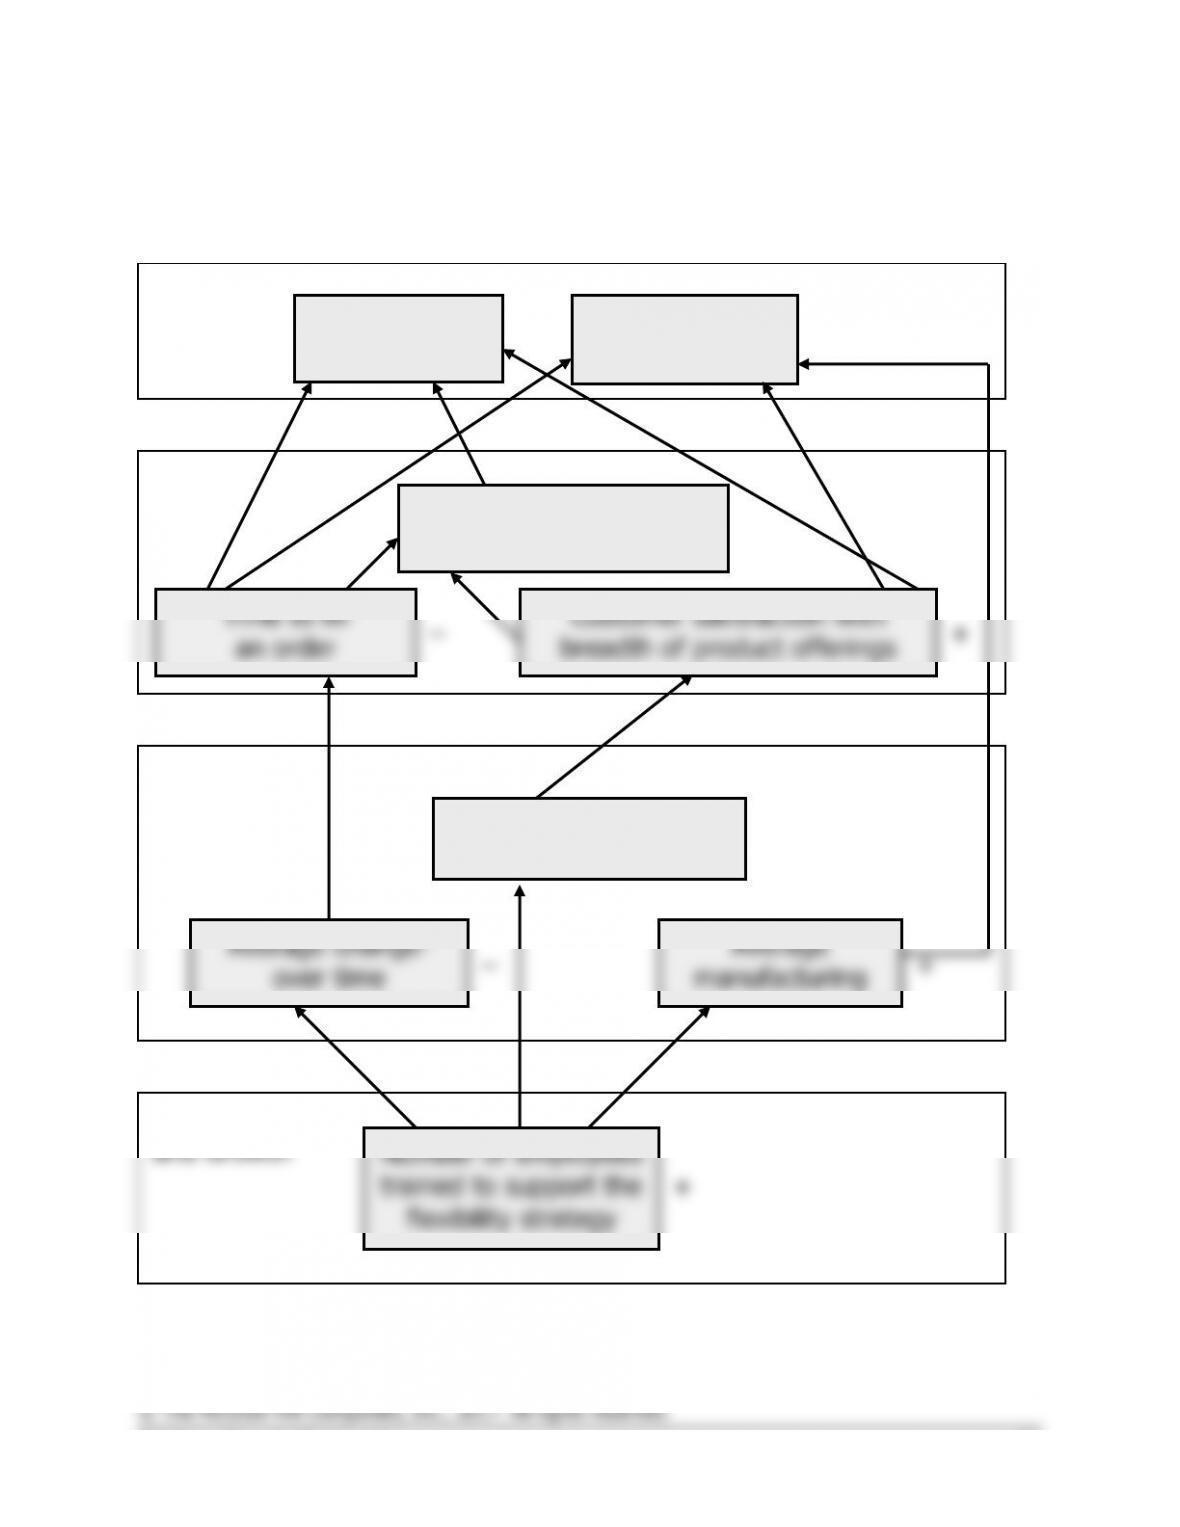
4. The hypotheses underlying the balanced scorecard are indicated by the
arrows in the diagram. Reading from the bottom of the balanced
scorecard, the hypotheses are:
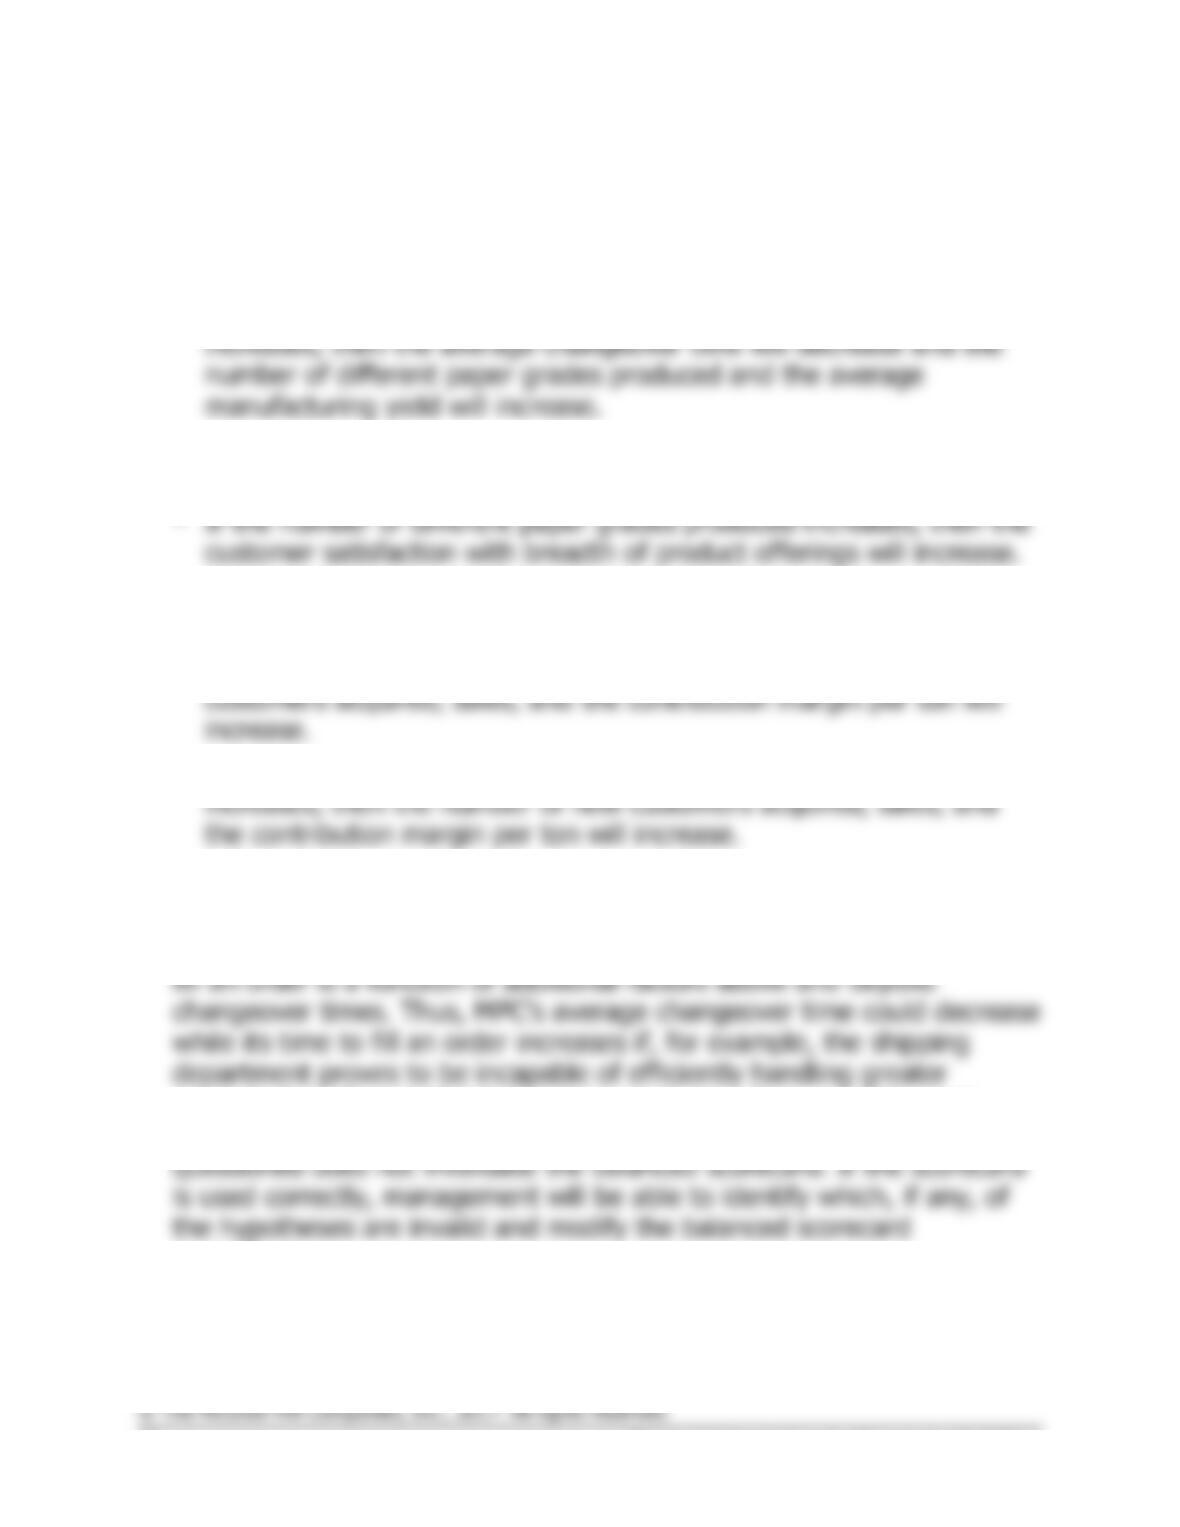
° If the number of employees trained to support the flexibility strategy
° If the average changeover time decreases, then the time to fill an
order will decrease.
° If the average manufacturing yield increases, then the contribution
margin per ton will increase.
° If the time to fill an order decreases, then the number of new
° If the customer satisfaction with breadth of product offerings
° If the number of new customers acquired increases, then sales will
increase.
Each of these hypotheses can be questioned. For example, the time to
product diversity, smaller batch sizes, and more frequent shipments.
The fact that each of the hypotheses mentioned above can be
accordingly.
Solutions Manual, Chapter 12 33
Problem 12-17 (30 minutes)
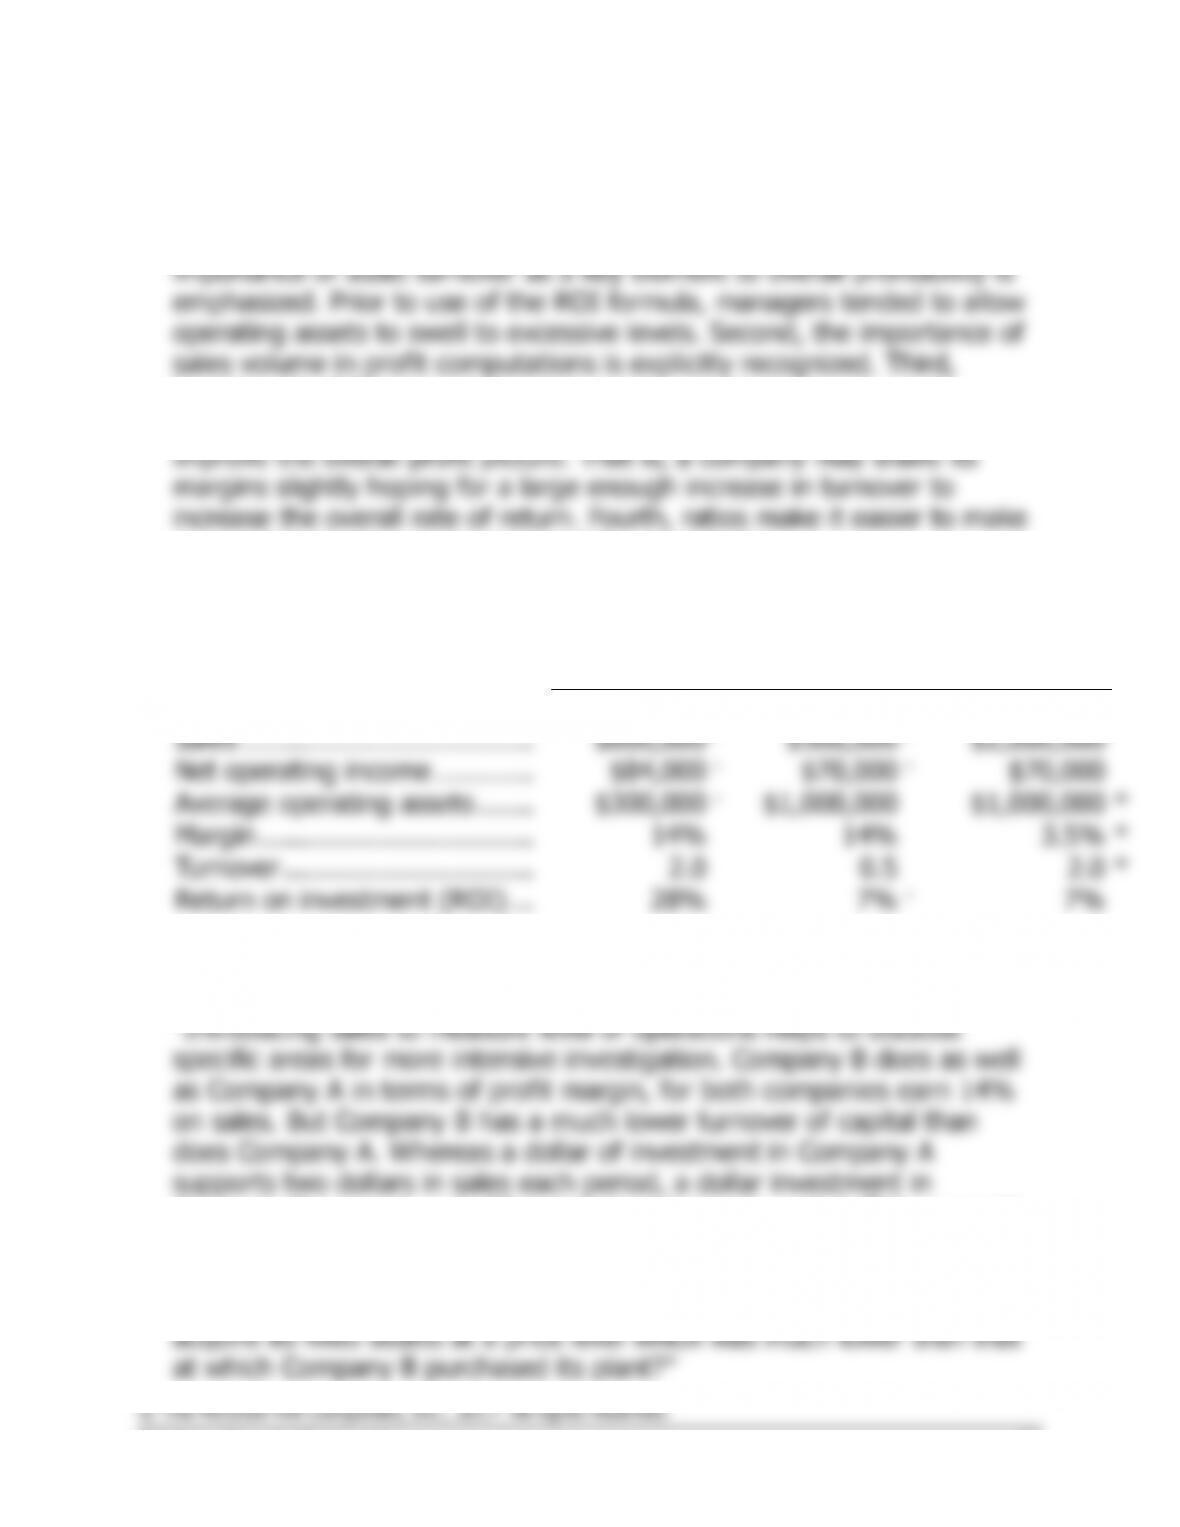
1. Breaking the ROI computation into two separate elements reveals
important relationships that otherwise might remain hidden. First, the
breaking the ROI computation into margin and turnover elements
stresses the possibility of trading one off for the other in attempts to
comparisons between segments of the organization.
2. The missing information is as follows:
Companies in the Same Industry
A
B
C
Sales ………………………………
$600,000
*
$500,000
*
$2,000,000
Net operating income …………
$84,000
*
$70,000
*
$70,000
Average operating assets …….
$300,000
*
$1,000,000
$1,000,000
*
Margin …………………………….
14%
14%
3.5%
*
Turnover ………………………….
2.0
0.5
2.0
*
Return on investment (ROI) …
28%
7%
*
7%
*Given.
NAA Report No. 35
states (p. 35):
Company B supports only fifty cents in sales each period. This suggests
that the analyst should look carefully at Company B’s investment. Is the
company keeping an inventory larger than necessary for its sales
volume? Are receivables being collected promptly? Or did Company A
34 Managerial Accounting for Managers, 4th Edition
Problem 12-17 (continued)
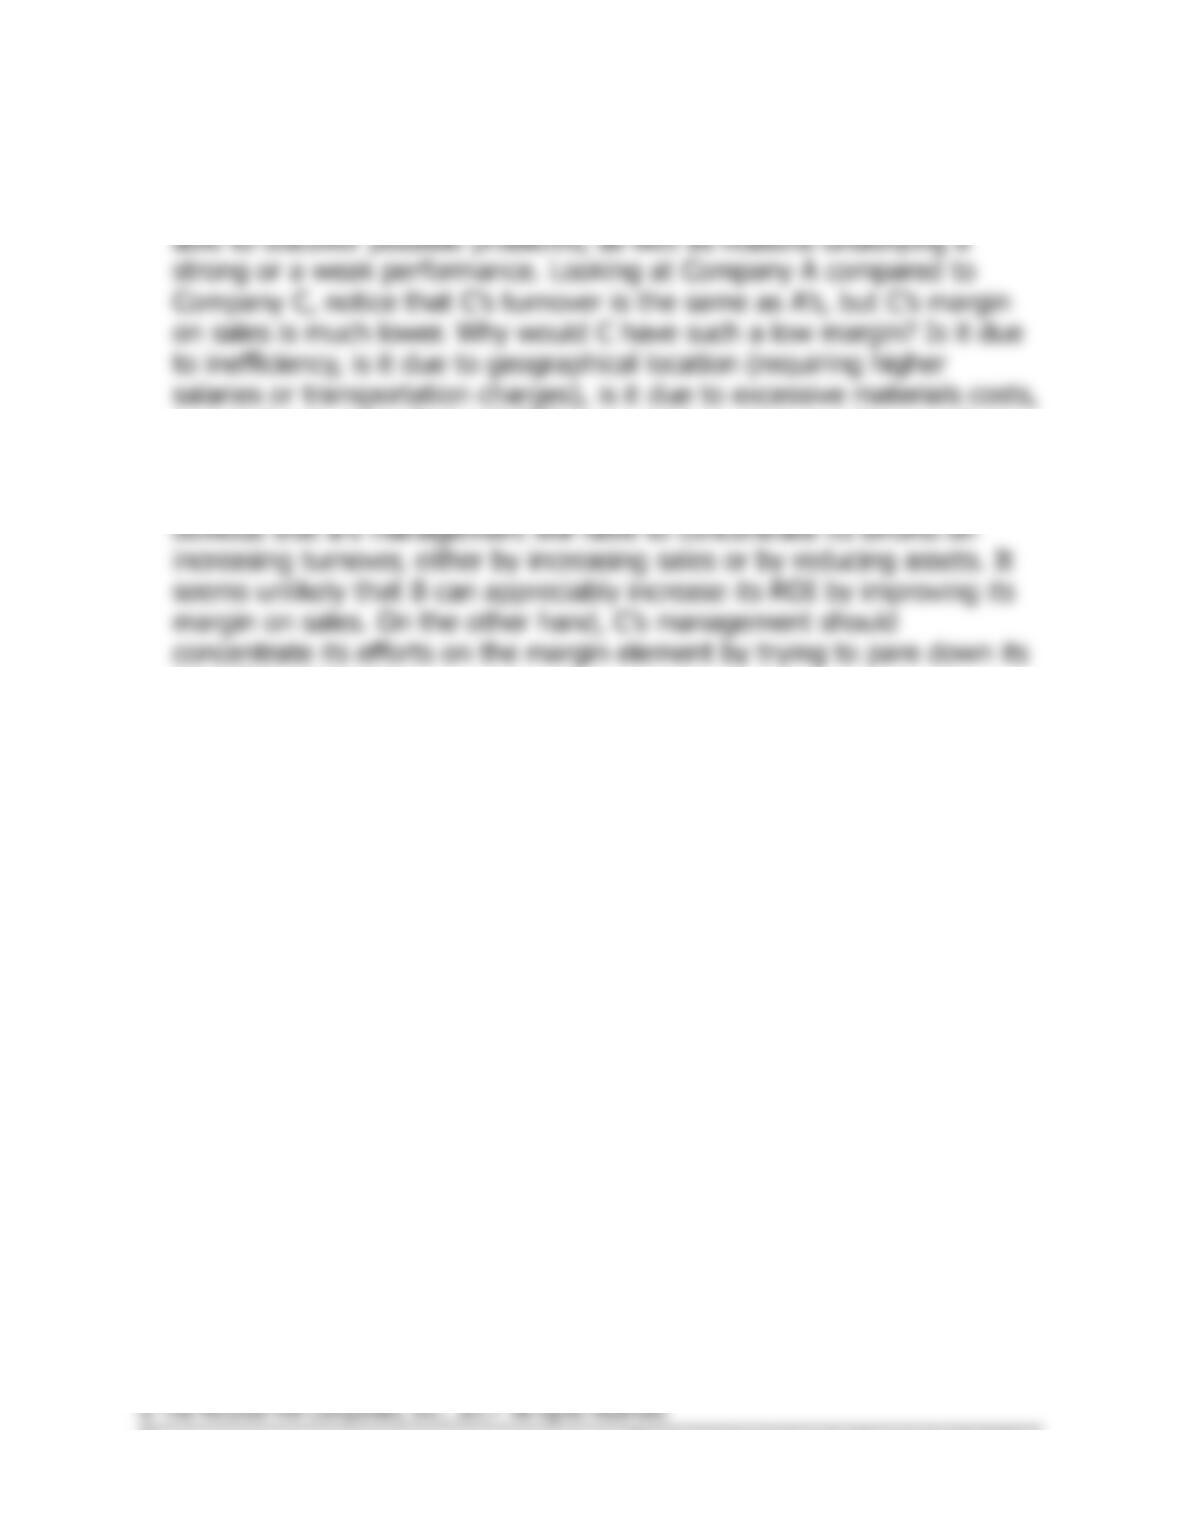
Thus, by including sales specifically in ROI computations the manager is
or is it due to other factors? ROI computations raise questions such as
these, which form the basis for managerial action.
To summarize, in order to bring B’s ROI into line with A’s, it seems
operating expenses.
Solutions Manual, Chapter 12 35
Problem 12-18 (30 minutes)
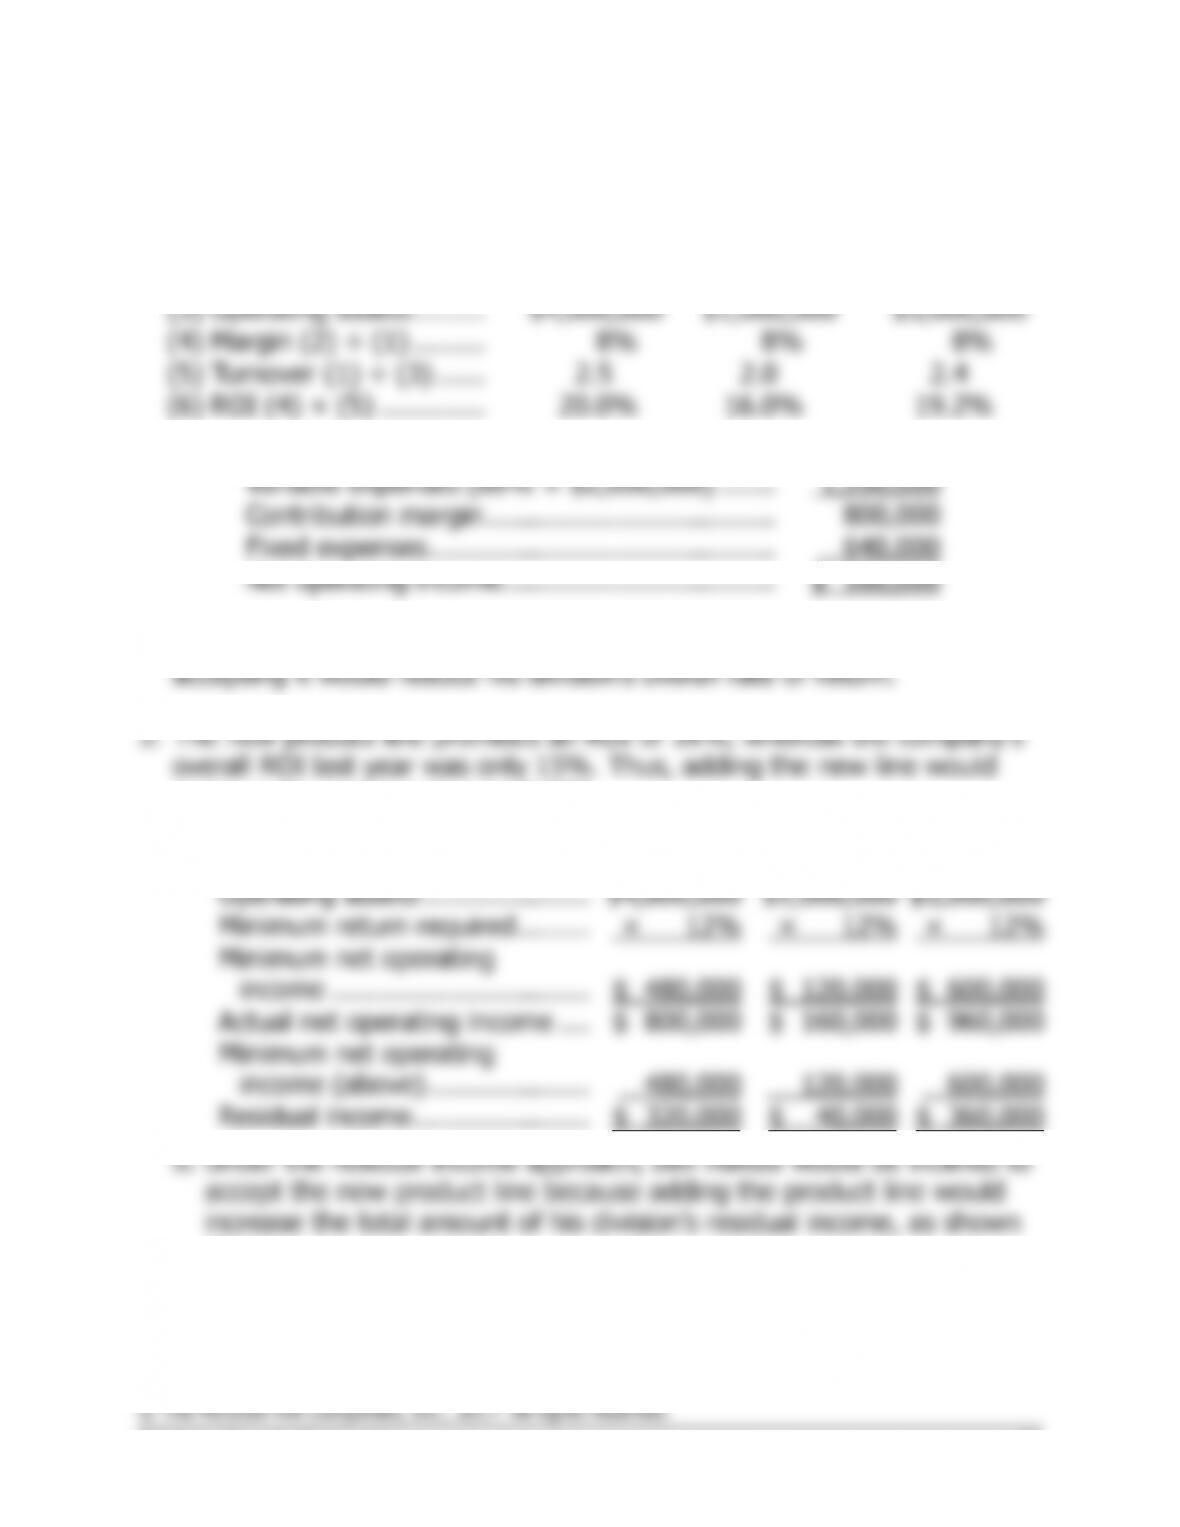
1.
Present
New Line
Total
(1)
Sales ……………………..
$10,000,000
$2,000,000
$12,000,000
(2)
Net operating income ..
$800,000
$160,000
*
$960,000
(3)
Operating assets ………
$4,000,000
$1,000,000
$5,000,000
(4)
Margin (2) ÷ (1) ………
8%
8%
8%
(5)
Turnover (1) ÷ (3) ……
2.5
2.0
2.4
(6)
ROI (4) × (5) ………….
20.0%
16.0%
19.2%
*
Sales …………………………………………………
$2,000,000
Variable expenses (60% × $2,000,000) …….
1,200,000
Contribution margin ………………………………
800,000
Fixed expenses …………………………………….
640,000
Net operating income…………………………….
$ 160,000
2. Dell Havasi will be inclined to reject the new product line because
increase the company’s overall ROI.
4.
a.
Present
New Line
Total
Operating assets …………………
$4,000,000
$1,000,000
$5,000,000
Minimum return required ………
× 12%
× 12%
× 12%
Minimum net operating
income …………………………..
$ 480,000
$ 120,000
$ 600,000
Actual net operating income ….
$ 800,000
$ 160,000
$ 960,000
Minimum net operating
income (above) ………………..
480,000
120,000
600,000
Residual income ………………….
$ 320,000
$ 40,000
$ 360,000
above.
36 Managerial Accounting for Managers, 4th Edition
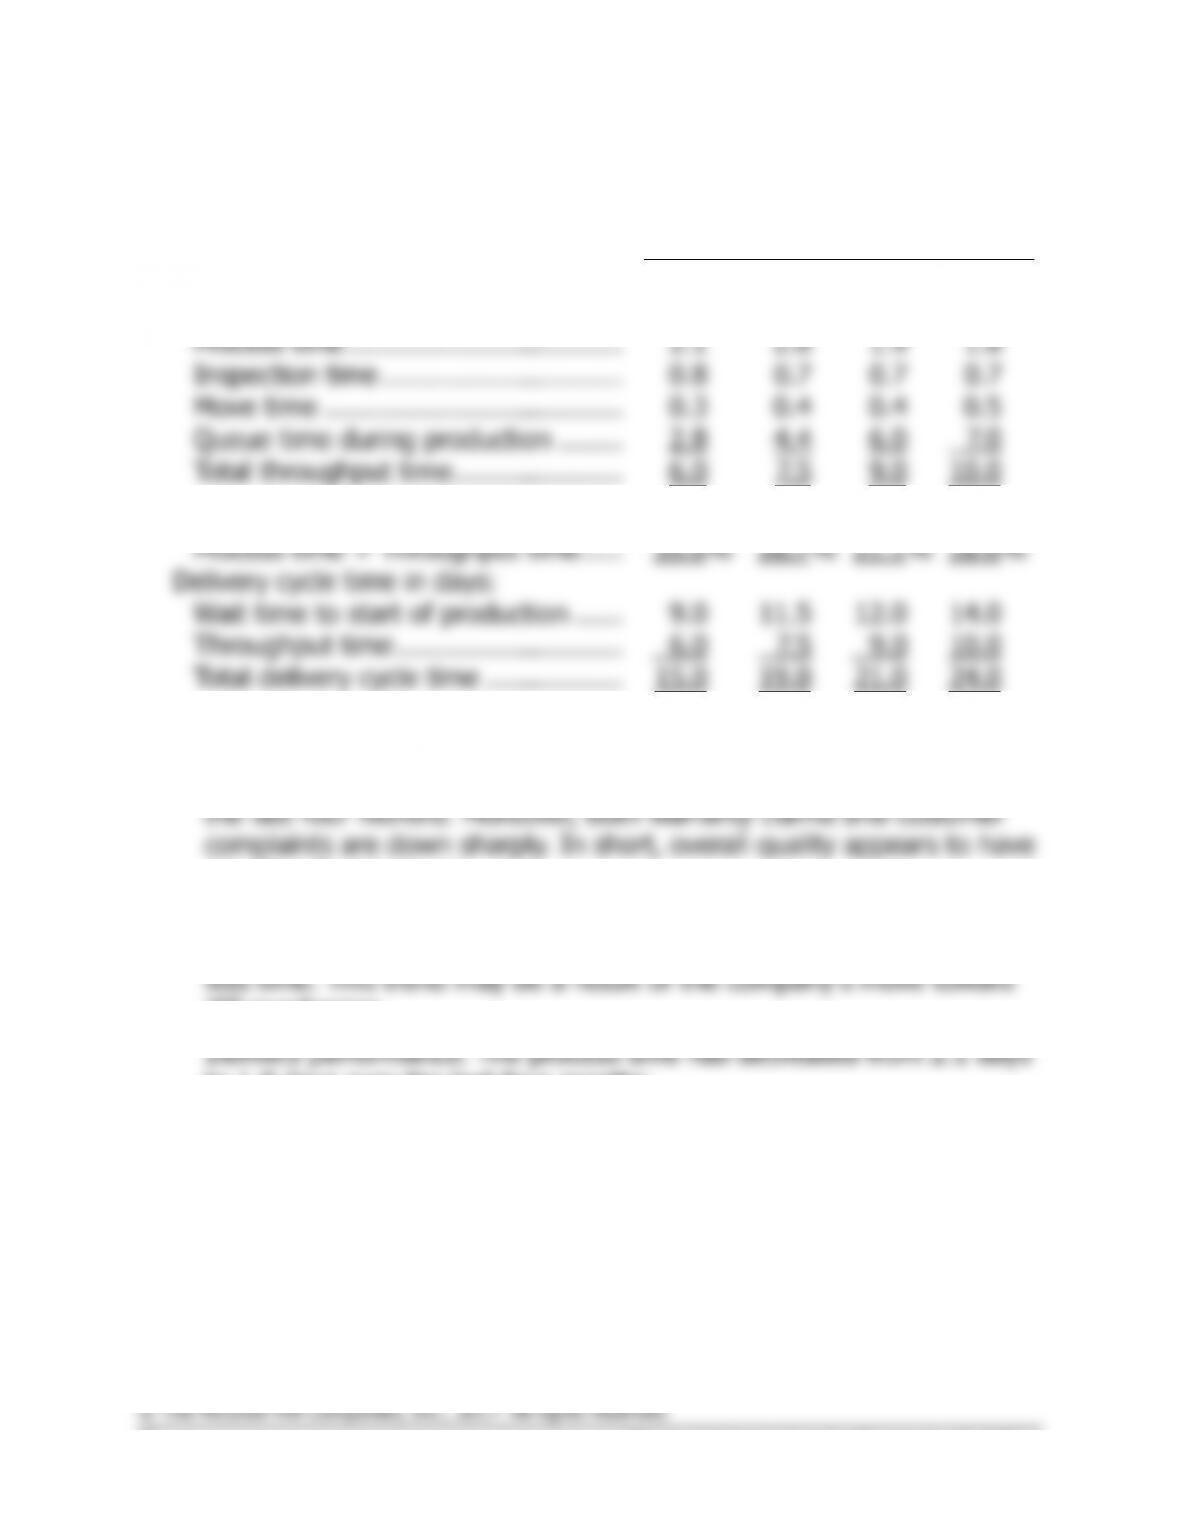
Problem 12-19 (30 minutes)
1. a., b., and c.
Month
1
2
3
4
Throughput time in days:
Process time …………………………….
2.1
2.0
1.9
1.8
Inspection time …………………………
0.8
0.7
0.7
0.7
Move time ……………………………….
0.3
0.4
0.4
0.5
Queue time during production ……..
2.8
4.4
6.0
7.0
Total throughput time …………………
6.0
7.5
9.0
10.0
Manufacturing cycle efficiency (MCE):
Process time ÷ Throughput time …..
35.0%
26.7%
21.1%
18.0%
Delivery cycle time in days:
Wait time to start of production ……
9.0
11.5
12.0
14.0
Throughput time ……………………….
6.0
7.5
9.0
10.0
Total delivery cycle time ……………..
15.0
19.0
21.0
24.0
2. a. Areas where the company is improving:
Quality control.
The number of defects has decreased by over 50% in
significantly improved.
Material control.
The purchase order lead time is only half of what it
was four months ago, which indicates that purchases are arriving in
JIT purchasing.
to 1.8 days over the last four months.
Solutions Manual, Chapter 12 37
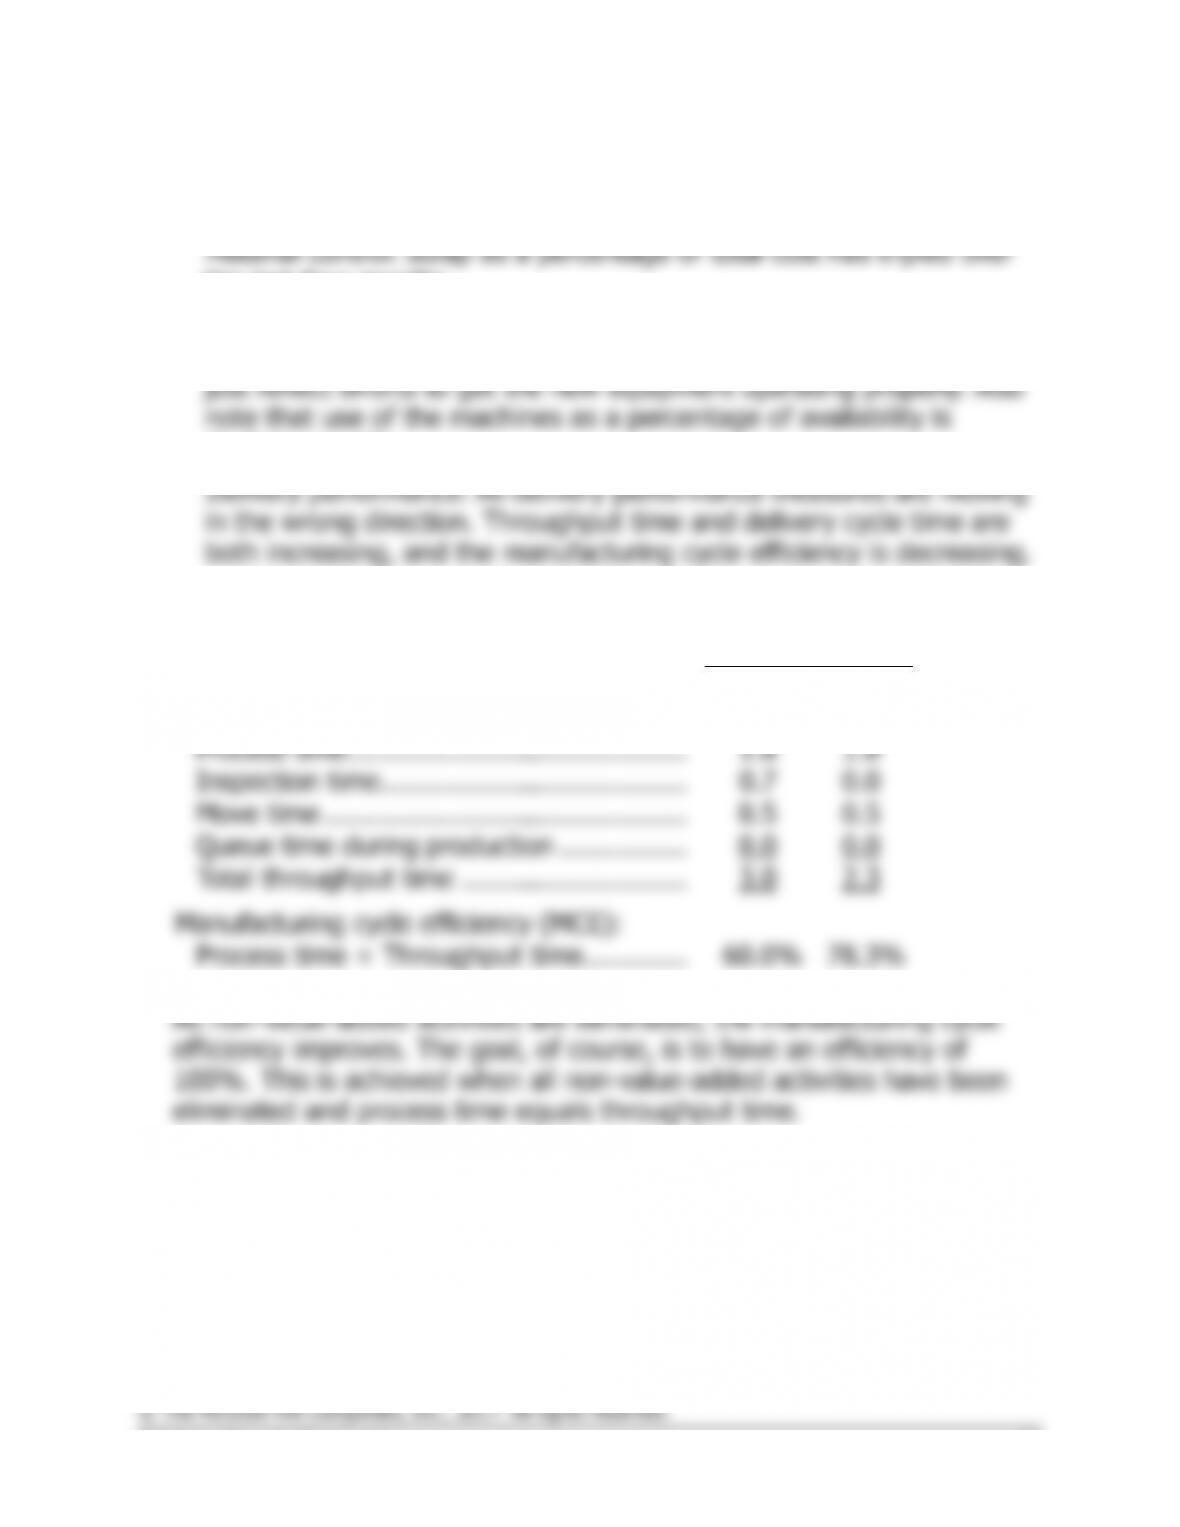
Problem 12-19 (continued)
b. Areas of deterioration:
the last four months.
Machine performance.
Machine downtime has doubled over the last
four months. This may be a result of the greater setup time, or it may
declining rapidly.
3. a. and b.
Month
5
6
Throughput time in days:
Process time ……………………………………
1.8
1.8
Inspection time ………………………………..
0.7
0.0
Move time ………………………………………
0.5
0.5
Queue time during production …………….
0.0
0.0
Total throughput time ……………………….
3.0
2.3
Manufacturing cycle efficiency (MCE):
Process time ÷ Throughput time………….
60.0%
78.3%
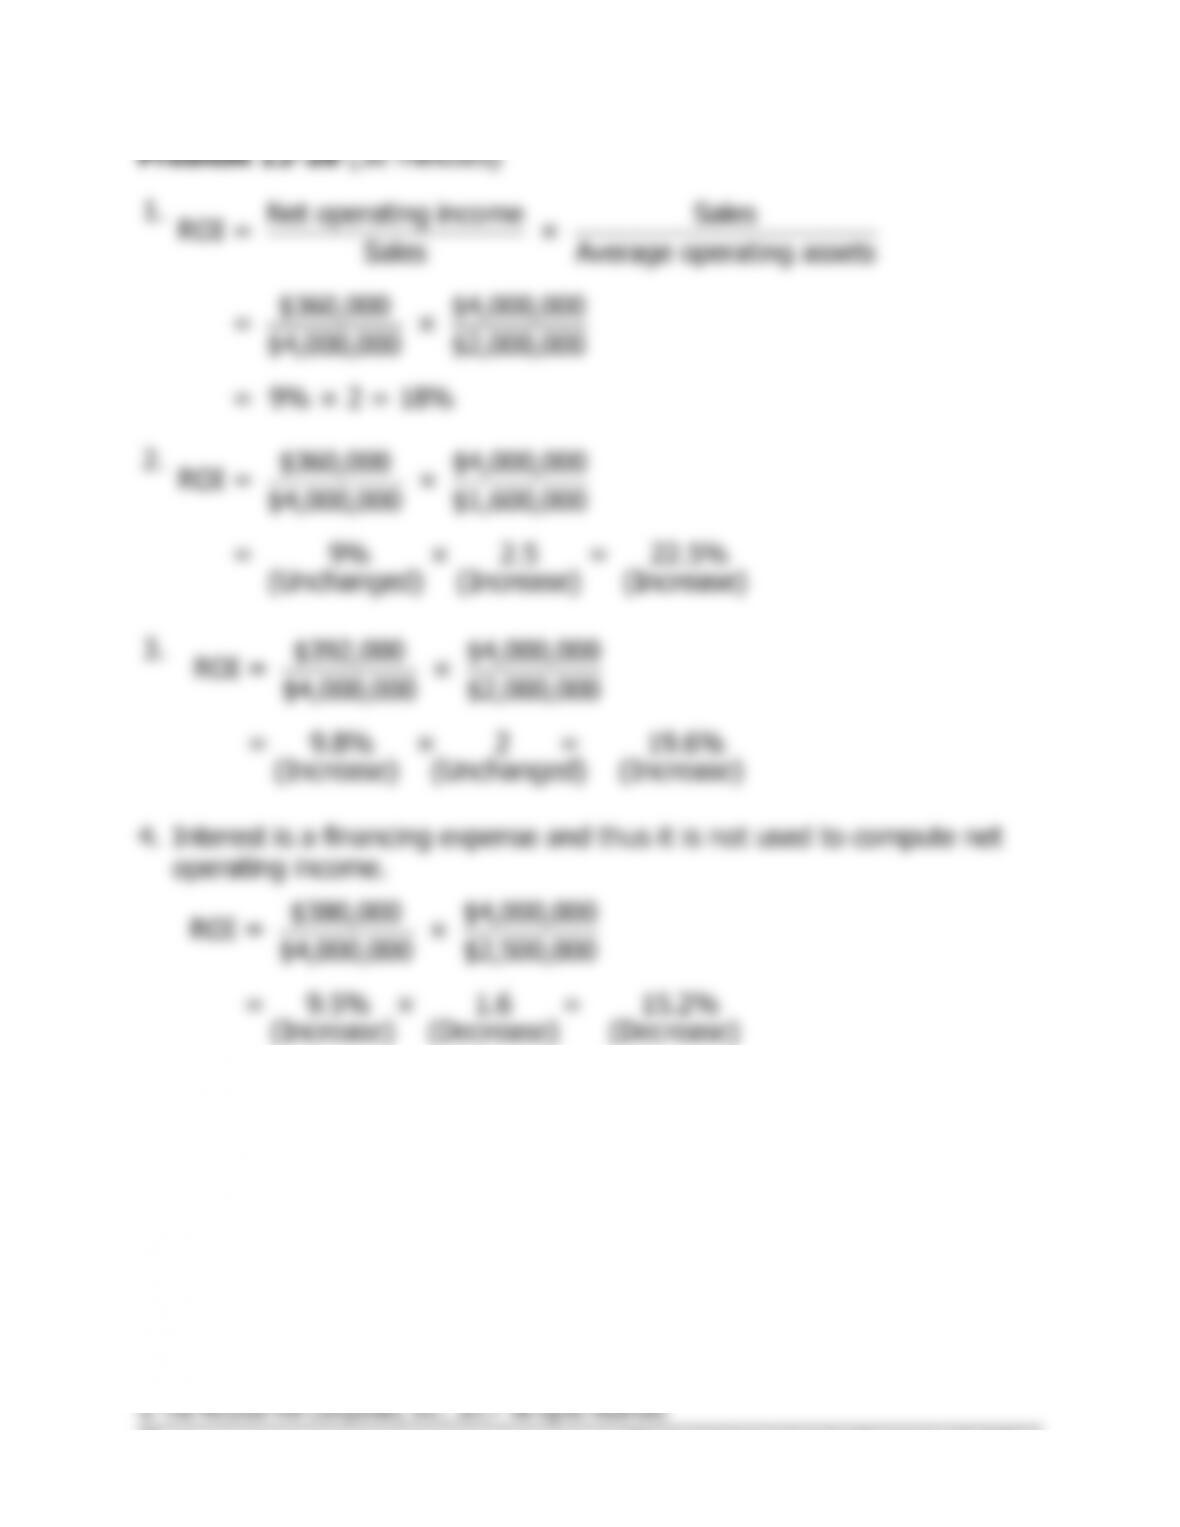
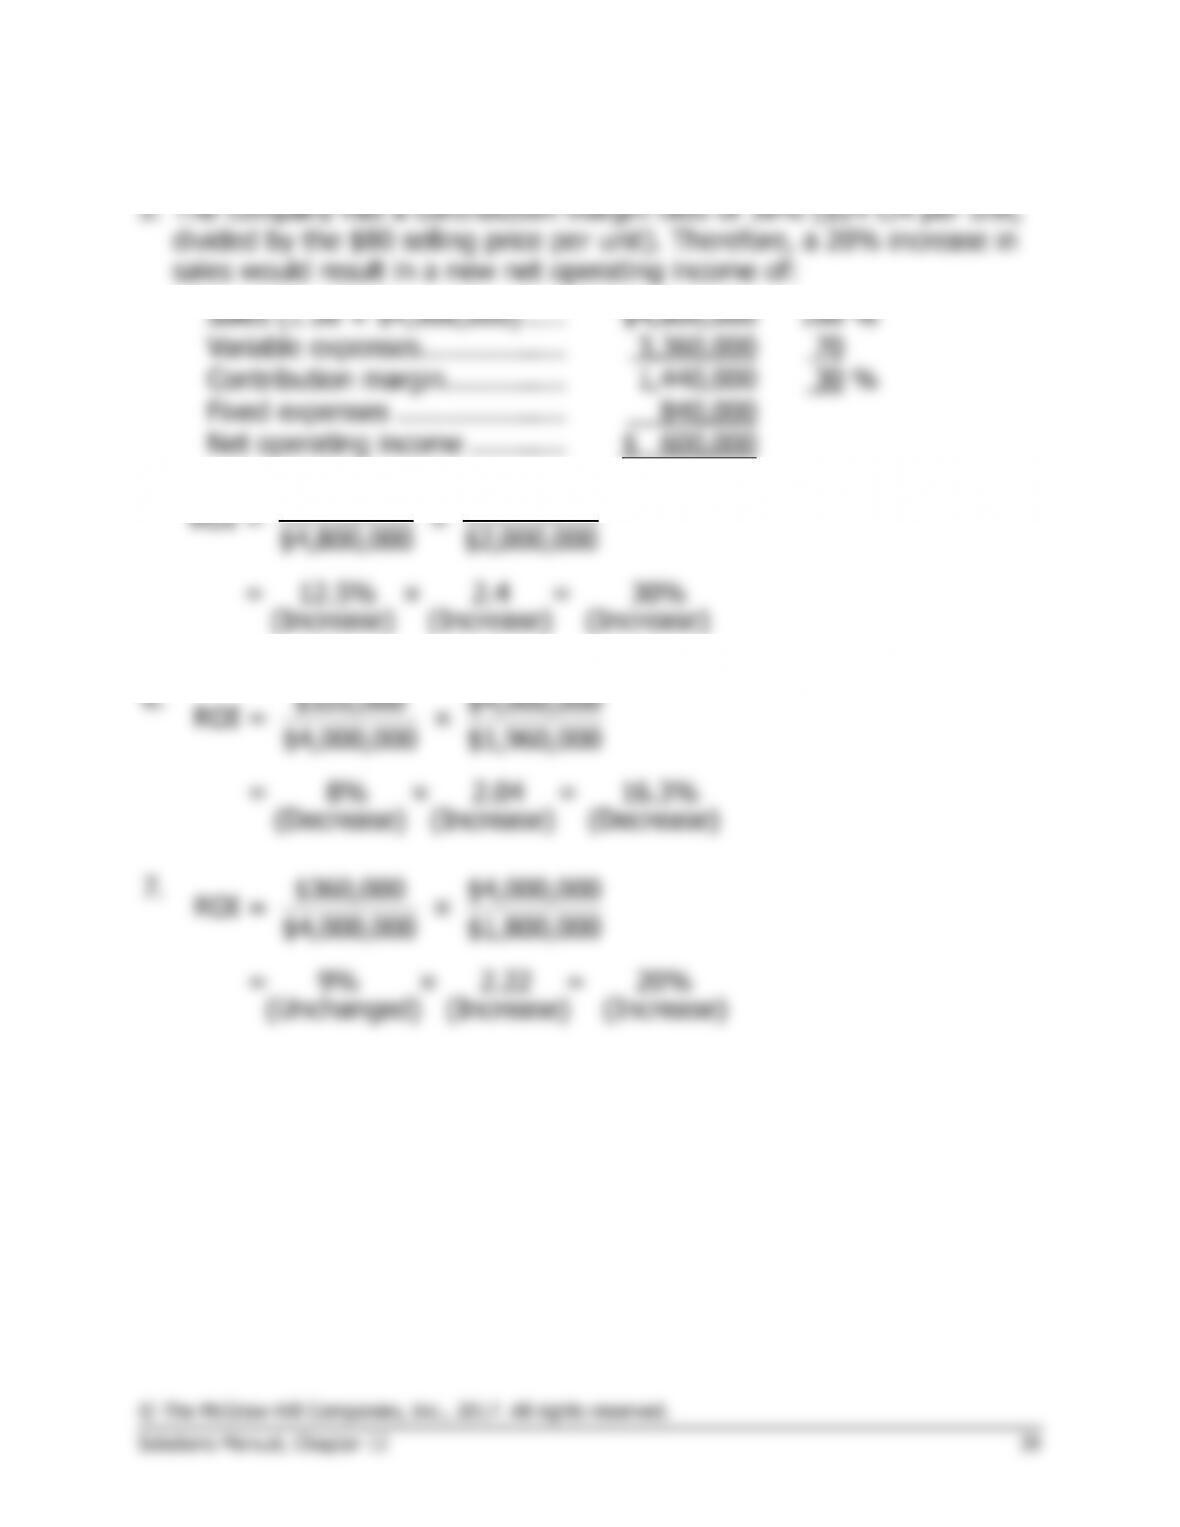
Problem 12-20 (continued)
Sales (1.20 × $4,000,000) …..
$4,800,000
100
%
Variable expenses ………………
3,360,000
70
Contribution margin ……………
1,440,000
30
%
Fixed expenses …………………
840,000
Net operating income …………
$ 600,000
$600,000 $4,800,000
ROI = ×
$4,800,000 $2,000,000
= 12.5% × 2.4 = 30%
(Increase) (Increase) (Increase)
6.
$320,000 $4,000,000
ROI = ×
$4,000,000 $1,960,000
= 8% × 2.04 = 16.3%
(Decrease) (Increase) (Decrease)
7.
$360,000 $4,000,000
ROI = ×
$4,000,000 $1,800,000
= 9% × 2.22 = 20%
(Unchanged) (Increase) (Increase)
© The McGraw-Hill Companies, Inc., 2017. All rights reserved.
40 Managerial Accounting for Managers, 4th Edition
a service-focused company. Applied Pharmaceuticals’ training resources
organization. Applied Pharmaceuticals’ technology investments are
defect from an external customer interaction standpoint.