
© The McGraw-Hill Companies, Inc., 2017. All rights reserved.
22 Managerial Accounting for Managers, 4th Edition
© The McGraw-Hill Companies, Inc., 2017. All rights reserved.
Solutions Manual, Chapter 12 23
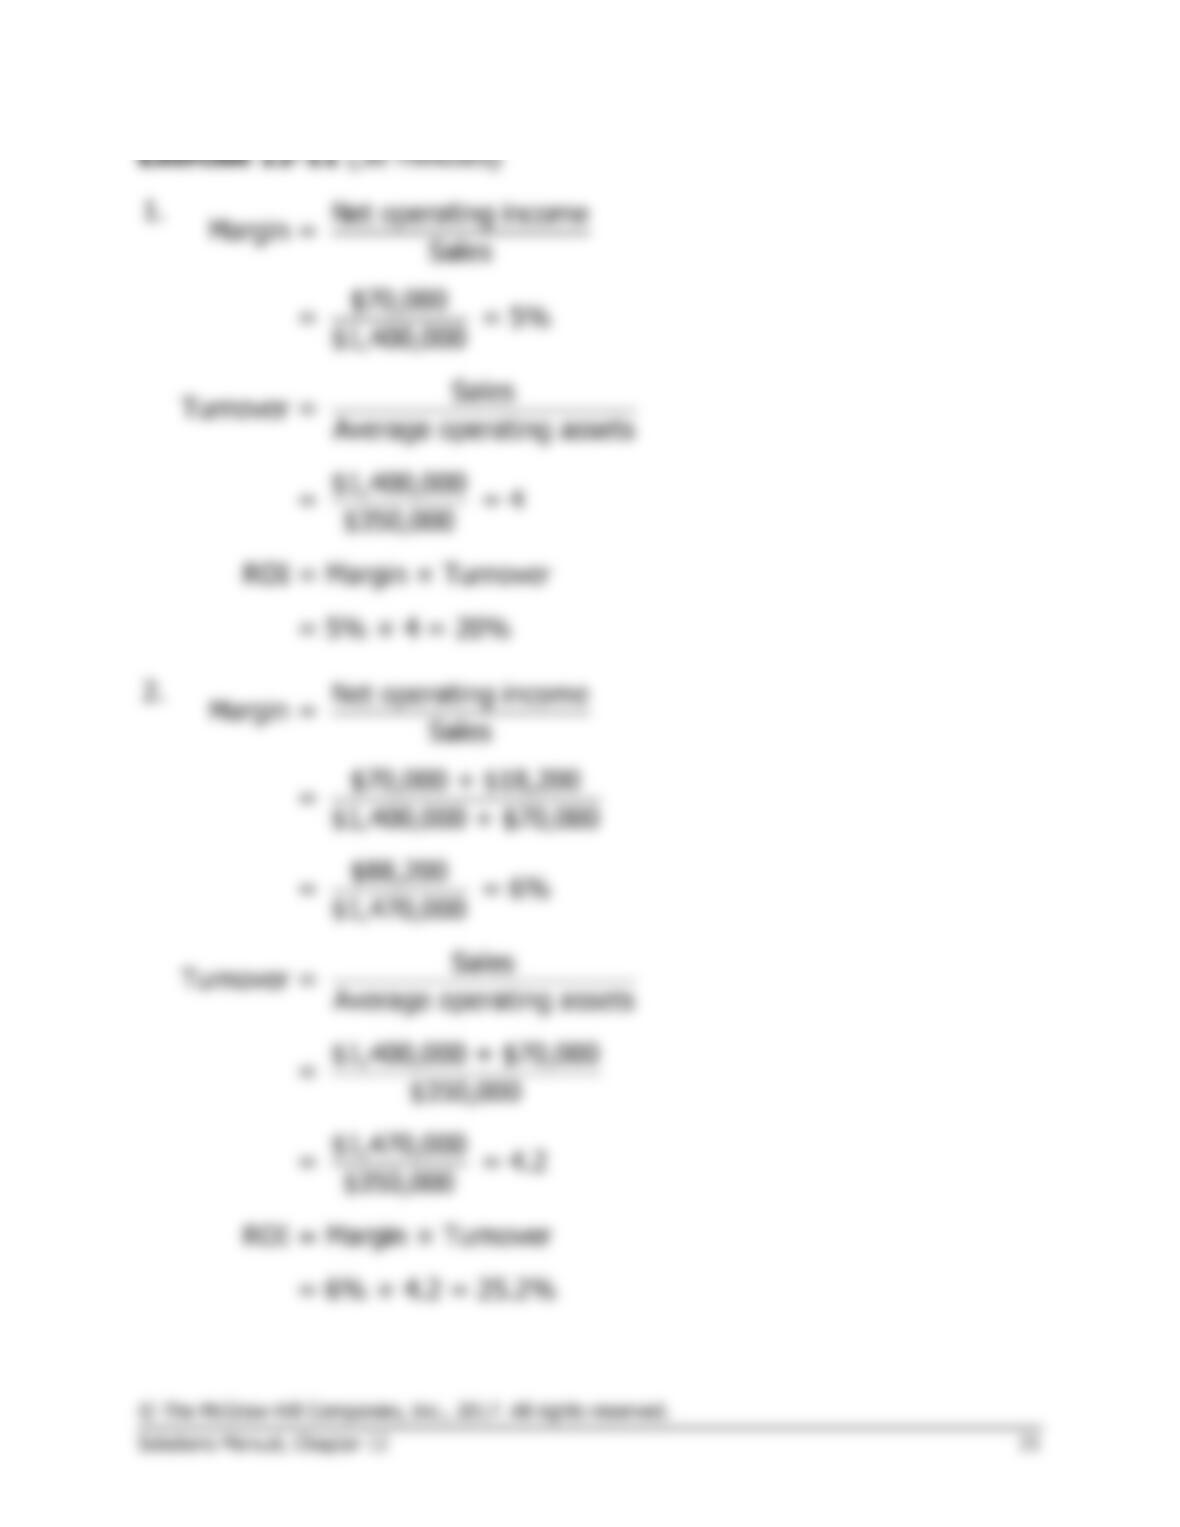
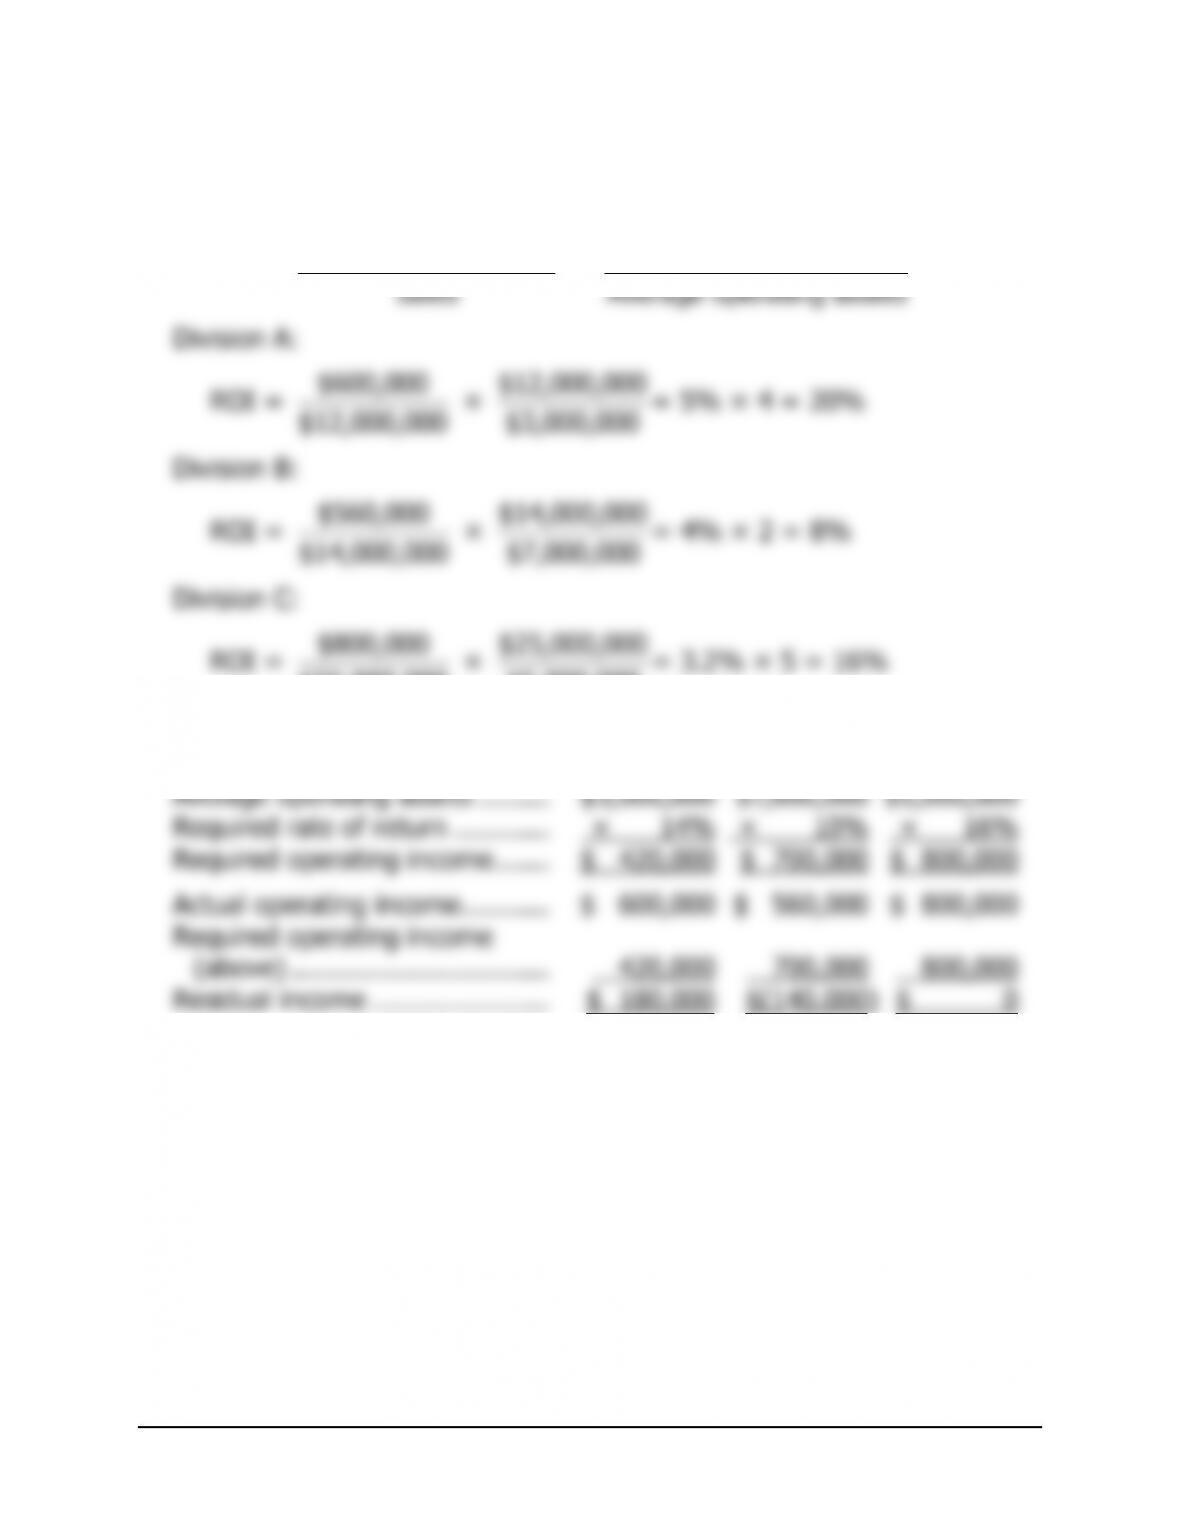
1. ROI computations:
Net operating income Sales
ROI = ×
Sales Average operating assets
Division A:
$600,000 $12,000,000
ROI = × = 5% × 4 = 20%
$12,000,000 $3,000,000
Division B:
$560,000 $14,000,000
ROI = × = 4% × 2 = 8%
$14,000,000 $7,000,000
Division C:
$800,000 $25,000,000
ROI = × = 3.2% × 5 = 16%
$25,000,000 $5,000,000
2.
Division A
Division B
Division C
Average operating assets ………
$3,000,000
$7,000,000
$5,000,000
Required rate of return …………
× 14%
× 10%
× 16%
Required operating income …….
$ 420,000
$ 700,000
$ 800,000
Actual operating income ………..
$ 600,000
$ 560,000
$ 800,000
Required operating income
(above) …………………………..
420,000
700,000
800,000
Residual income ………………….
$ 180,000
$(140,000)
$ 0
Exercise 12–12 (continued)
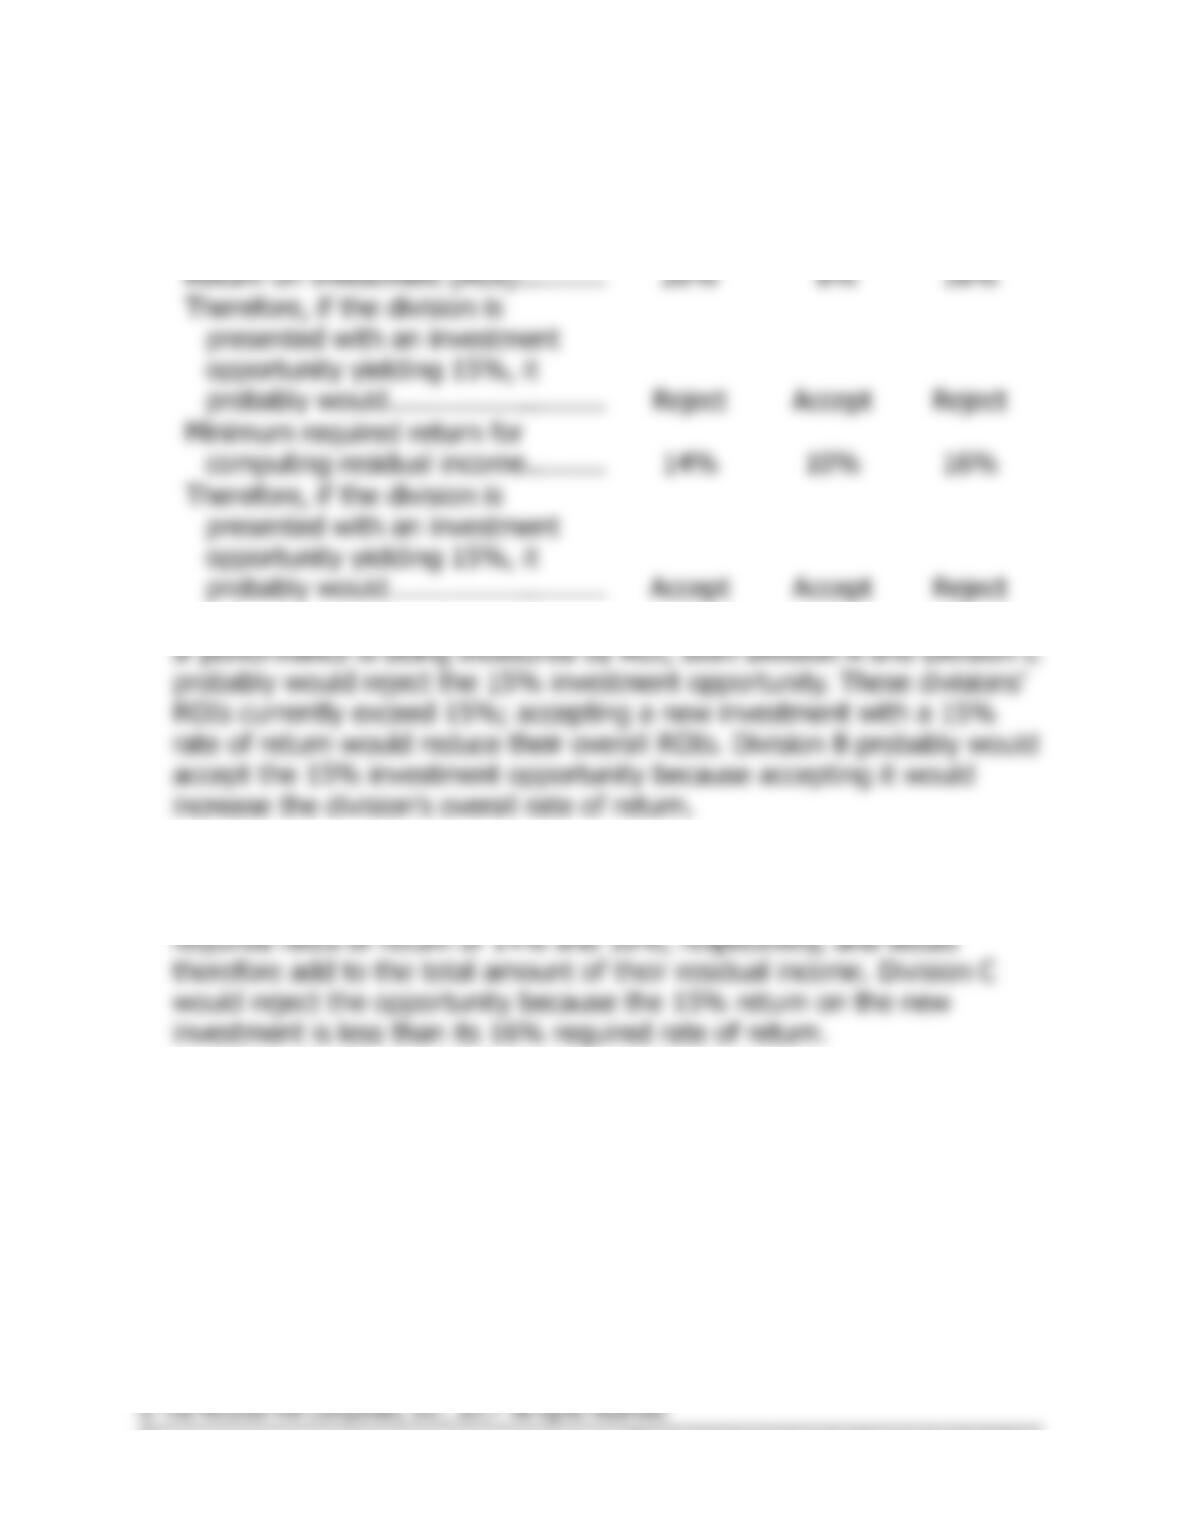
3. a. and b.
Division A
Division B
Division C
Return on investment (ROI) ………..
20%
8%
16%
Therefore, if the division is
presented with an investment
opportunity yielding 15%, it
probably would………………………
Reject
Accept
Reject
Minimum required return for
computing residual income ……….
14%
10%
16%
Therefore, if the division is
presented with an investment
opportunity yielding 15%, it
probably would………………………
Accept
Accept
Reject
If performance is measured by residual income, both Division A and
Division B probably would accept the 15% investment opportunity. The
15% rate of return promised by the new investment is greater than their


© The McGraw-Hill Companies, Inc., 2017. All rights reserved.
26 Managerial Accounting for Managers, 4th Edition
© The McGraw-Hill Companies, Inc., 2017. All rights reserved.
Solutions Manual, Chapter 12 27
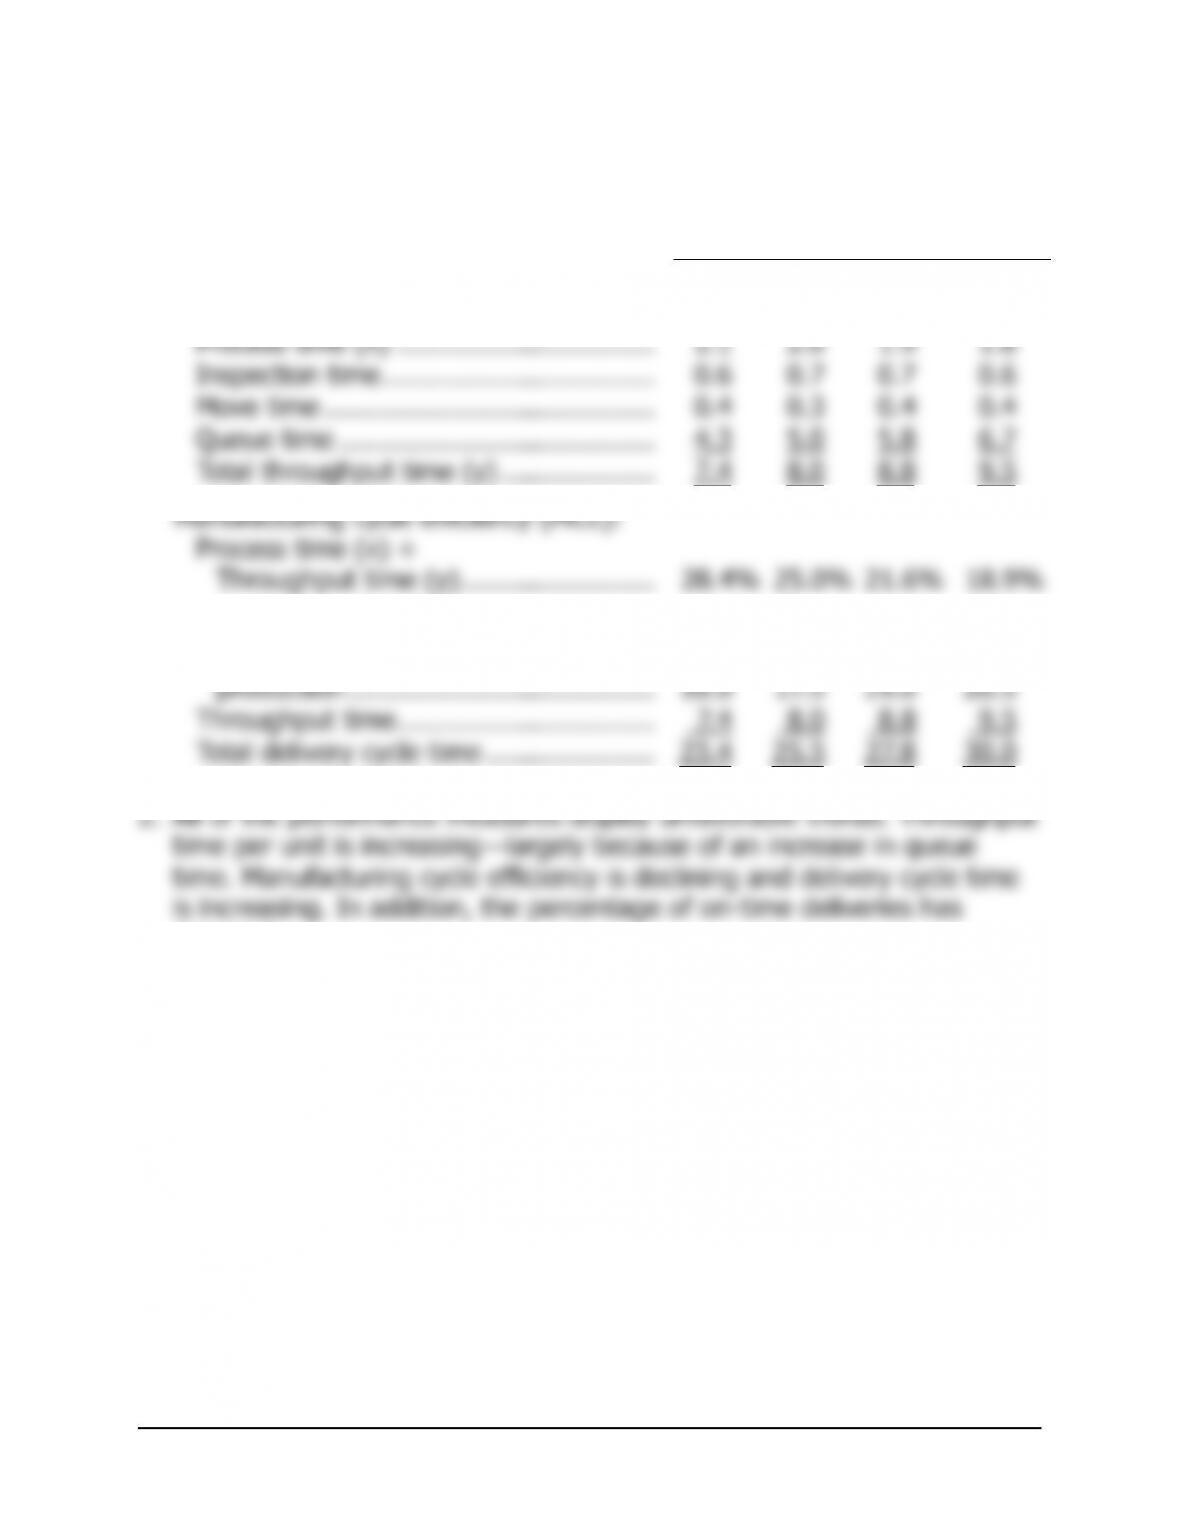
1. a., b., and c.
Month
1
2
3
4
Throughput time—days:
Process time (x) …………………………..
2.1
2.0
1.9
1.8
Inspection time …………………………….
0.6
0.7
0.7
0.6
Move time …………………………………..
0.4
0.3
0.4
0.4
Queue time …………………………..…….
4.3
5.0
5.8
6.7
Total throughput time (y) ……………….
7.4
8.0
8.8
9.5
Manufacturing cycle efficiency (MCE):
Process time (x) ÷
Throughput time (y) ……………………
28.4%
25.0%
21.6%
18.9%
Delivery cycle time—days:
Wait time from order to start of
production ………………………………..
16.0
17.5
19.0
20.5
Throughput time …………………………..
7.4
8.0
8.8
9.5
Total delivery cycle time …………………
23.4
25.5
27.8
30.0
dropped.
28 Managerial Accounting for Managers, 4th Edition
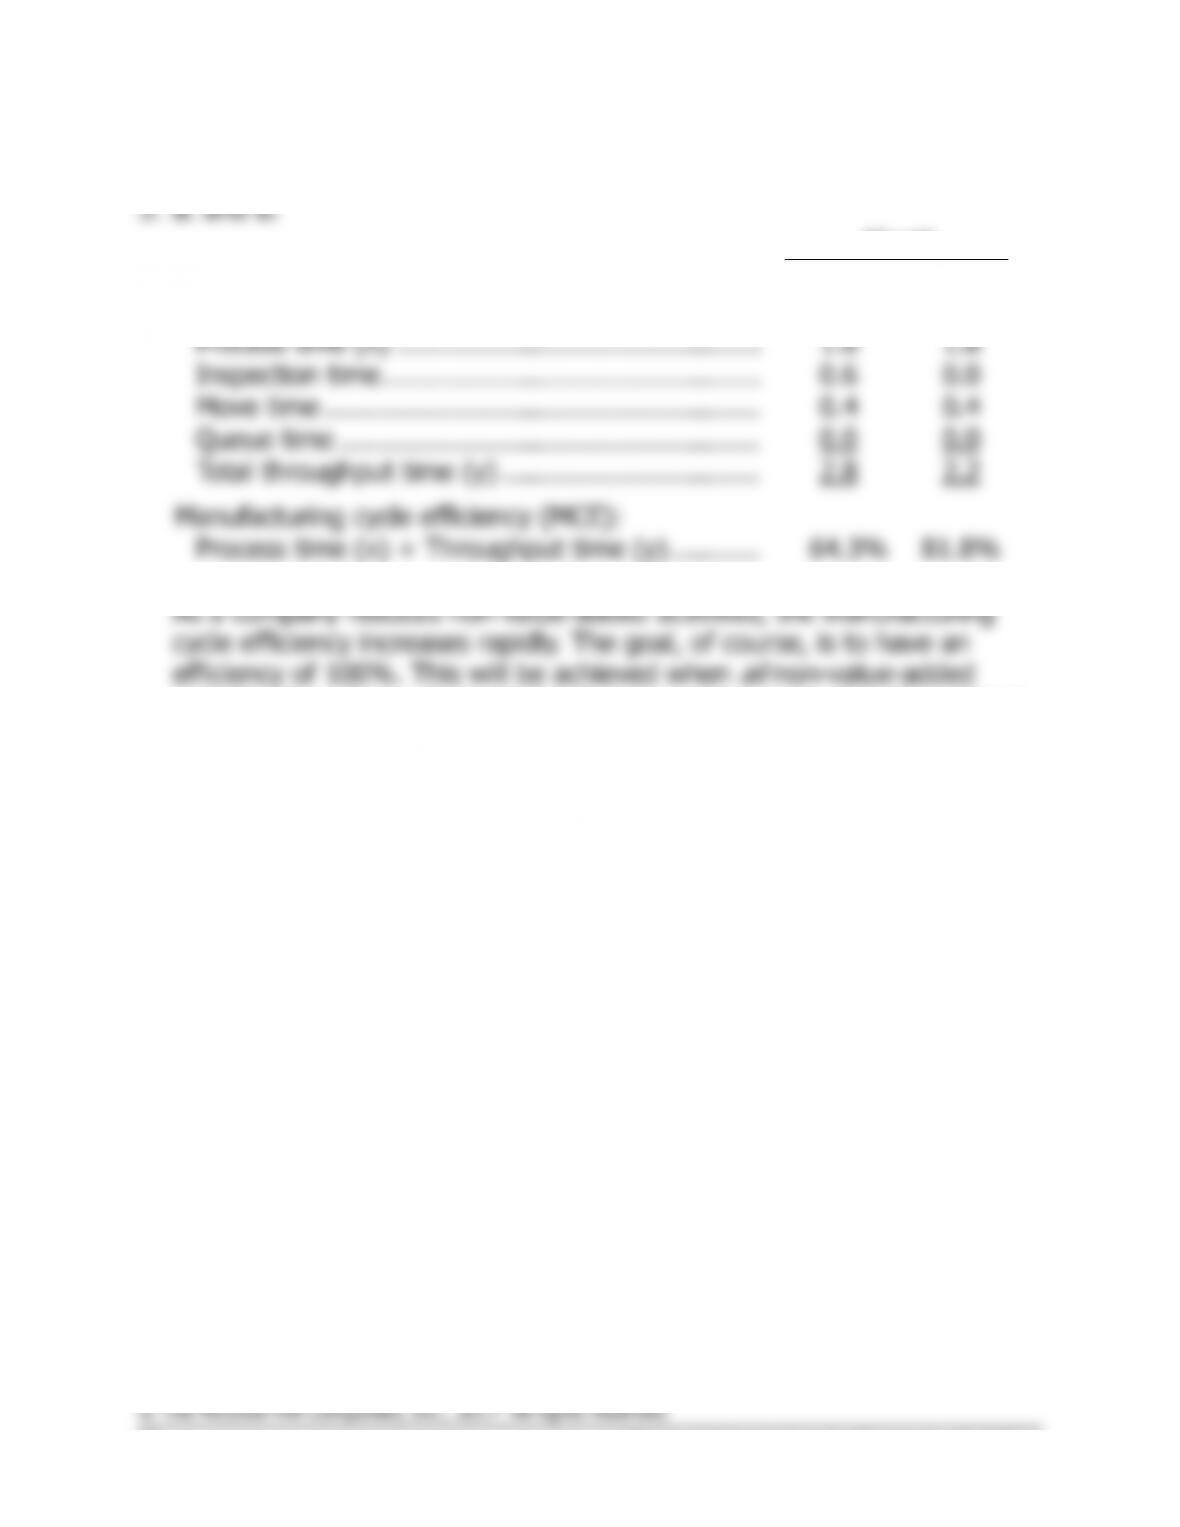
Problem 12-14 (continued)
Month
5
6
Throughput time—days:
Process time (x) ………………………………………
1.8
1.8
Inspection time ………………………………………..
0.6
0.0
Move time ………………………………………………
0.4
0.4
Queue time …………………………..………………..
0.0
0.0
Total throughput time (y) …………………………..
2.8
2.2
Manufacturing cycle efficiency (MCE):
Process time (x) ÷ Throughput time (y) ………..
64.3%
81.8%
activities have been eliminated and process time is equal to throughput
time.
Problem 12-15 (20 minutes)
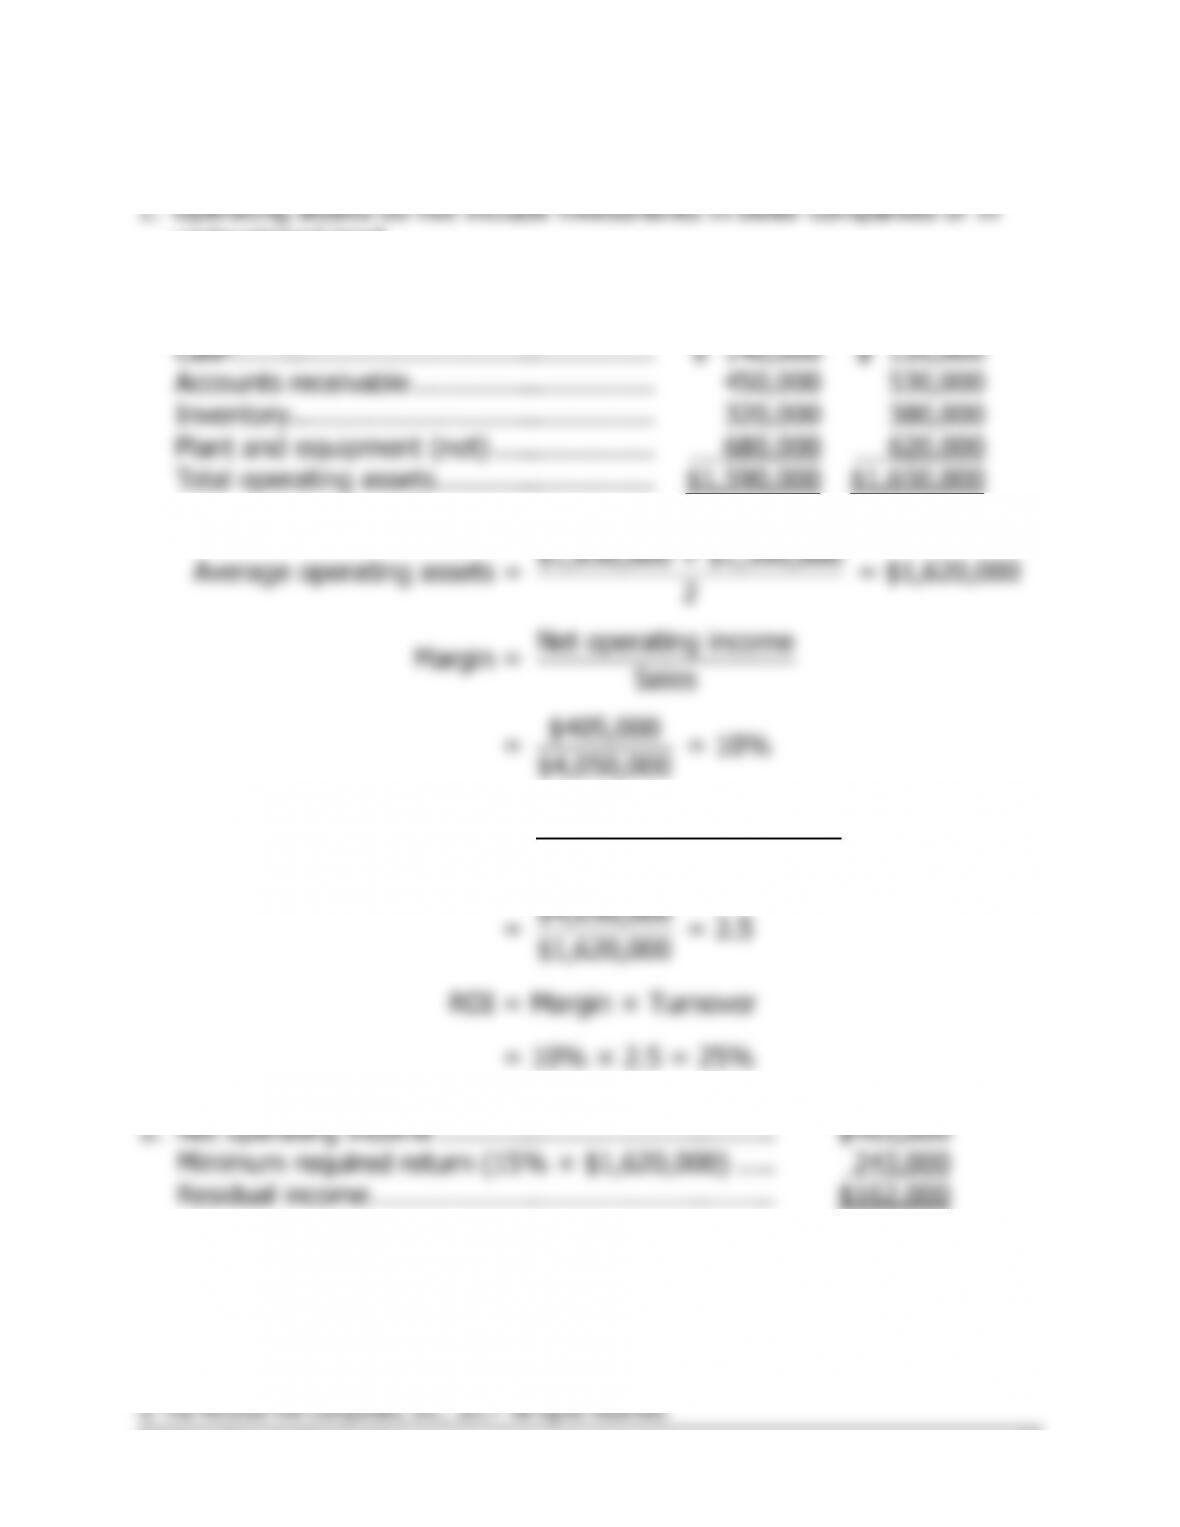
undeveloped land.
Beginning
Balances
Ending
Balances
Cash …………………………………………….
$ 140,000
$ 120,000
Accounts receivable …………………………
450,000
530,000
Inventory ………………………………………
320,000
380,000
Plant and equipment (net) ………………..
680,000
620,000
Total operating assets ………………………
$1,590,000
$1,650,000
$1,650,000 + $1,590,000
Average operating assets = = $1,620,000
2
Net operating income
Margin = Sales
$405,000
= = 10%
$4,050,000
Sales
Turnover= Average operating assets
$4,050,000
= = 2.5
$1,620,000
ROI = Margin × Turnover
Net operating income …………………………..……….
Minimum required return (15% × $1,620,000) …..
Residual income …………………………………………..
30 Managerial Accounting for Managers, 4th Edition
Problem 12-16 (45 minutes)
across more units of output. The new manufacturing strategy is focused
on low-volume production of a wide range of products. The goals of this
strategy are to increase the number of paper grades manufactured,
decrease changeover times, and increase yields across non-standard
2. Employees focus on improving those measures that are used to evaluate
their performance. Therefore, strategically-aligned performance
measures will channel employee effort towards improving those aspects
of performance that are most important to obtaining strategic
will suffer.
Some performance measures that would be appropriate for MPC’s old
strategy include: equipment utilization percentage, number of tons of
paper produced, and cost per ton produced. These performance
produced per run.