Solutions Manual, Chapter 12 11
Exercise 12-4 (continued)
3. Management will be able to tell if a hypothesis is false if an
improvement in a performance measure at the bottom of an arrow does
particular hypothesis.
12 Managerial Accounting for Managers, 4th Edition
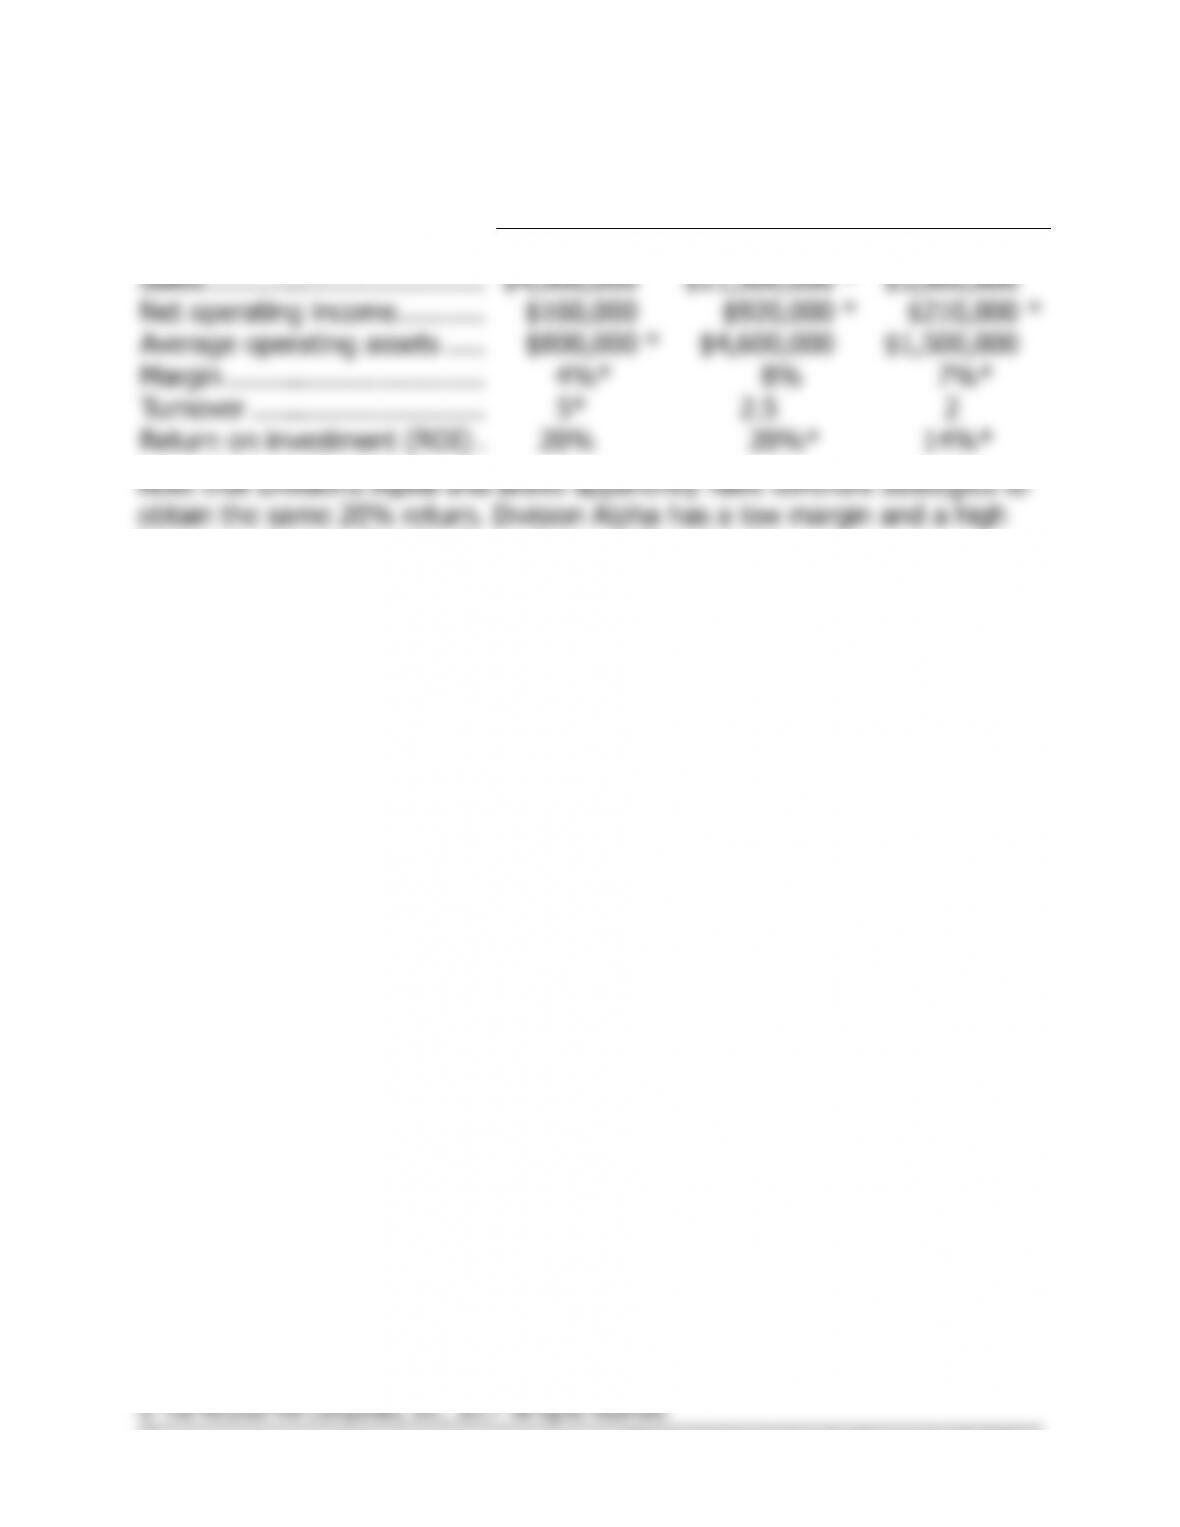
Exercise 12-5 (15 minutes)
Division
Alpha
Bravo
Charlie
Sales……………………………..
$4,000,000
$11,500,000
*
$3,000,000
Net operating income ………..
$160,000
$920,000
*
$210,000
*
Average operating assets …..
$800,000
*
$4,600,000
$1,500,000
Margin …………………………..
4%*
8%
7%*
Turnover ………………………..
5*
2.5
2
Return on investment (ROI) .
20%
20%*
14%*
turnover, whereas Division Bravo has just the opposite.
*Given.
Solutions Manual, Chapter 12 13
Exercise 12-6 (20 minutes)
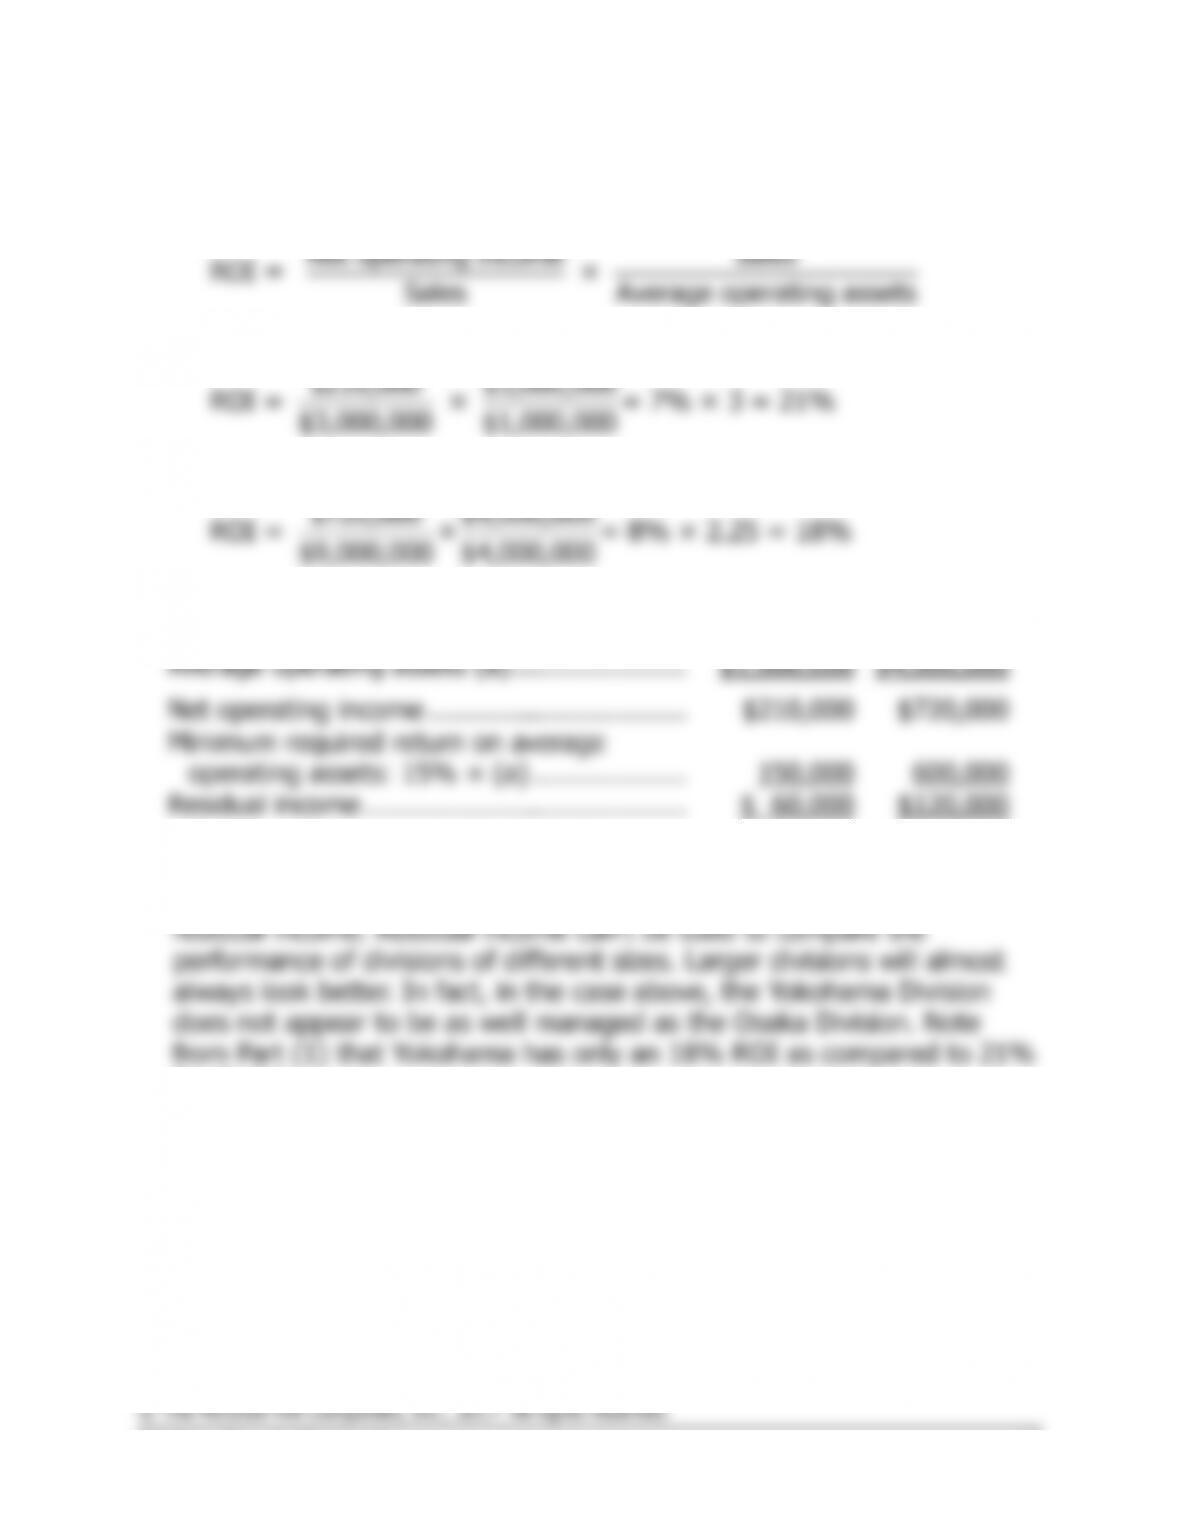
1. ROI computations:
Net operating income Sales
ROI = ×
Sales Average operating assets
Osaka Division:
$210,000 $3,000,000
ROI = × = 7% × 3 = 21%
$3,000,000 $1,000,000
Yokohama Division:
$720,000 $9,000,000
ROI = × = 8% × 2.25 = 18%
$9,000,000 $4,000,000
2.
Osaka
Yokohama
Average operating assets (a)………………….
$1,000,000
$4,000,000
Net operating income …………………………..
$210,000
$720,000
Minimum required return on average
operating assets: 15% × (a) ……………….
150,000
600,000
Residual income ………………………………….
$ 60,000
$120,000
3. No, the Yokohama Division is simply larger than the Osaka Division and
for this reason one would expect that it would have a greater amount of
for Osaka.
Exercise 12-7 (45 minutes)
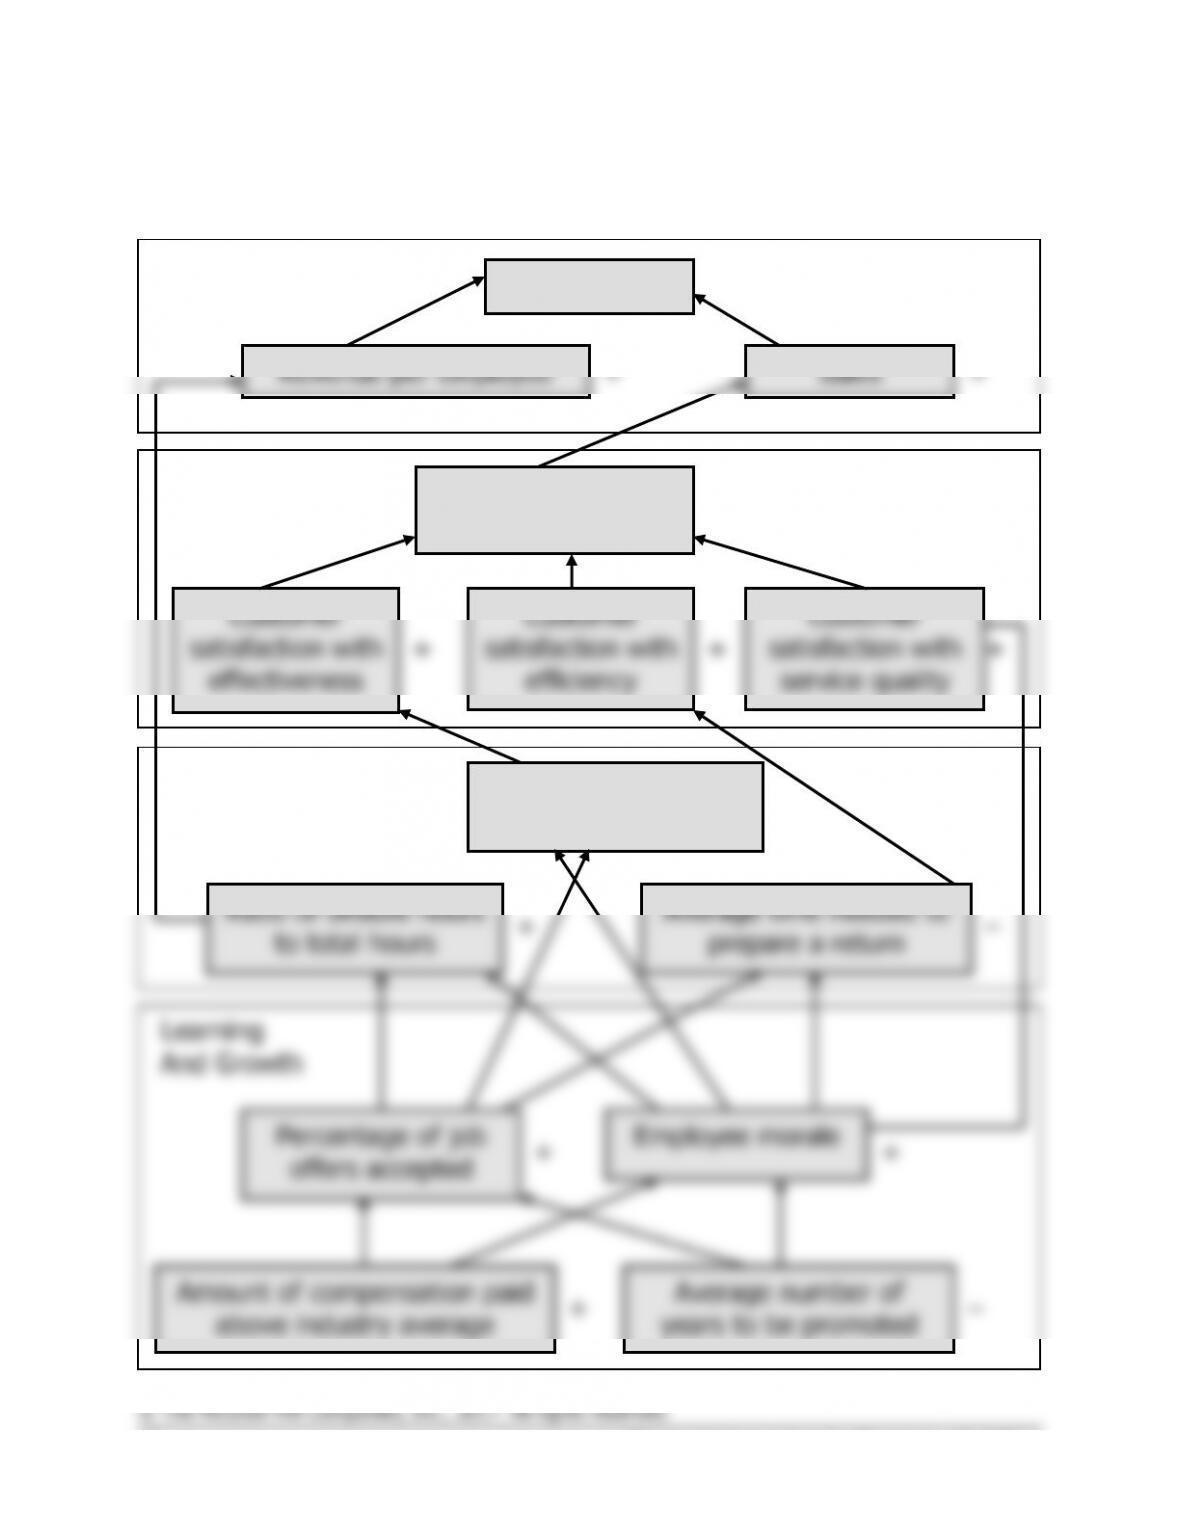
1. Students’ answers may differ in some details from this solution.
Revenue per employee
Sales
Profit margin
Financial
Ratio of billable hours
to total hours
Average number of
errors per tax return
Average time needed to
prepare a return
Percentage of job
offers accepted
Employee morale
Amount of compensation paid
above industry average
Average number of
years to be promoted
Customer
Internal Business
Processes
Learning
And Growth
+
–
+
+
+
–
Customer
satisfaction with
effectiveness
Customer
satisfaction with
efficiency
Customer
satisfaction with
service quality
Number of new
customers acquired
+
+
+
+
+
+
+
–
Solutions Manual, Chapter 12 15
Exercise 12-7 (continued)
2. The hypotheses underlying the balanced scorecard are indicated by the
arrows in the diagram. Reading from the bottom of the balanced
scorecard, the hypotheses are:
° If the amount of compensation paid above the industry average
° If the average number of years to be promoted decreases, then the
percentage of job offers accepted and the level of employee morale
will increase.
° If the percentage of job offers accepted increases, then the ratio of
prepare a return should decrease.
decrease.
° If employee morale increases, then the customer satisfaction with
service quality should increase.
per employee should increase.
customer satisfaction with efficiency should increase.
° If the customer satisfaction with effectiveness, efficiency, and service
should increase.
° If revenue per employee and sales increase, then the profit margin
should increase.
16 Managerial Accounting for Managers, 4th Edition
Exercise 12-7 (continued)
decline would probably puzzle Ariel because, although the firm prepared
what it believed to be error-free returns, it overlooked opportunities to
minimize customers’ taxes. In this example, Ariel’s internal business
process measure of the average number of errors per tax return does
accordingly.
3. The performance measure “total dollar amount of tax refunds
generated” would motivate Ariel’s employees to aggressively search for
customers. Overall, it would probably be unwise to use this performance
measure in Ariel’s scorecard.
opportunities.
Solutions Manual, Chapter 12 17
Exercise 12-7 (continued)
4. Each office’s individual performance should be based on the scorecard
measures only if the measures are controllable by those employed at
typically made at the branch offices. On the other hand, it would make
sense to measure the branch offices with respect to internal business
each office.
18 Managerial Accounting for Managers, 4th Edition
Exercise 12-8 (15 minutes)
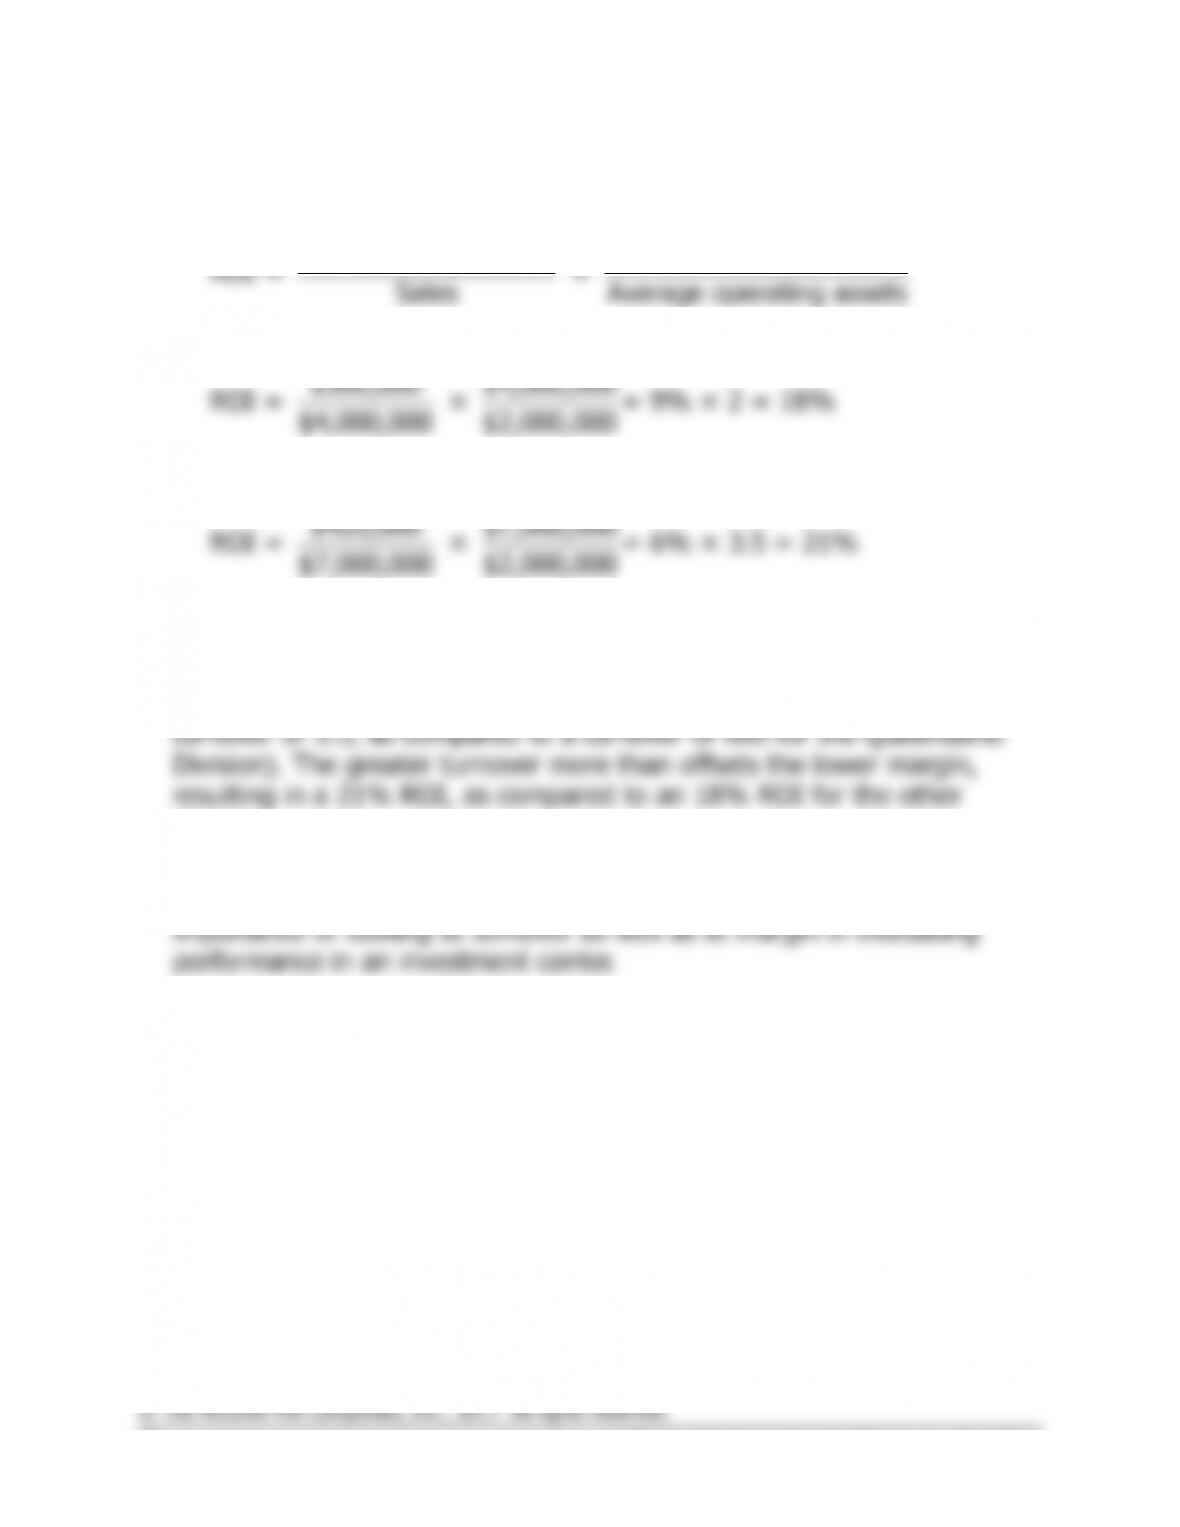
1. ROI computations:
Net operating income Sales
ROI = ×
Sales Average operating assets
Queensland Division:
$360,000 $4,000,000
ROI = × = 9% × 2 = 18%
$4,000,000 $2,000,000
New South Wales Division:
$420,000 $7,000,000
ROI = × = 6% × 3.5 = 21%
$7,000,000 $2,000,000
2. The manager of the New South Wales Division seems to be doing the
better job. Although her margin is three percentage points lower than
the margin of the Queensland Division, her turnover is higher (a
division.
Notice that if you look at margin alone, then the Queensland Division
appears to be the stronger division. This fact underscores the
Solutions Manual, Chapter 12 19
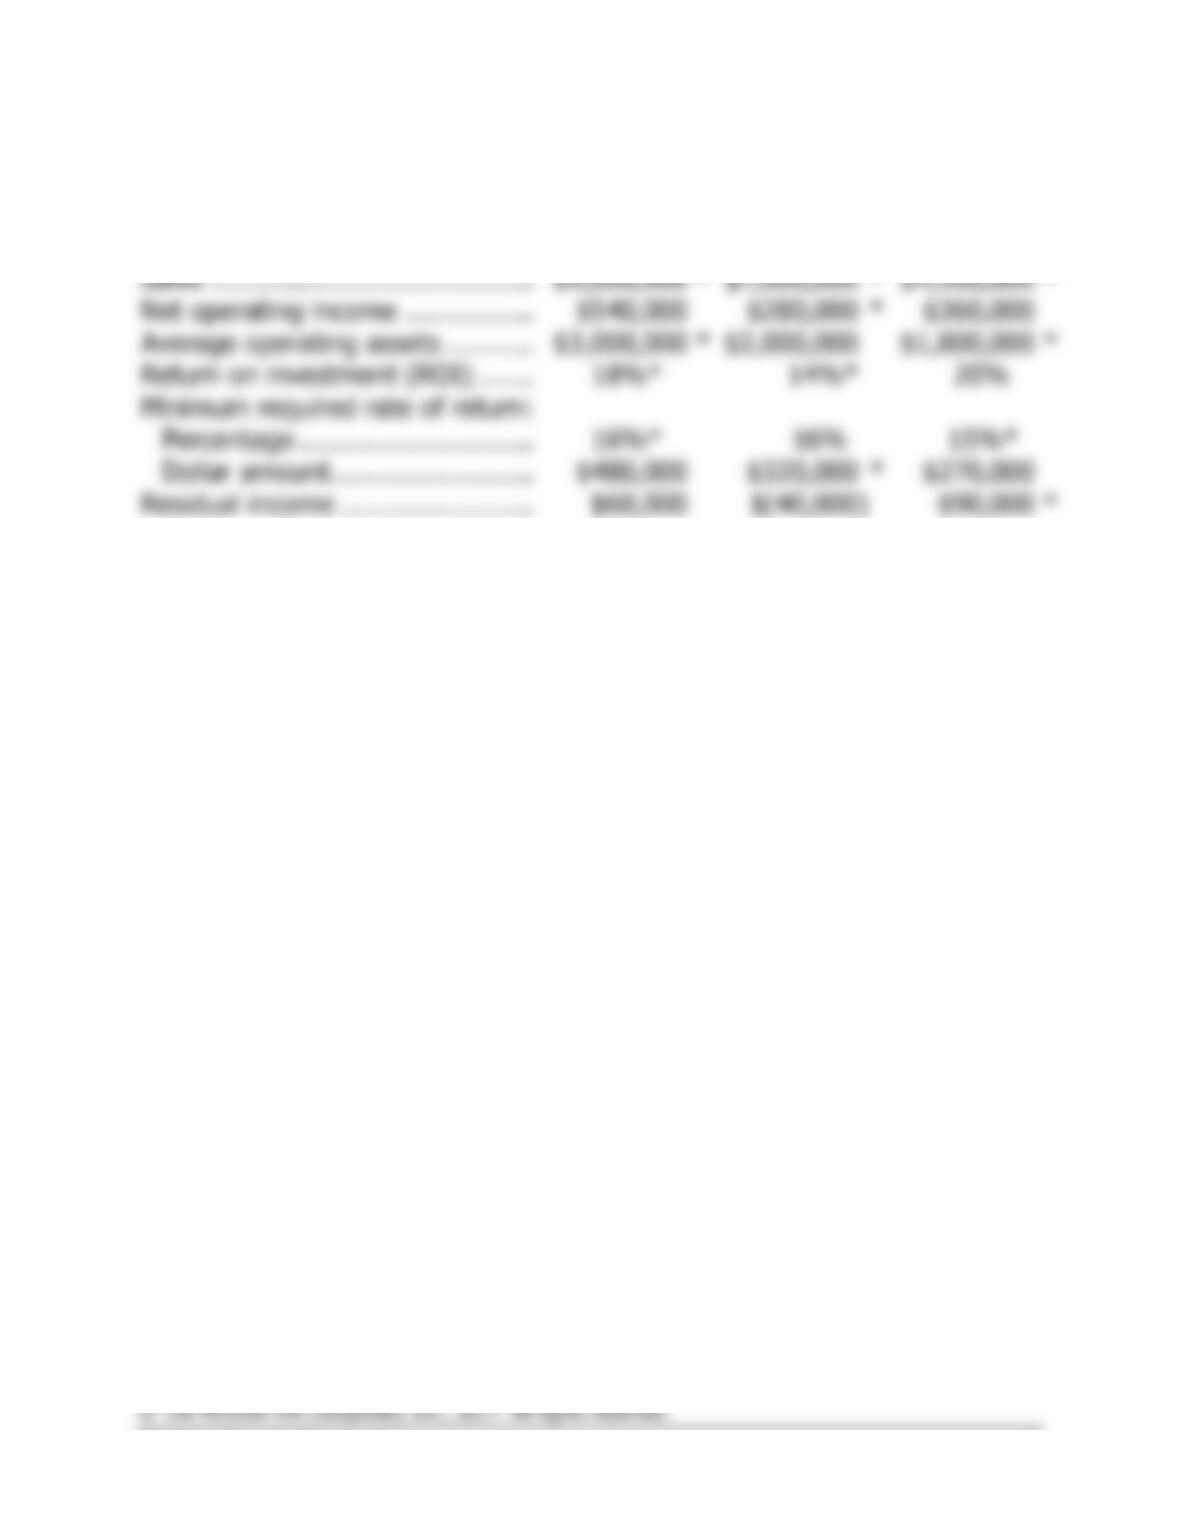
Exercise 12-9 (15 minutes)
Company A
Company B
Company C
Sales ………………………………….
$9,000,000
*
$7,000,000
*
$4,500,000
*
Net operating income …………….
$540,000
$280,000
*
$360,000
Average operating assets ………..
$3,000,000
*
$2,000,000
$1,800,000
*
Return on investment (ROI) …….
18%*
14%*
20%
Minimum required rate of return:
Percentage ………………………..
16%*
16%
15%*
Dollar amount …………………….
$480,000
$320,000
*
$270,000
Residual income ……………………
$60,000
$(40,000)
$90,000
*
*Given.
20 Managerial Accounting for Managers, 4th Edition
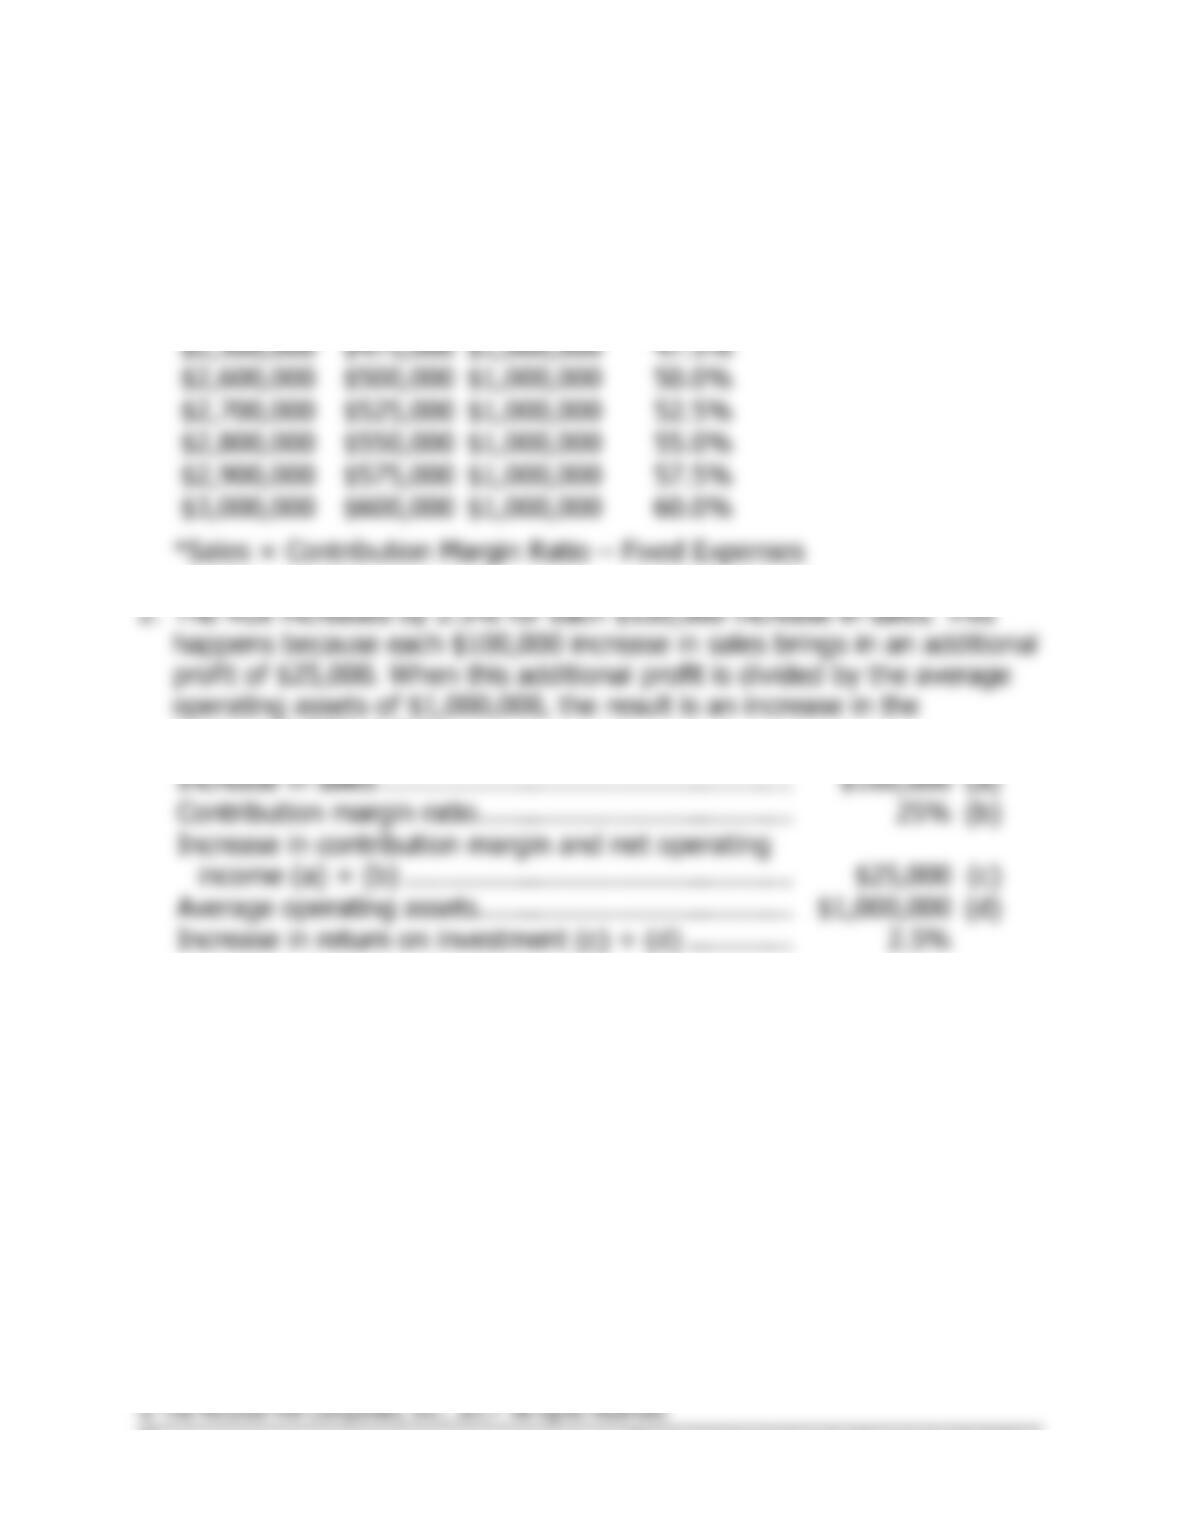
Exercise 12-10 (20 minutes)
1.
(b)
(c)
Net
Average
(a)
Operating
Operating
ROI
Sales
Income*
Assets
(b) ÷ (c)
$2,500,000
$475,000
$1,000,000
47.5%
$2,600,000
$500,000
$1,000,000
50.0%
$2,700,000
$525,000
$1,000,000
52.5%
$2,800,000
$550,000
$1,000,000
55.0%
$2,900,000
$575,000
$1,000,000
57.5%
$3,000,000
$600,000
$1,000,000
60.0%
*Sales × Contribution Margin Ratio – Fixed Expenses
company’s ROI of 2.5%.
Increase in sales ……………………………………………
$100,000
(a)
Contribution margin ratio …………………………………
25%
(b)
Increase in contribution margin and net operating
income (a) × (b) …………………………………………
$25,000
(c)
Average operating assets…………………………………
$1,000,000
(d)
Increase in return on investment (c) ÷ (d) ………….
2.5%