Unlock document.
This document is partially blurred.
Unlock all pages and 1 million more documents.
Get Access
P9.27.
(continued)
b.
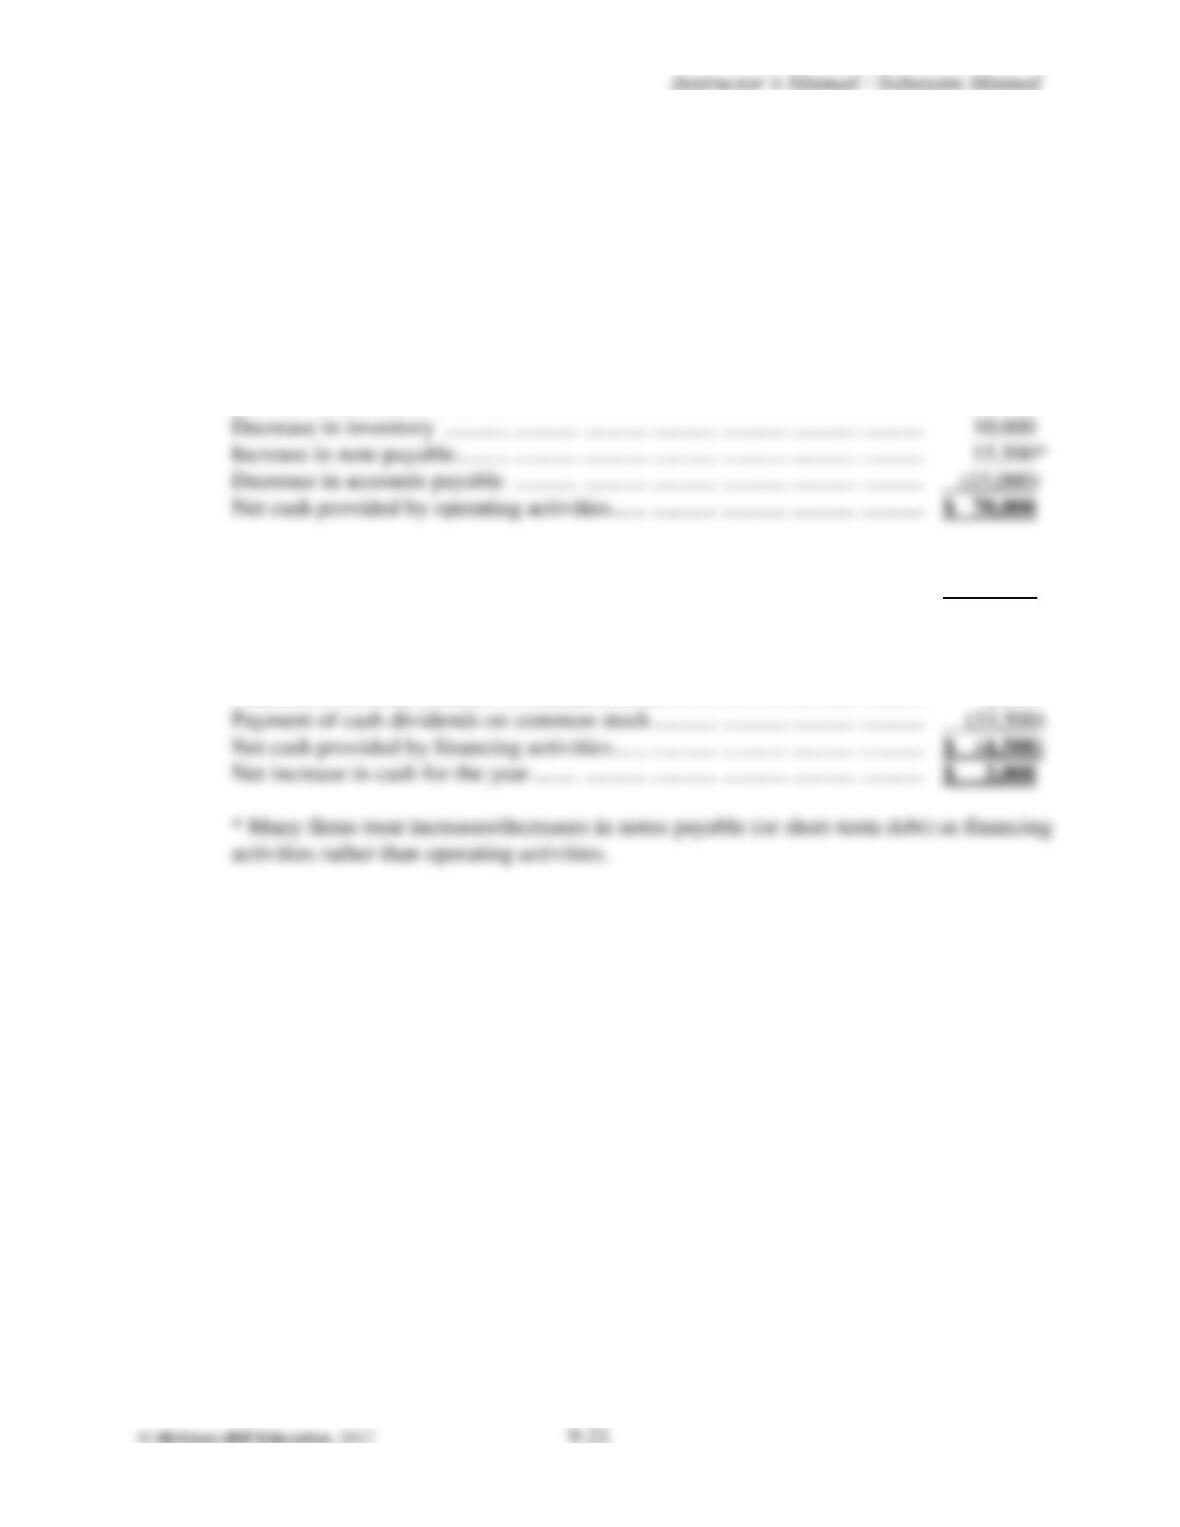
HOEMAN, INC.
Statement of Cash Flows
For the Year Ended December 31, 2017
Cash flows from operating activities:
Net income .... ........... ........... ........... ........... ........... ........... ........... ........... $ 47,000
Add (deduct) items not affecting cash:
Depreciation expense ........... ........... ........... ........... ........... ........... ........... 7,500
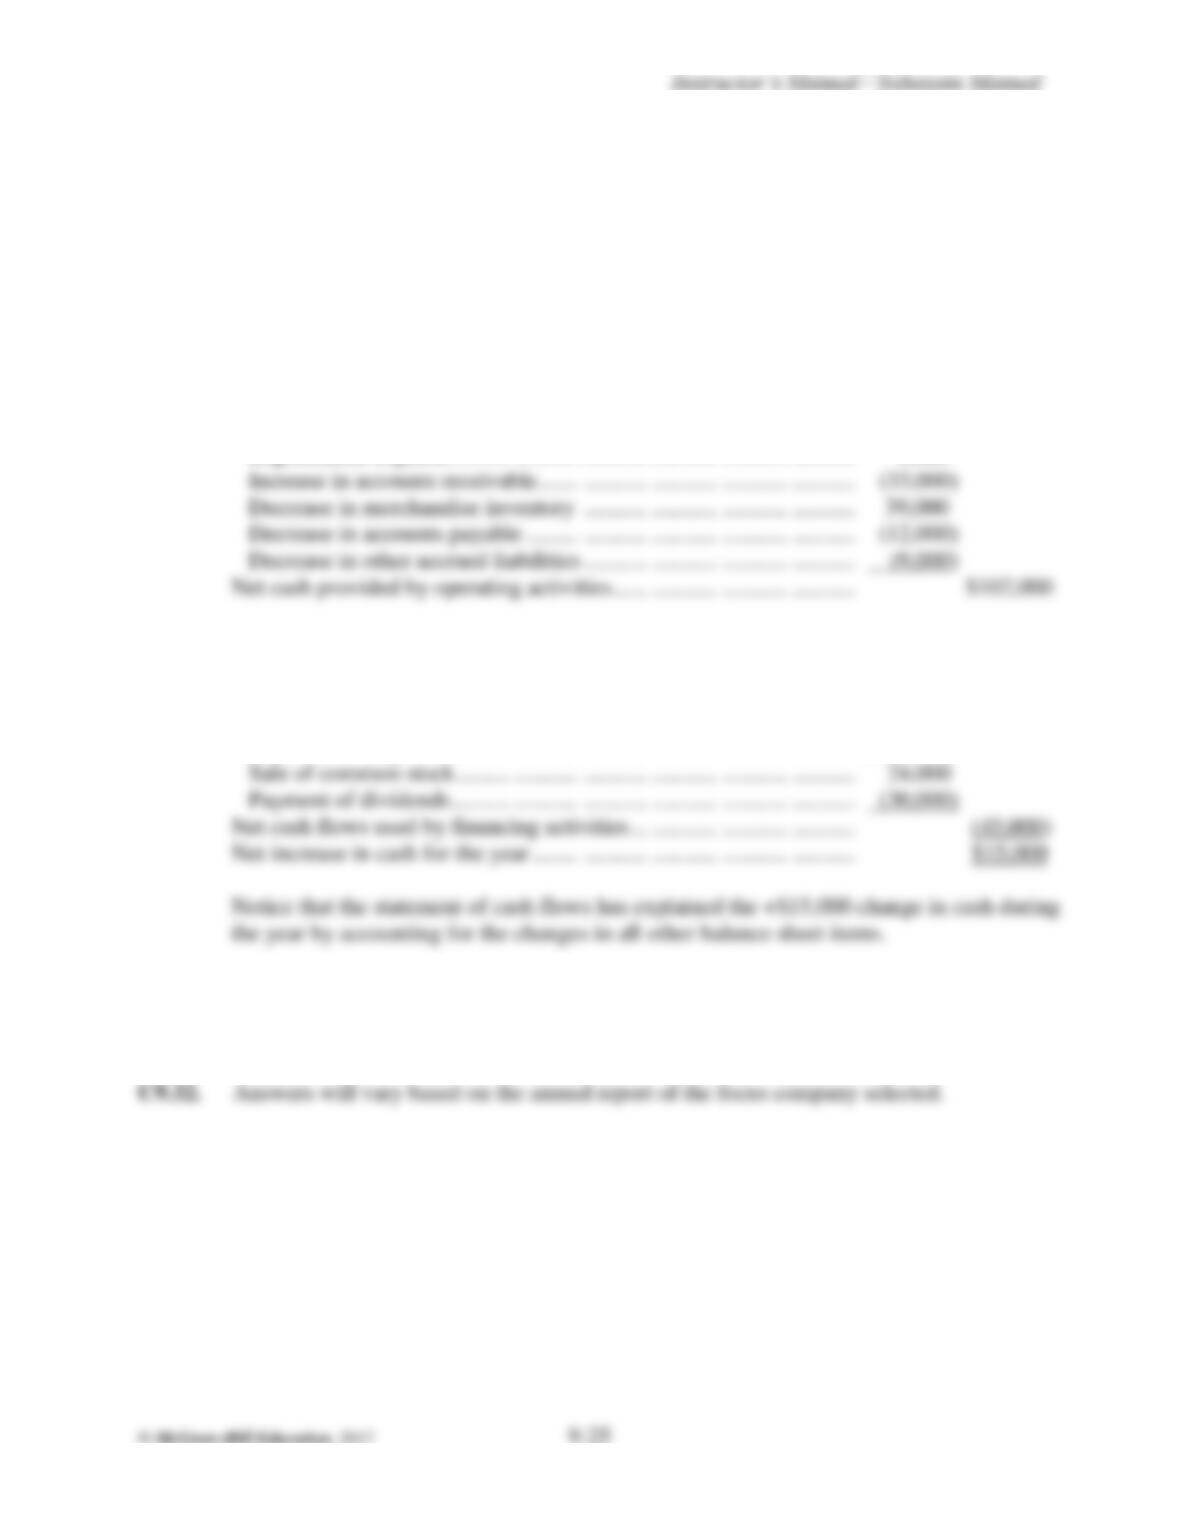
Decrease in accounts receivable ........ ........... ........... ........... ........... ........... 5,000
Cash flows from investing activities:
Cash paid to acquire new buildings .. ........... ........... ........... ........... ........... $ (62,500)
Cash flows from financing activities:
Cash received from issuance of long-term debt......... ........... ........... ........... $ 26,500
Cash received from issuance of common stock ......... ........... ........... ........... 2,500
P9.28.
a.
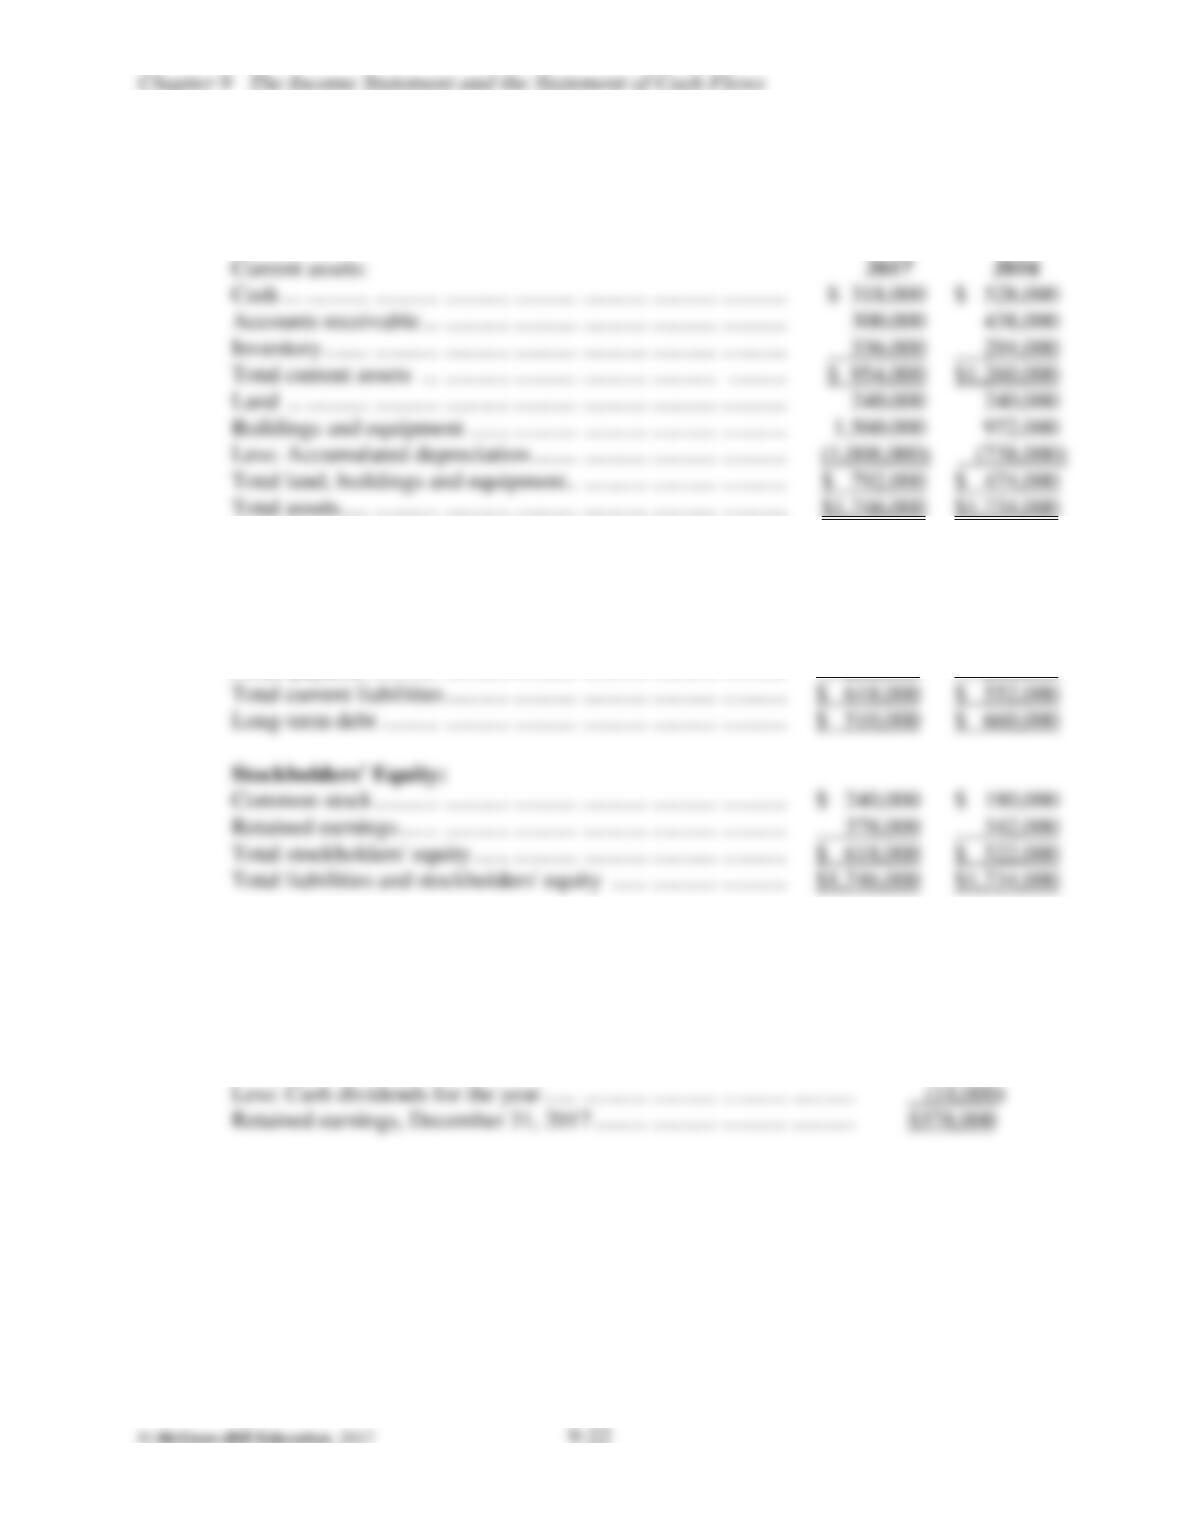
HARTFORD, INC.
Comparative Balance Sheets
December 31, 2017, and 2016
Assets:
Liabilities:
Current liabilities:
Accounts payable ....... ........... ........... ........... ........... ........... $ 138,000 $ 174,000
Short-term debt .......... ........... ........... ........... ........... ........... 192,000 162,000
Notes payable . ........... ........... ........... ........... ........... ........... 288,000 216,000
b.
HARTFORD, INC.
Statement of Changes in Retained Earnings
For the Year Ended December 31, 2017
Retained earnings, January 1, 2017 ... ........... ........... ........... ........... $342,000
Add: Net income for the year ........... ........... ........... ........... ........... 54,000
P9.29.
a.
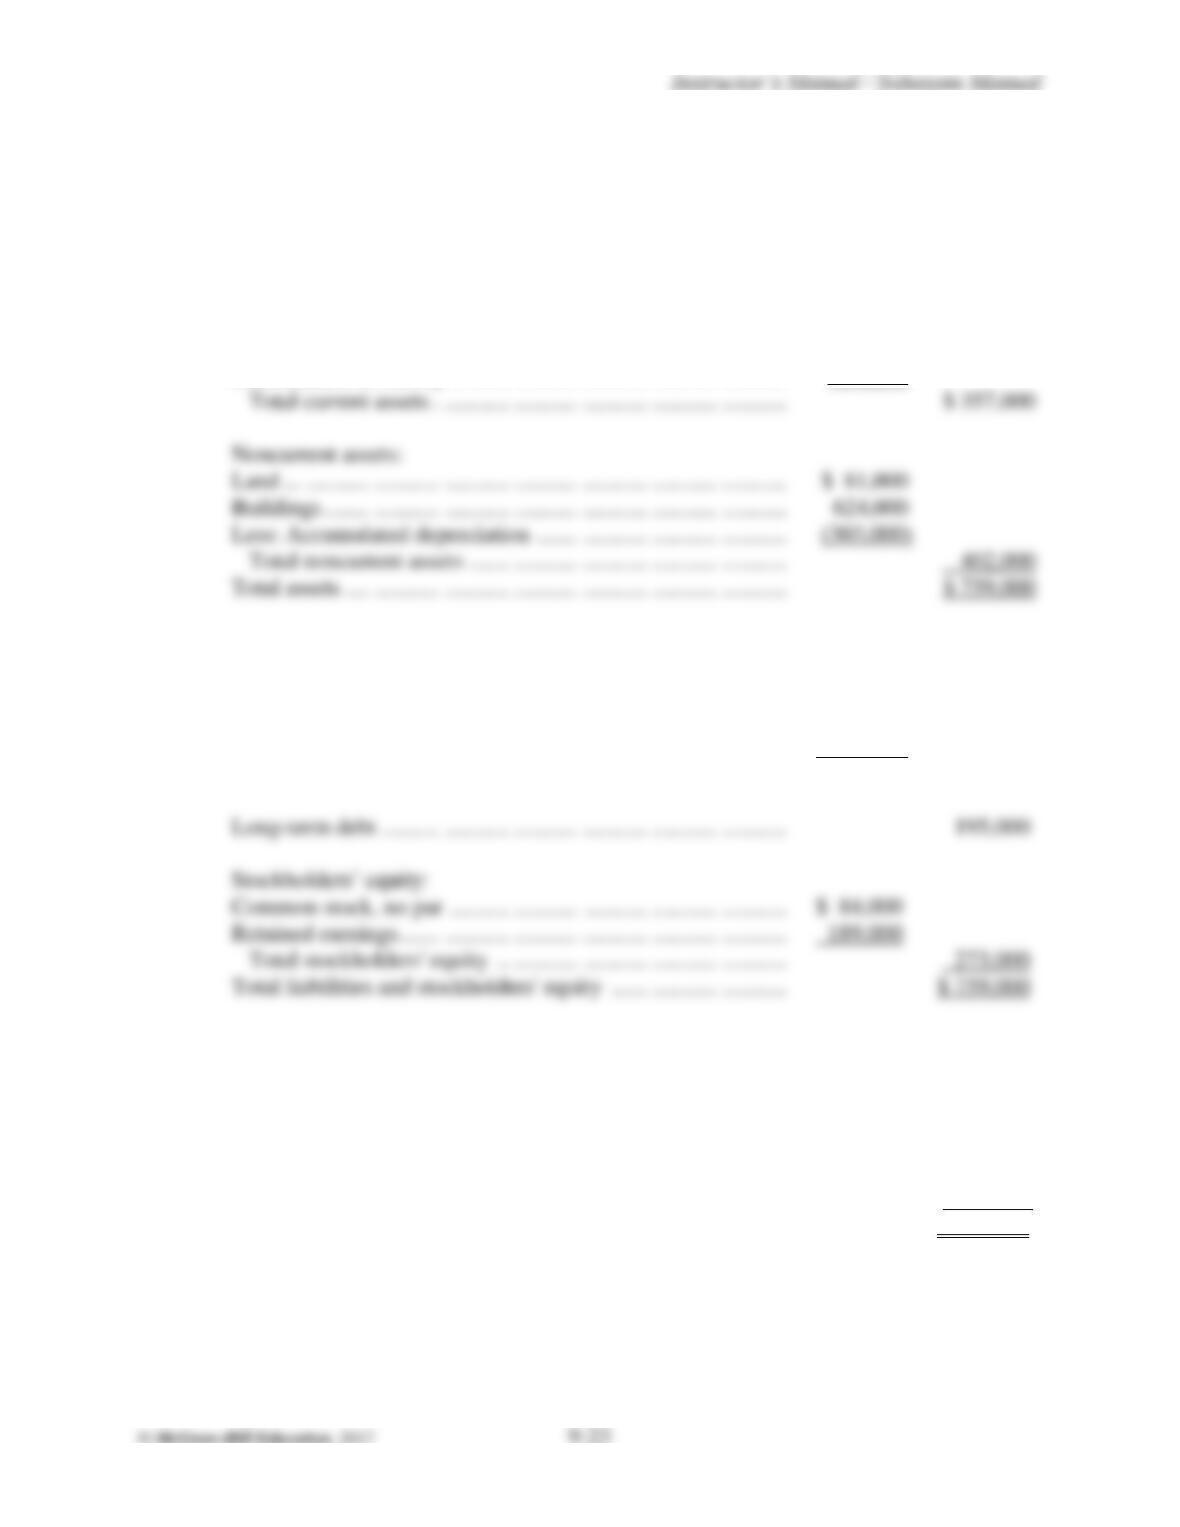
HARRIS, INC.
Balance Sheet
December 31, 2017
Assets:
Current assets:
Cash .. ........... ........... ........... ........... ........... ........... ........... $ 18,000
Accounts receivable ... ........... ........... ........... ........... ........... 201,000
Merchandise inventory .......... ........... ........... ........... ........... 138,000
b.
Liabilities and Stockholders’ Equity:
Current liabilities:
Accounts payable ...... ........... ........... ........... ........... ........... $ 183,000
Short-term debt .......... ........... ........... ........... ........... ........... 36,000
Notes payable . ........... ........... ........... ........... ........... ........... 72,000
Total current liabilities ........ ........... ........... ........... ........... $291,000
HARRIS, INC.
Statement of Changes in Retained Earnings
For the Year Ended December 31, 2017
Retained earnings, January 1, 2017 .. ........... ........... ........... ........... $165,000
Add: Net income for the year ........... ........... ........... ........... ........... 39,000
Less: Dividends for the year .. ........... ........... ........... ........... ........... (15,000)
Retained earnings balance, December 31, 2017 ....... ........... ........... $ 189,000
P9.30.
The strategy is to enter the amount of the change for each asset, liability, and
stockholders' equity item between the two dates. Each of these changes will be used in
the Statement of Cash Flows. (Note: Because the retained earnings section of the balance
sheet is, in and of itself, an analysis of the change in the retained earnings account for the
month, total net income and total dividends for the month of February are shown as
changes).
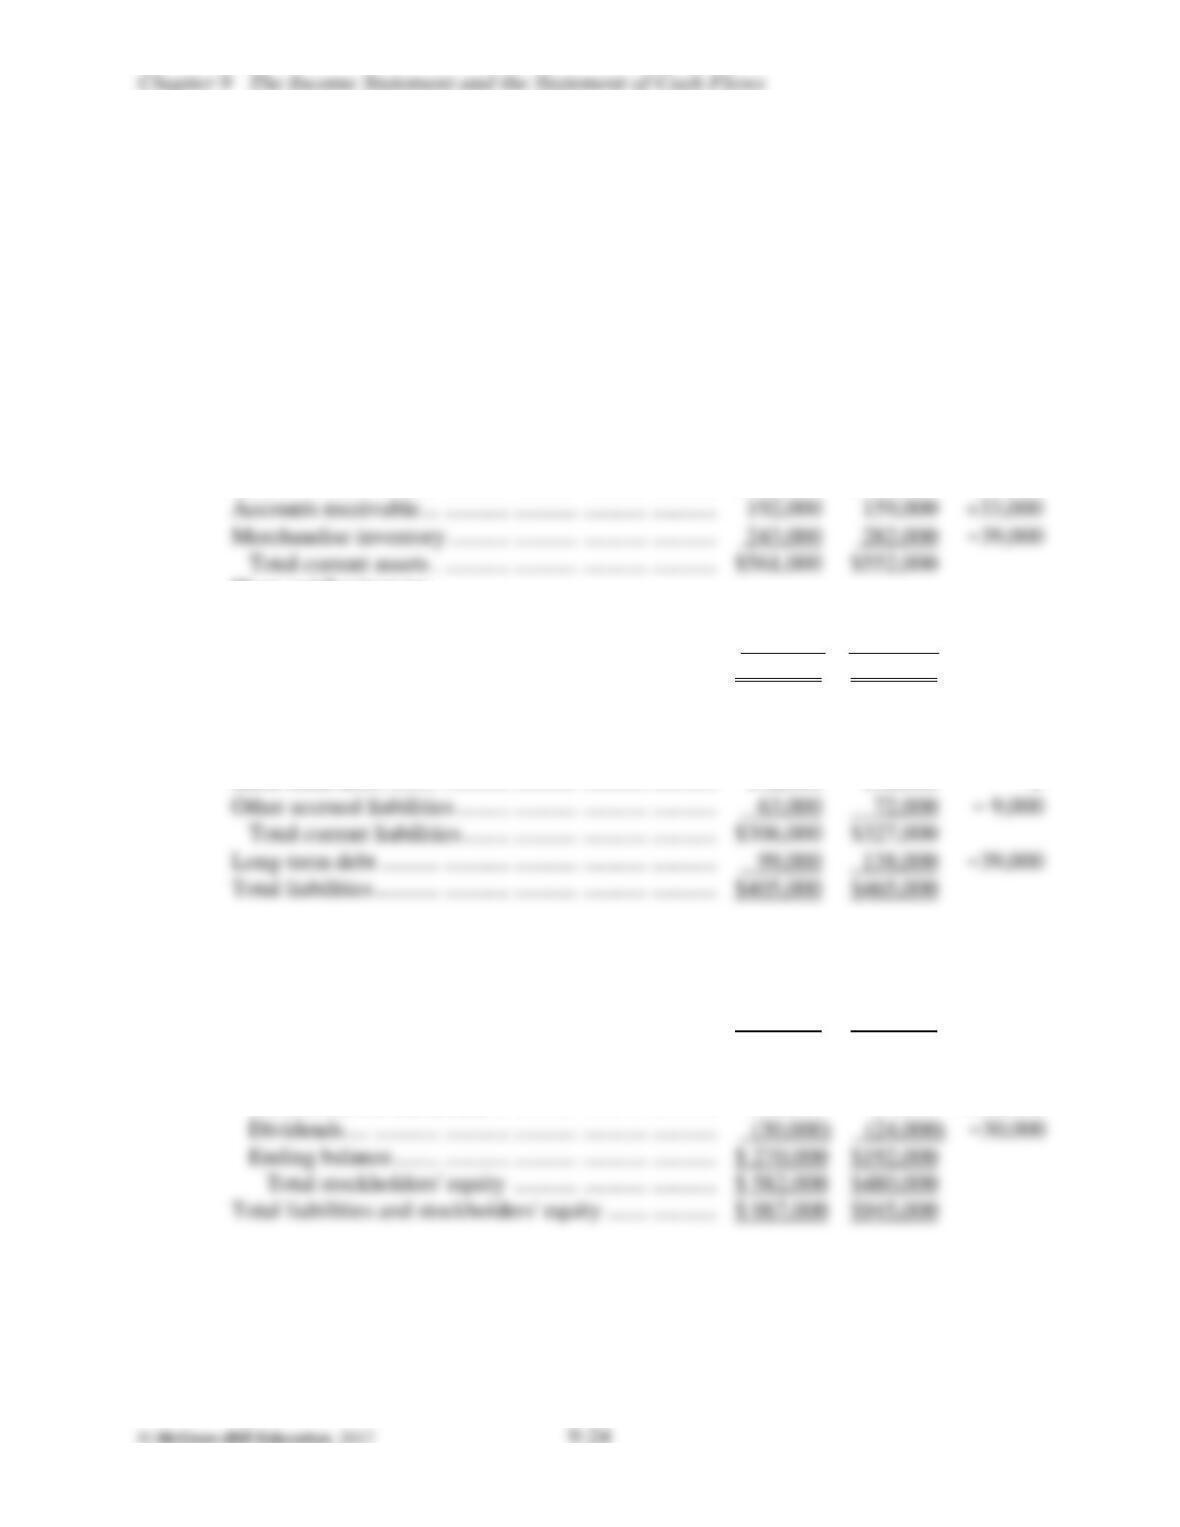
MILLCO, INC.
Balance Sheets
January 31 and February 28, 2017
Assets: Feb. 28 Jan. 31 Change
Cash ... ........... ........... ........... ........... ........... ........... $126,000 $111,000 +15,000
Plant and Equipment:
Production equipment ......... ........... ........... ........... $498,000 $456,000 +42,000
Less: Accumulated depreciation ..... ........... ........... (72,000) (63,000) -9,000
Total assets ..... ........... ........... ........... ........... ........... $987,000 $945,000
Liabilities:
Accounts payable ....... ........... ........... ........... ........... $111,000 $123,000 -12,000
Short-term debt .......... ........... ........... ........... ........... 132,000 132,000 0
Stockholders’ Equity:
Common stock, no par value, 80,000 shares
authorized, 60,000 and 56,000 shares issued,
respectively . ........... ........... ........... ........... ........... $312,000 $288,000 +24,000
Retained earnings:
Beginning balance... ........... ........... ........... ........... $192,000 $129,000
Net income for the month ... ........... ........... ........... 108,000 87,000 +108,000
P9.30.
(continued)
The statement of cash flows uses the changes between the two month-end balance sheets,
as illustrated below:
MILLCO, INC.
Statement of Cash Flows
For the Month Ended February 28, 2017
Cash flows from operating activities:
Net income ..... ........... ........... ........... ........... ........... ........... ........... $108,000
Add (deduct) items not affecting cash:
Depreciation expense .......... ........... ........... ........... ........... ........... 9,000
Cash flows from investing activities:
Purchases of production equipment ... ........... ........... ........... ........... (42,000)
Cash flows from financing activities:
Payment of long-term debt . ........... ........... ........... ........... ........... $(39,000)
C9.31. Answers will vary based on the annual report of the focus company selected.
C9.33.
a.
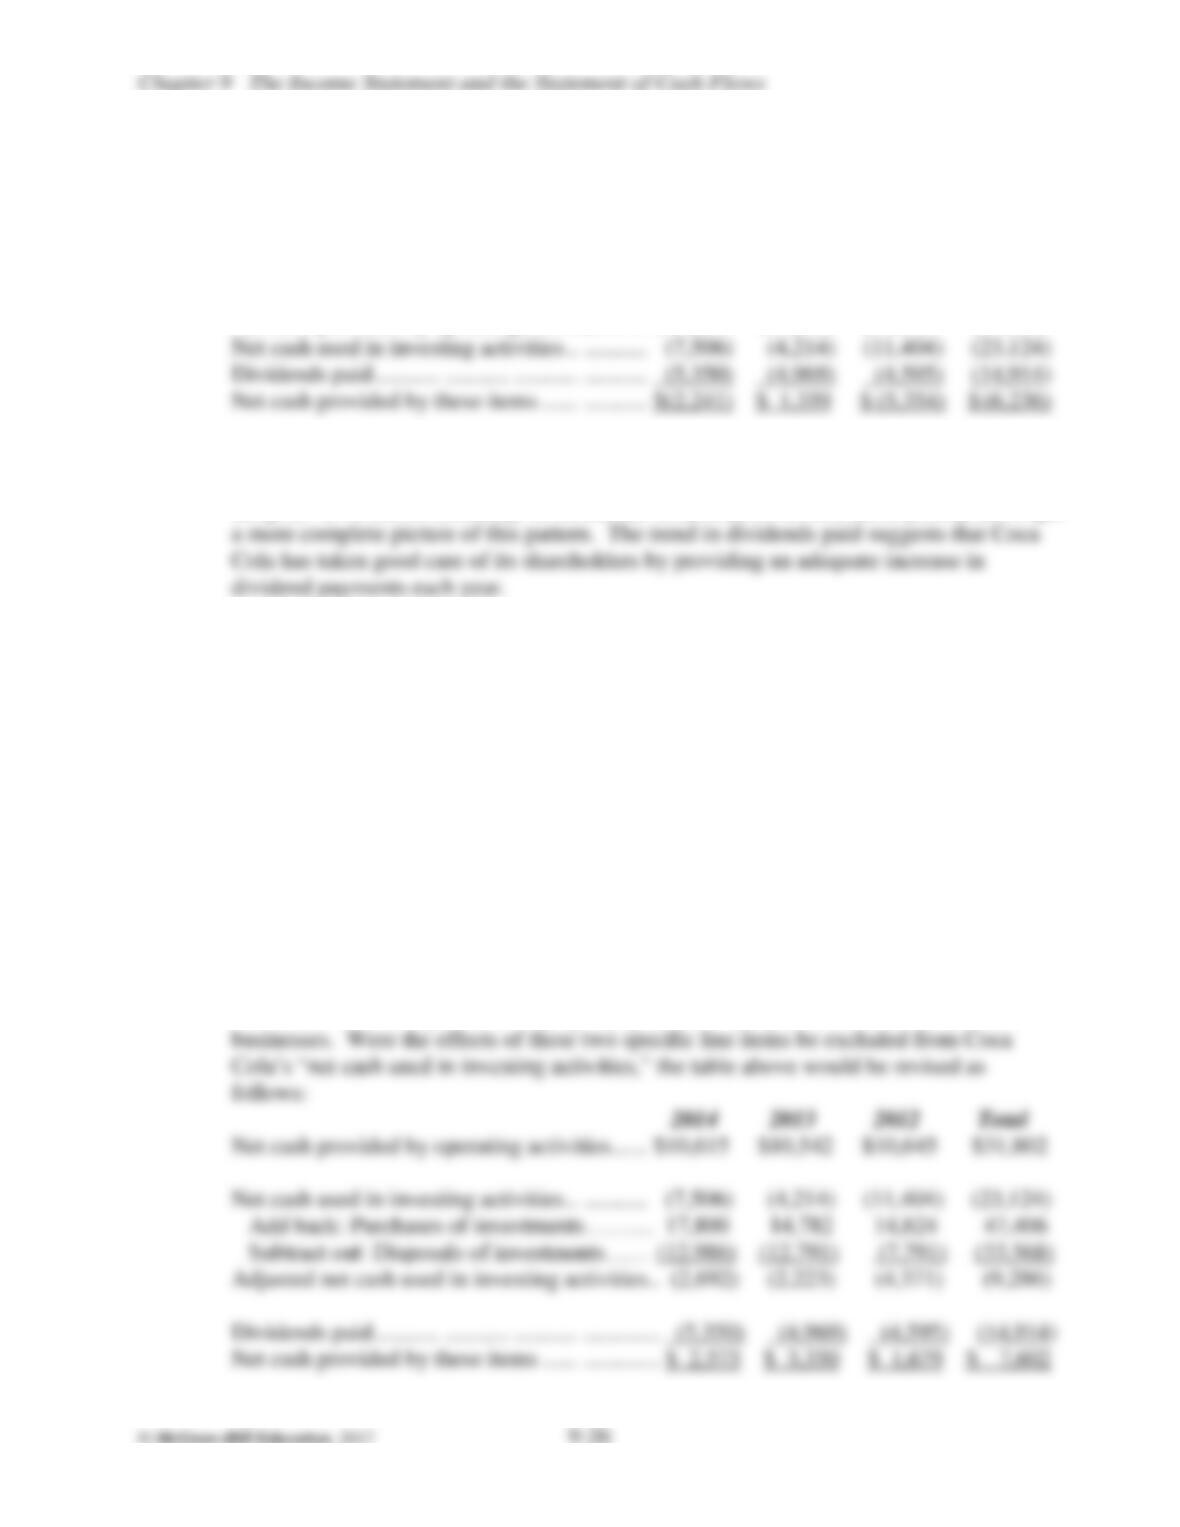
For 2013, net cash provided by operating activities exceeded net cash used in investing
activities and for the payment of dividends, although the same could not be said in 2012,
2014, or for the three year period in total, as seen in the following summary (amounts in
millions):
2014 2013 2012 Total
Net cash provided by operating activities ...... $10,615 $10,542 $10,645 $31,802
The trend in net cash provided by operating activities is quite stable, although it does not
necessarily suggest that a steady growth pattern is emerging, which of course would be
the goal. It would be necessary to extend the trend back to several more prior years to get
Net cash used in investing activities was unusually high in 2012 relative to 2013 and
2014. Possible reasons for this pattern may be offered or hinted at elsewhere within the
annual report, most likely within the management discussion and analysis section.
It should also be noted that Coca Cola’s investing activities include rather large dollar
amounts each year for the “Purchases of investments” and for the “Proceeds from the
disposals of investments.” These types of cash flow transactions relate to short-term
investment activities that are essentially an extension of Coca Cola’s working capital
management efforts. In many ways, the purchase and sale of short-term investments are
as “operating” in nature as they are “investing” in nature.
As a result, although such transactions are properly classified within the investing
activities section of the Statement of Cash Flows, many financial analysts may choose to
exclude them when assessing the company’s long-term investing cash flow requirements
for items such as the purchase of property, plant, and equipment, or the acquisition of
C9.33.
a.
(continued)
Note that as a result of making these optional adjustments to the “net cash used in
investing activities” subtotal from the Statement of Cash Flows, the “big picture” is that
b.
The following observations can be made by quickly reviewing the data for the three-year
period presented:
Coca-Cola was a net purchaser of short-term investments in each year presented.
The amount of cash used for acquisitions and equity method investments was more
substantial in 2012 than in 2014, and the proceeds from the disposal of businesses and
Purchases of property, plant, and equipment decreased slightly each year, reflecting
the mature nature of a company such as Coca Cola that is no longer in a high growth
stage. This would normally be regarded as a sign of financial success and stability,
particularly if this trend were to generally hold true over a longer period of time such
C9.33.
b.
(continued)
Purchases of treasury stock were significant each year, which is likely to reflect
management’s increased concern with Coca Cola’s stock price trading range during
2012-2014 period. Many companies have stock repurchase plans whereby treasury
stock transactions are used programmatically to help support their common stock
price. There are other solid reasons for entering into treasury stock transactions, but
The negative effect caused by exchange rates in all years presented (especially in
2014) was due to the relatively strong U.S. dollar, which is Coca Cola’s reporting
currency.
An effort should be made to identify the underlying reasons for the above noted trends
Instructor’s Manual / Solutions Manual
TAKE-HOME QUIZ: CHAPTER 9 NAME______________________
(Author's note: Select an appropriate annual report and distribute financial statements to
students, and use or adapt the following questions.)
These questions relate to the accompanying Consolidated Statements of Income and
Consolidated Statements of Cash Flows.
1. Study the income statement, and note the captions that are used. Contrast the format of
this statement with that used by Campbell Soup Company. What are the captions of the
intermediate profit amounts reported by this company that are not reported by Campbell’s?
2. Assume that cost of goods sold for this company is the sum of the material, labor, and other
3. Assuming that this firm has experienced increases in its production costs (e.g., increases in
4. Assume that this firm is developing a new version of its product, and that cost analysts have
estimated that the new version will cost $0.64 to make. What selling price will be set for this
item if management desires to have the same gross profit ratio on the new item as on items
presently being made and sold?
5. Assume that the interest rate incurred by this firm on the money it has borrowed by issuing
6. Calculate the average number of shares of common stock outstanding during each of the past
three fiscal years.
8. Draw a T-account for the Accounts Receivable account. Assume that the balance of
accounts receivable at the end of fiscal 20xx, was $xxx,000. Using the appropriate data from


