C5.38.
a.
b.
(continued)
Notice that the order in which Pearson lists its current assets (from least “liquid”
to most liquid) is the opposite of what you would expect based on U.S. generally
accepted accounting standards. In fact, Pearson also lists its noncurrent assets
before its current assets, which is a common practice in many countries. John
Wiley & Sons, a U.S.-based corporation, must present its financial statement data
in accordance to U.S. GAAP, as established by the FASB and its predecessors.
You may have noticed some differences in the terminology used by Pearson as
compared to Wiley’s more familiar (U.S.-based) terminology. As an example,
Pearson’s “Financial Assets—Marketable Securities” means the same thing as
“Short-term Investments” used by many U.S.-based companies (although Wiley
does not report any short-term investments).
Were you to review Pearson’s annual report, you would see that we’ve taken
some liberties in the presentation of its data. For example, the description
provided for the “Trade and other receivables” caption beginning with the word
Similarly, we’ve excluded one of Pearson’s current assets (“Intangible Assets—
Pre-Publication”) from the data presented in this case because John Wiley & Sons
(under U.S. GAAP) does not treat such items as current assets. We have also
Note to the instructor: Strictly speaking, no calculations are necessary for this
requirement. However, they can certainly be helpful, so some calculations are provided
below for illustration purposes. The first impressions most students should have (based
on a quick scan of the data presented) are as follows:
Note that Pearson’s total current assets remained approximately the same £2.1
billion in both years (just a 2% overall decrease), while John Wiley & Sons’ total
current assets increased substantially from approximately $635 million to $780
million (a 24% increase).
C5.38.
b.
(continued)
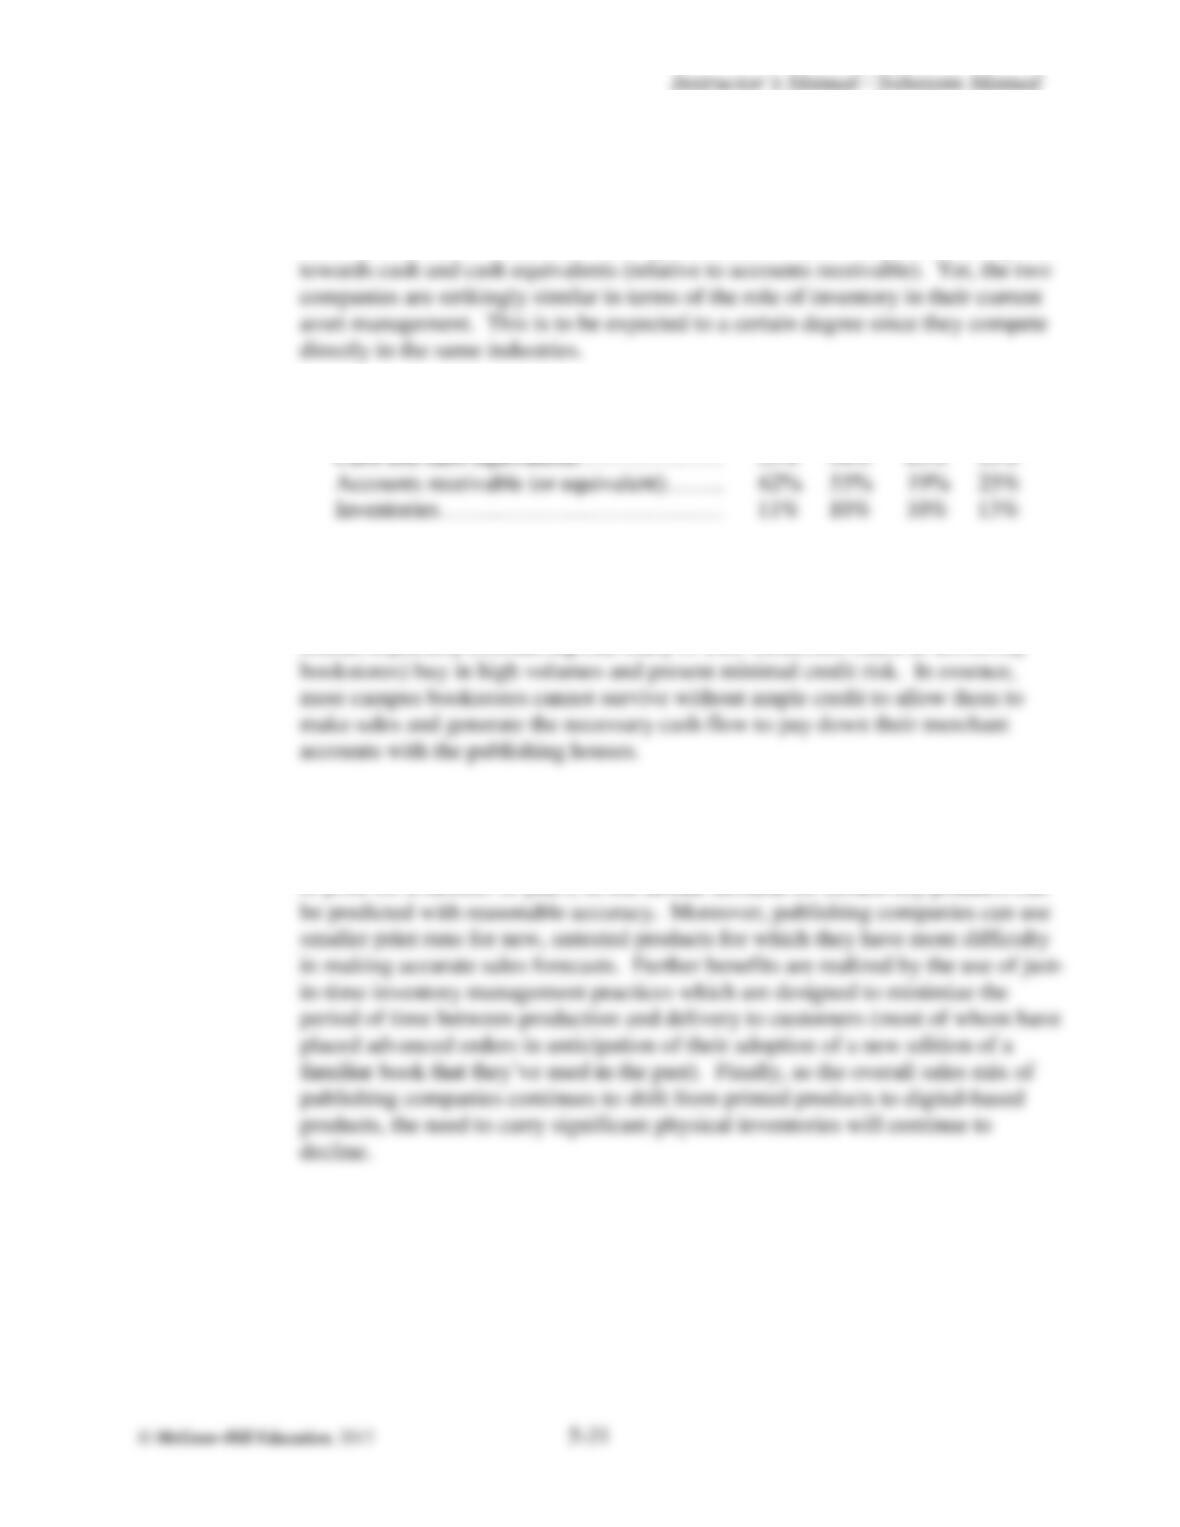
As a percentage of total current assets, Pearson has a strong bias towards accounts
receivable (relative to cash and cash equivalents) whereas Wiley has a strong bias
Pearson Wiley
2014 2013 2014 2013
It is not surprising that both companies have their largest concentration of current
assets in cash and cash equivalents and trade accounts receivables. With respect
to receivable, credit terms for major publishing companies tend to be somewhat
liberal, especially considering that many of their customers (such as university
As a percentage of total current assets, inventories are not nearly as significant as
receivables for either company. In educational publishing, inventory management
is a relatively straight-forward process. Most market-leading textbooks have been
in print for a number of years, so the annual demand for certain key products can
C5.38.
c.
(continued)
The analysis below suggests that Pearson seems to do an overall better job at
managing its accounts receivables and inventory that does John Wiley & Sons:
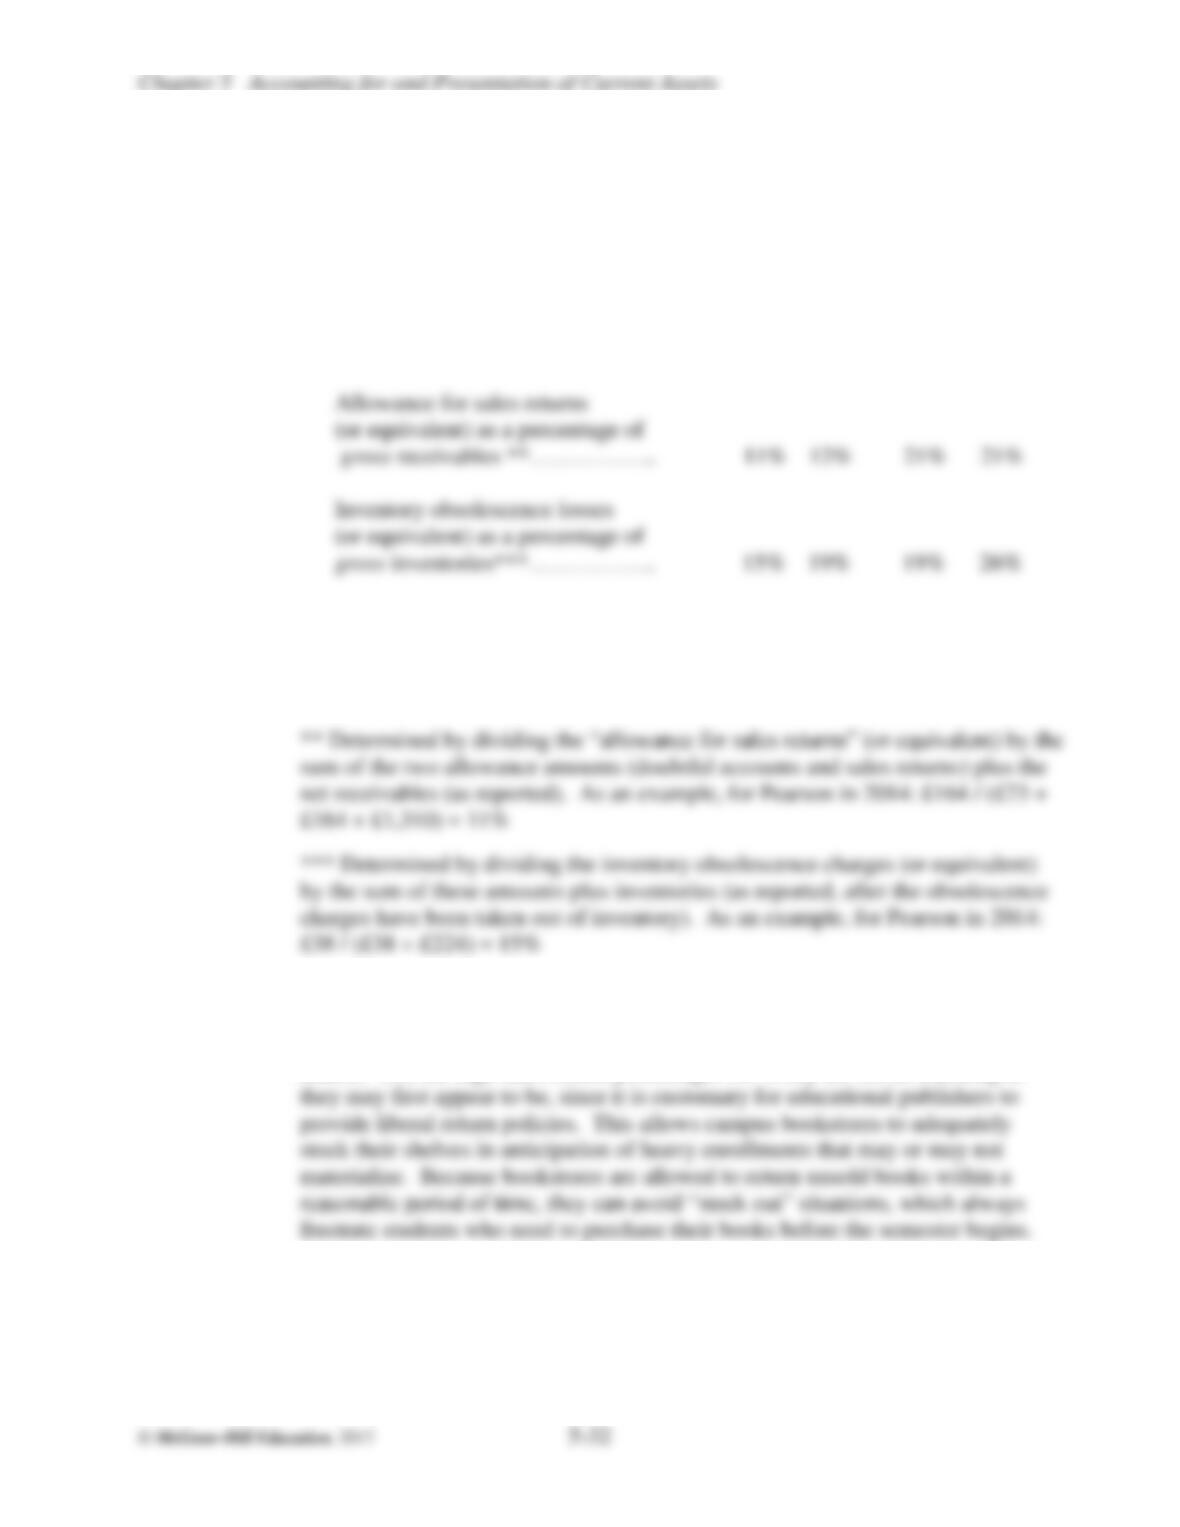
Pearson Wiley
2014 2013 2014 2013
Allowance for doubtful accounts
(or equivalent) as a percentage of
gross receivables *……………… 5% 4% 4% 3%
* Determined by dividing the “allowance for doubtful accounts” (or equivalent)
by the sum of the two allowance amounts (doubtful accounts and sales returns)
plus the net receivables (as reported). As an example, for Pearson in 2014: £73 /
(£73 + £164 + £1,310) = 5%
Note that Pearson’s allowance for doubtful accounts as a percentage of gross
receivables is slightly higher than that of John Wiley & Sons in both years, but
this is greatly offset by Pearson’s substantially better results in terms of sales
returns. Yet, the high sales return percentages for Wiley are not as alarming as
Pearson also incurred proportionately fewer inventory obsolescence losses than
did Wiley in both years, suggesting that Pearson does a better job at anticipating
(budgeting) future sales quantities and monitoring its inventory levels to avoid
overstocking print materials whenever possible.
Instructor’s Manual / Solutions Manual
TAKE HOME QUIZ—CHAPTER 5 Name____________________________
A. Accounts Receivable
1. This question is designed to help you reason through the transactions related to accounting
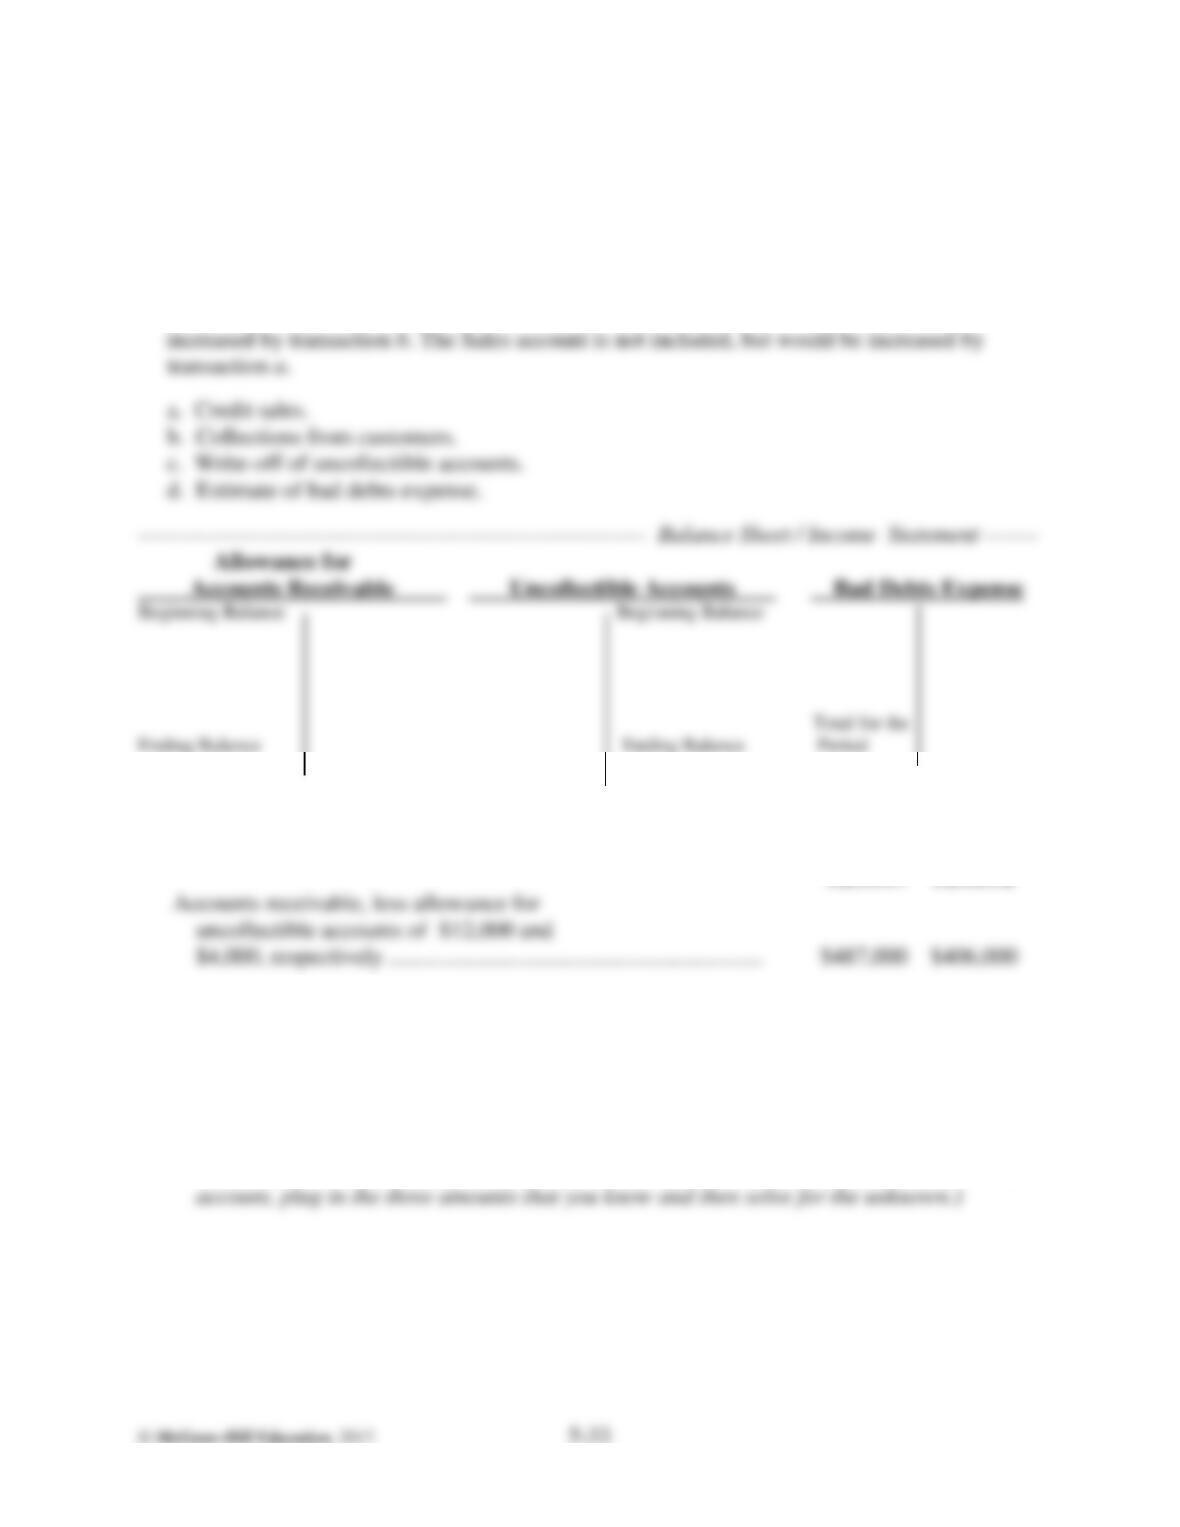
for accounts receivable. For each of the transactions described below (items a-d), enter the
effects of the transaction on the appropriate side (debit or credit) of the T-accounts affected.
Note that the Cash account is not included in the T-accounts shown below, but would be
2.. The remaining questions relate to the following presentation in the balance sheets of HiROE Co.
at December 31, 2017 and 2016:
12/31/17 12/31/16
a. Describe how the allowance amount at December 31, 2017 was most likely determined.
b. If the bad debt expense for 2017 totaled $14,000, what was the amount of accounts
receivable written off during the year? (Hint: Using the T-account model of the allowance
Chapter 5 Accounting for and Presentation of Current Assets
TAKE HOME QUIZ—CHAPTER 5 (continued)
2. c. The December 31, 2017 allowance account balance includes $3,500 for a past due account
1. Working capital at December 31, 2017?
2. Net income and ROI, for the year ended December 31, 2017?
d. What do you suppose was the level of HiROE’s sales in 2017, compared to 2016?
B. Inventories
1. This question is designed to help you reason through the transactions related to accounting
for inventories. For each of the transactions described below (items a and b), enter the effects of
the transaction on the appropriate side (debit or credit) of the T-accounts affected. Note that the
Cash and Accounts Payable accounts are not included in the T-accounts shown below, but
would be credited for the expenditures involved in transaction a.
a. Cost of items purchased or made.
b. Cost of items sold.
———————— Balance Sheet / Income Statement ————————
Inventory Cost of Goods Sold
Beginning Balance
Ending Balance Total for the Period
Instructor’s Manual / Solutions Manual
TAKE HOME QUIZ—CHAPTER 5 (continued)
2. Assume that the company does not keep track of the physical items sold and does not record the
cost of an item sold at the same time that the sale is recorded. Assume also that the company
3. If the beginning balance of the inventory account and the cost of items purchased or made
during the period were correct, but an error resulted in understating the firm’s ending inventory
balance by $4,000, would the firm’s net income be affected? If your answer is “yes,” explain
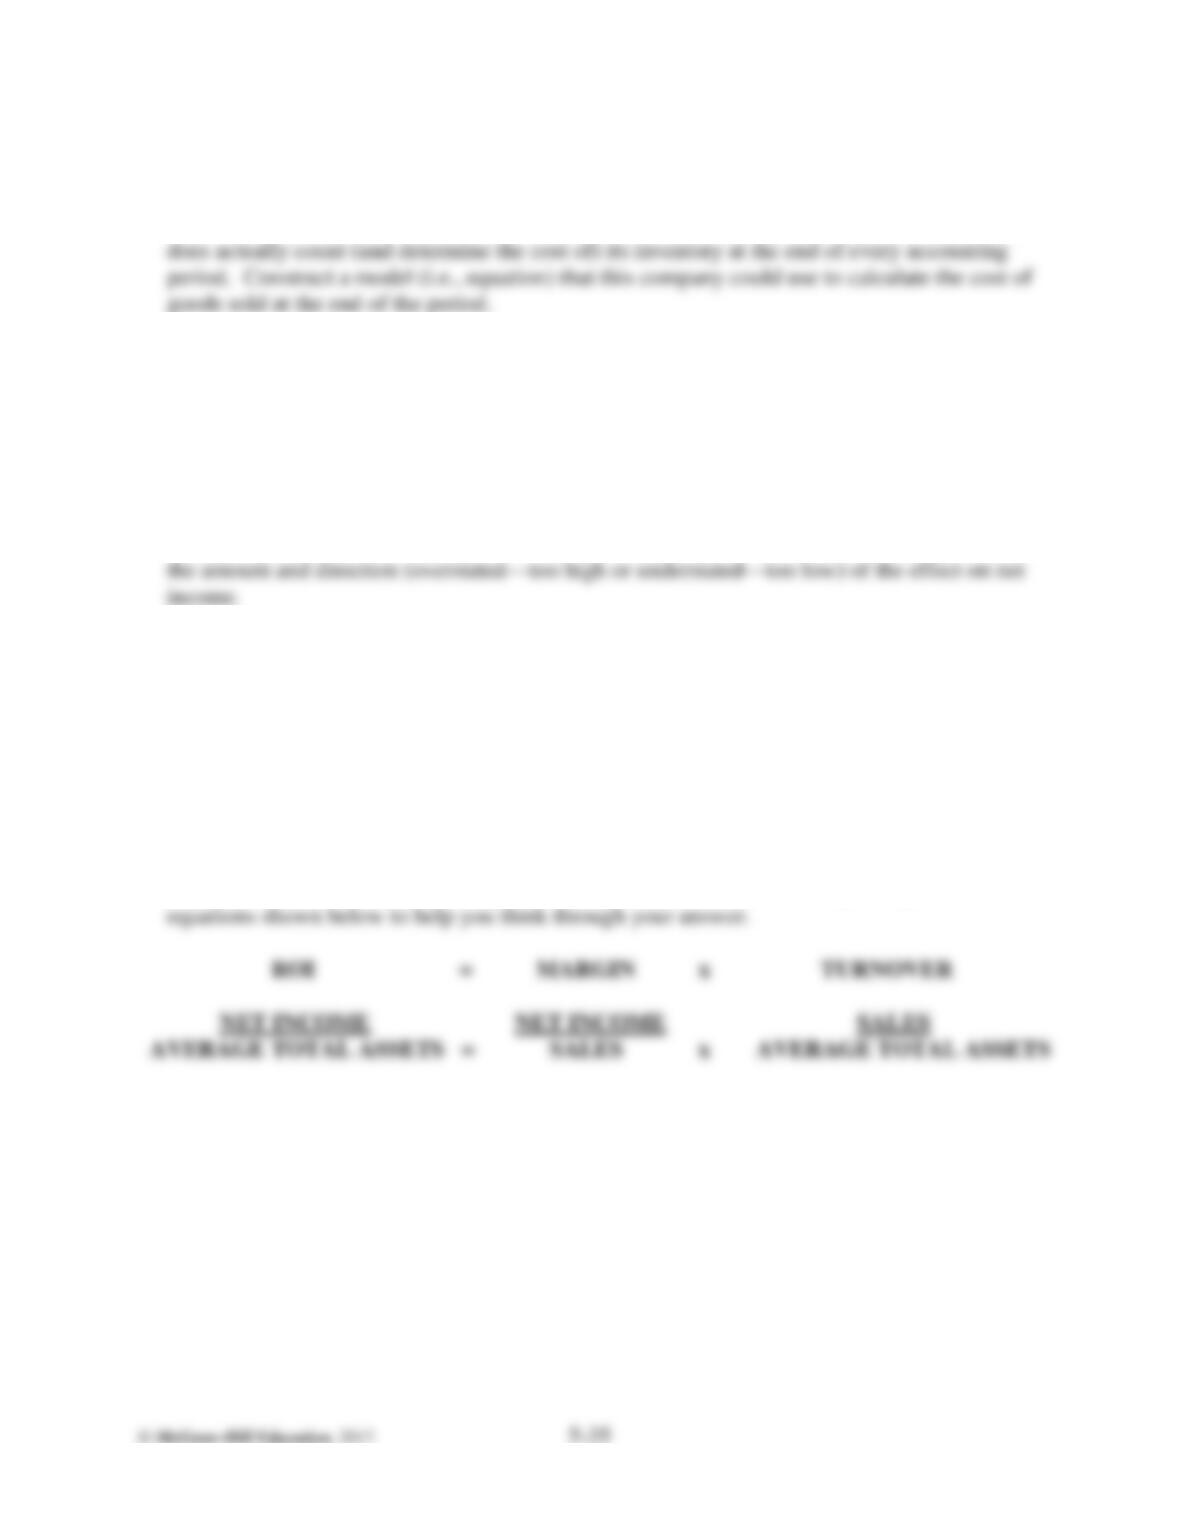
4. Assume that the purchase or manufacturing cost of inventory items has been rising over a period
of time and that the LIFO cost flow assumption has been used. Would the firm’s margin,
turnover, and ROI have been higher or lower than they would have been under the FIFO cost
flow assumption? Consider the impact on margin, turnover, and ROI separately, and use the
Chapter 5 Accounting for and Presentation of Current Assets
TAKE HOME QUIZ KEY—CHAPTER 5
A. Accounts Receivable
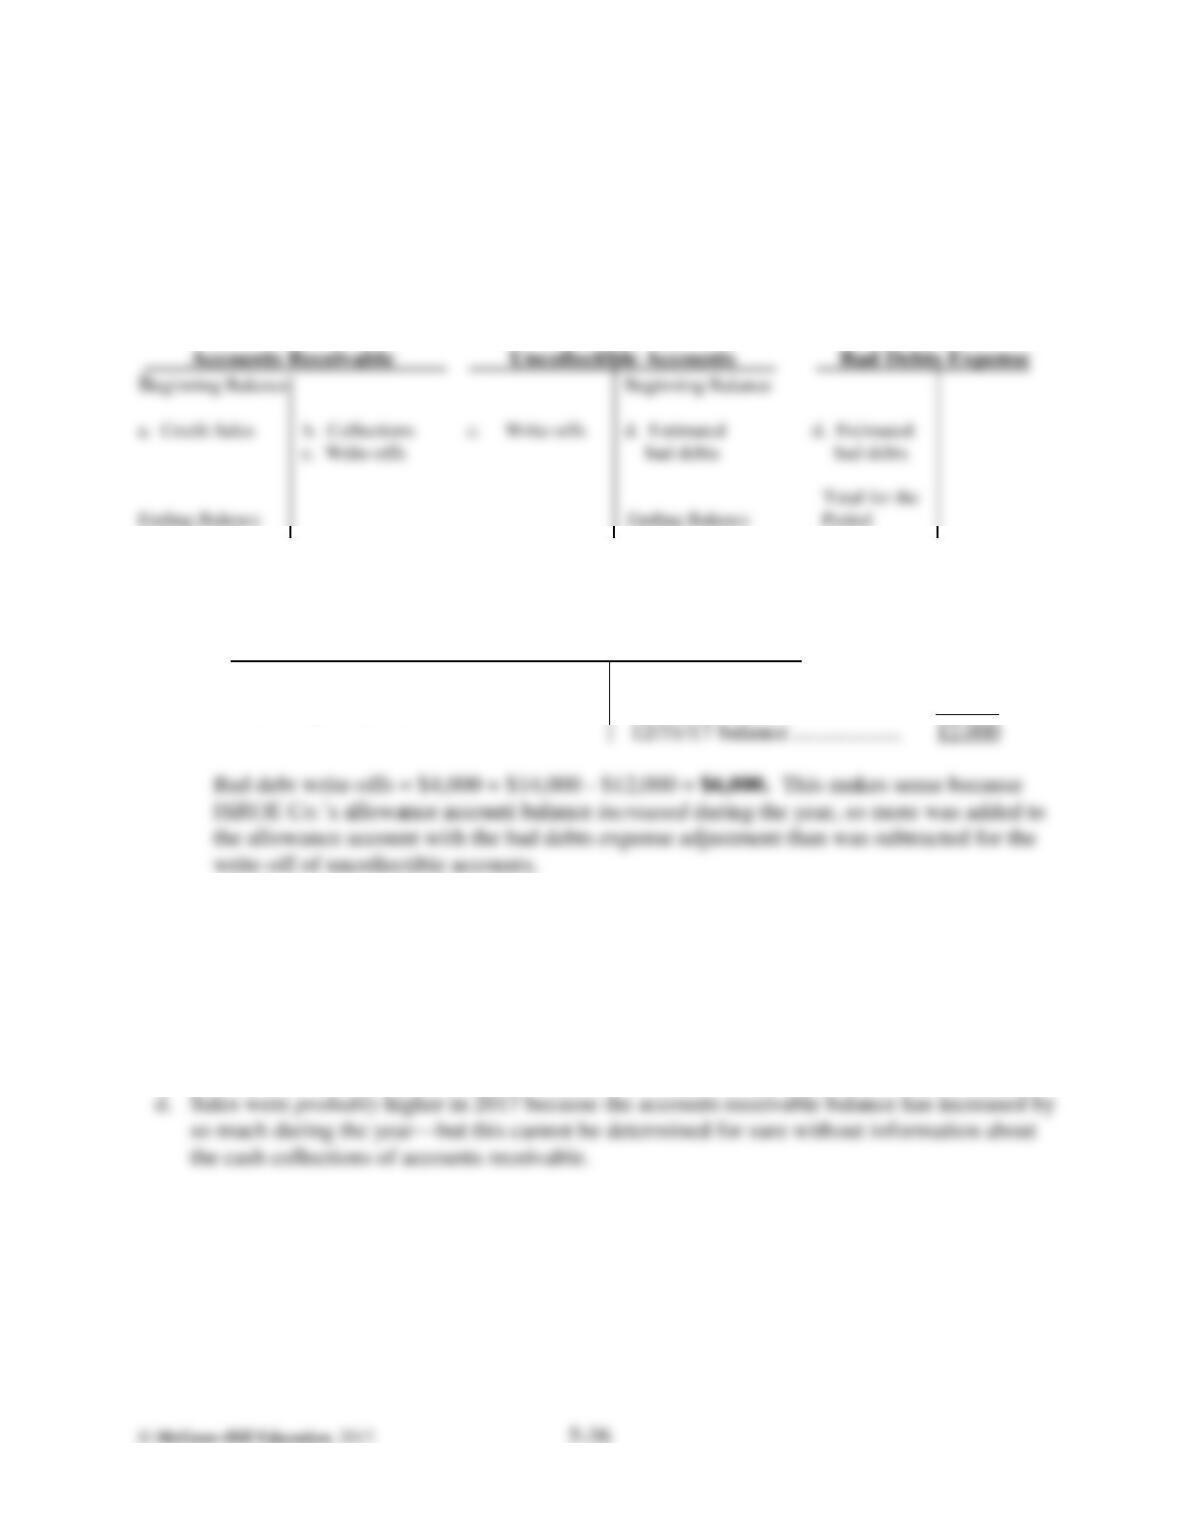
1. ————————————-————————- Balance Sheet / Income Statement ——–
Allowance for
2. a. A detailed analysis of the accounts receivable at year-end.
Allowance for Uncollectible Accounts
b. Bad debt write-offs 12/31/16 balance ………………. 4,000
(during the year)………. ? Bad debt expense ……………… 14,000
c. 1. Working capital would not be affected because the write-off entry decreases both the
accounts receivable asset and the allowance account contra-asset by equal amounts.
2. Net income would not be affected by the write-off entry because it does not adjust any
expense or revenue accounts. ROI would not be affected because net income and total
assets are not changed.
Instructor’s Manual / Solutions Manual
TAKE HOME QUIZ KEY—CHAPTER 5 (continued)
B. Inventories
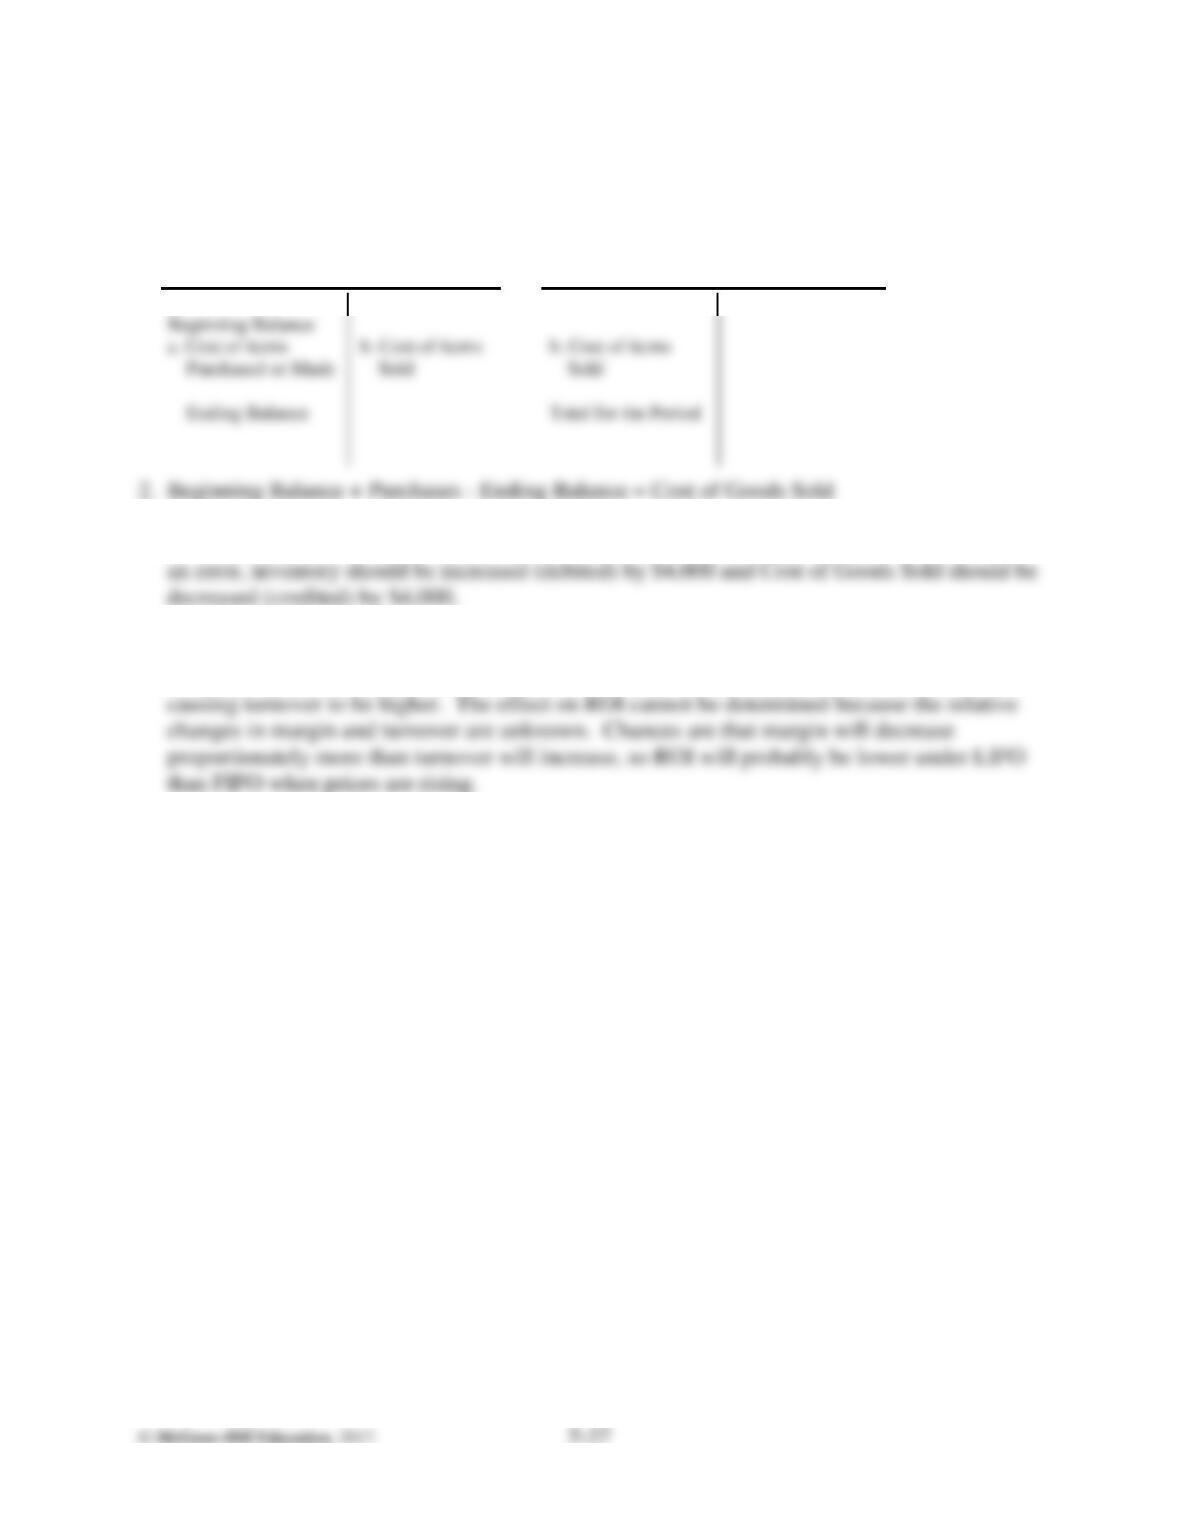
1. ————————— Balance Sheet / Income Statement ————————
Inventory Cost of Goods Sold .
proportionately more than turnover will increase, so ROI will probably be lower under LIFO
than FIFO when prices are rising.
3. Yes, net income is affected. Net income is understated (too low) by $4,000. To correct such
4. If cost of goods sold is overstated, net income is understated. The lower net income causes
margin to be lower. Inventory will have lower costs, so the average total assets will be lower,