Instructor’s Manual / Solutions Manual
P5.27.
(continued)
b.
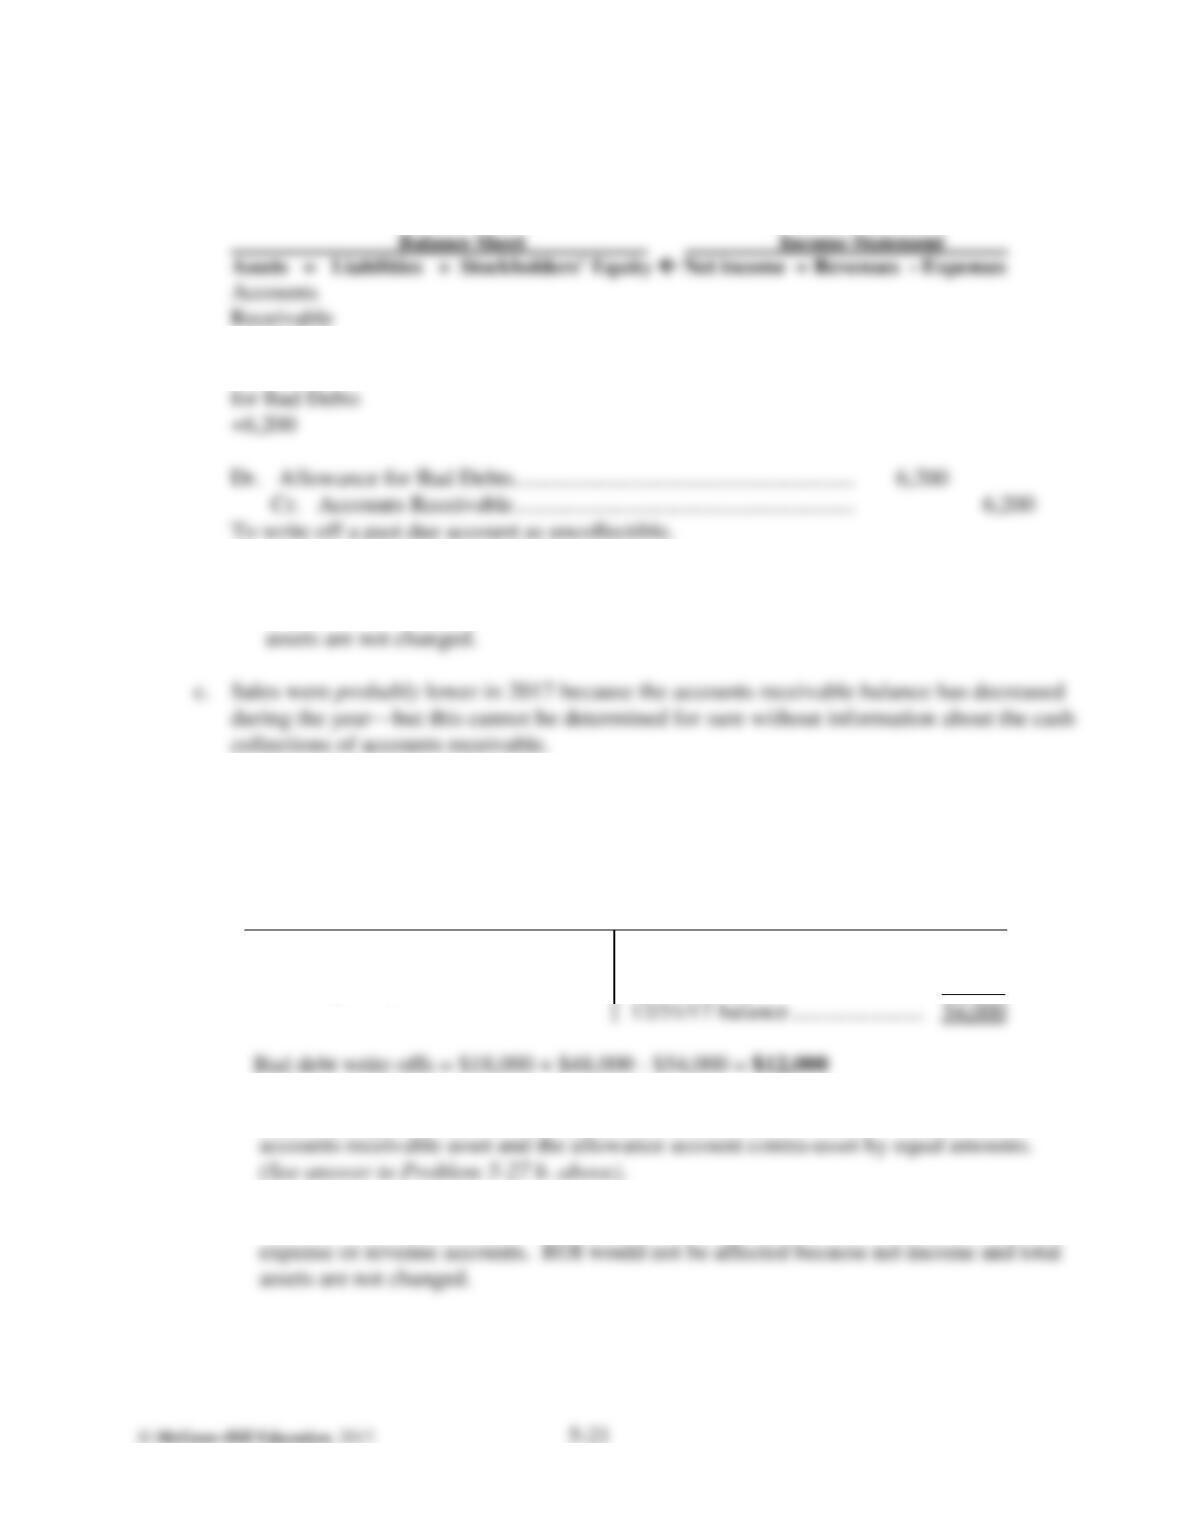
1. Working capital would not be affected because the write-off entry decreases both the
accounts receivable asset and the allowance account contra-asset by equal amounts.
Dr. Allowance for Bad Debts ………………………………………………….. 6,200
Cr. Accounts Receivable ………………………………………………….. 6,200
-6,200
Allowance
Sales were probably lower in 2017 because the accounts receivable balance has decreased
during the year—but this cannot be determined for sure without information about the cash
2. Net income would not be affected by the write-off entry because it does not adjust any
expense or revenue accounts. ROI would not be affected because net income and total
P5.28.
a.
b.
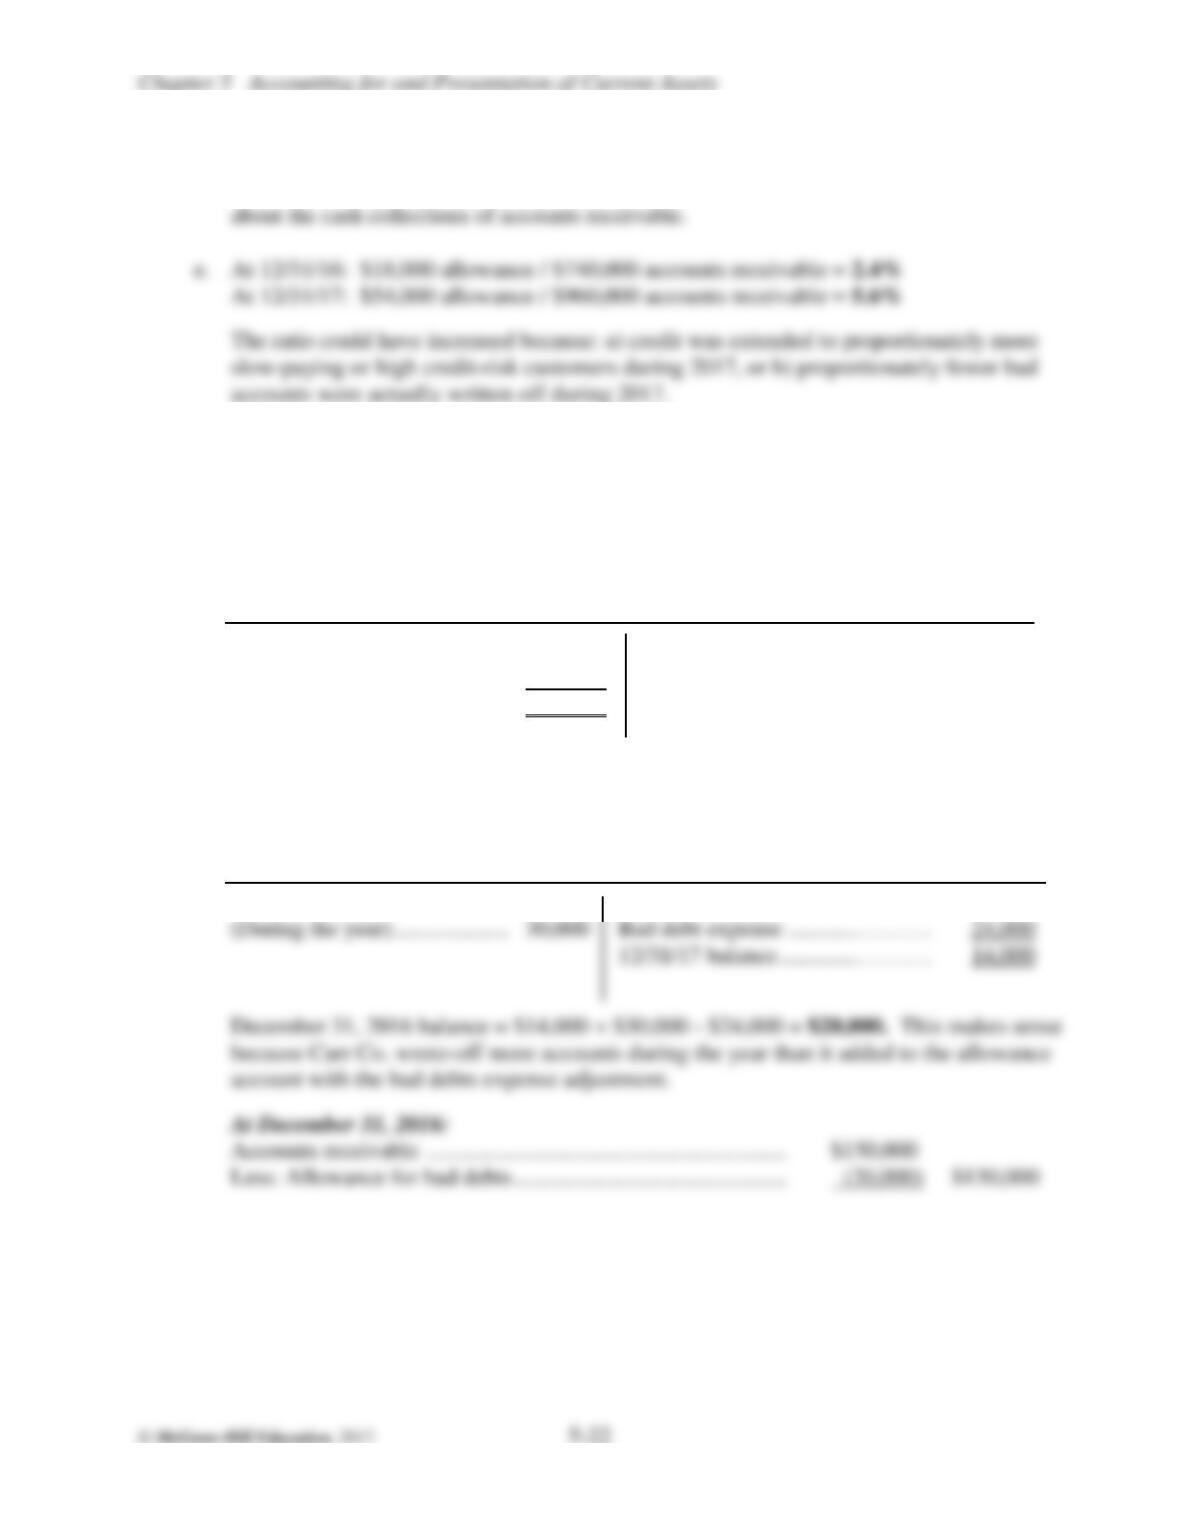
An analysis of an aged trial balance of accounts receivable is the most accurate way of
determining the appropriate allowance account balance.
Allowance for Uncollectible Accounts
Bad debt write-offs 12/31/16 balance ………………….. 18,000
(during the year). . . . . . . . ? Bad debt expense …………………. 48,000
c.
1. Working capital would not be affected because the write-off entry decreases both the
2. Net income would not be affected by the write-off entry because it does not affect any
P.5.28.
(continued)
d.
Sales were probably higher in 2017 because the accounts receivable balance has
increased during the year—but this cannot be determined for sure without information
P5.29.
Solution approach: Net realizable value = Accounts receivable – Allowance for bad
debts. The balance sheet presentation of this information at December 31, 2017 (ending
balances) is provided with the problem information. Your task is to work backwards to
determine the balances in these accounts at December 31, 2016 (beginning balances).
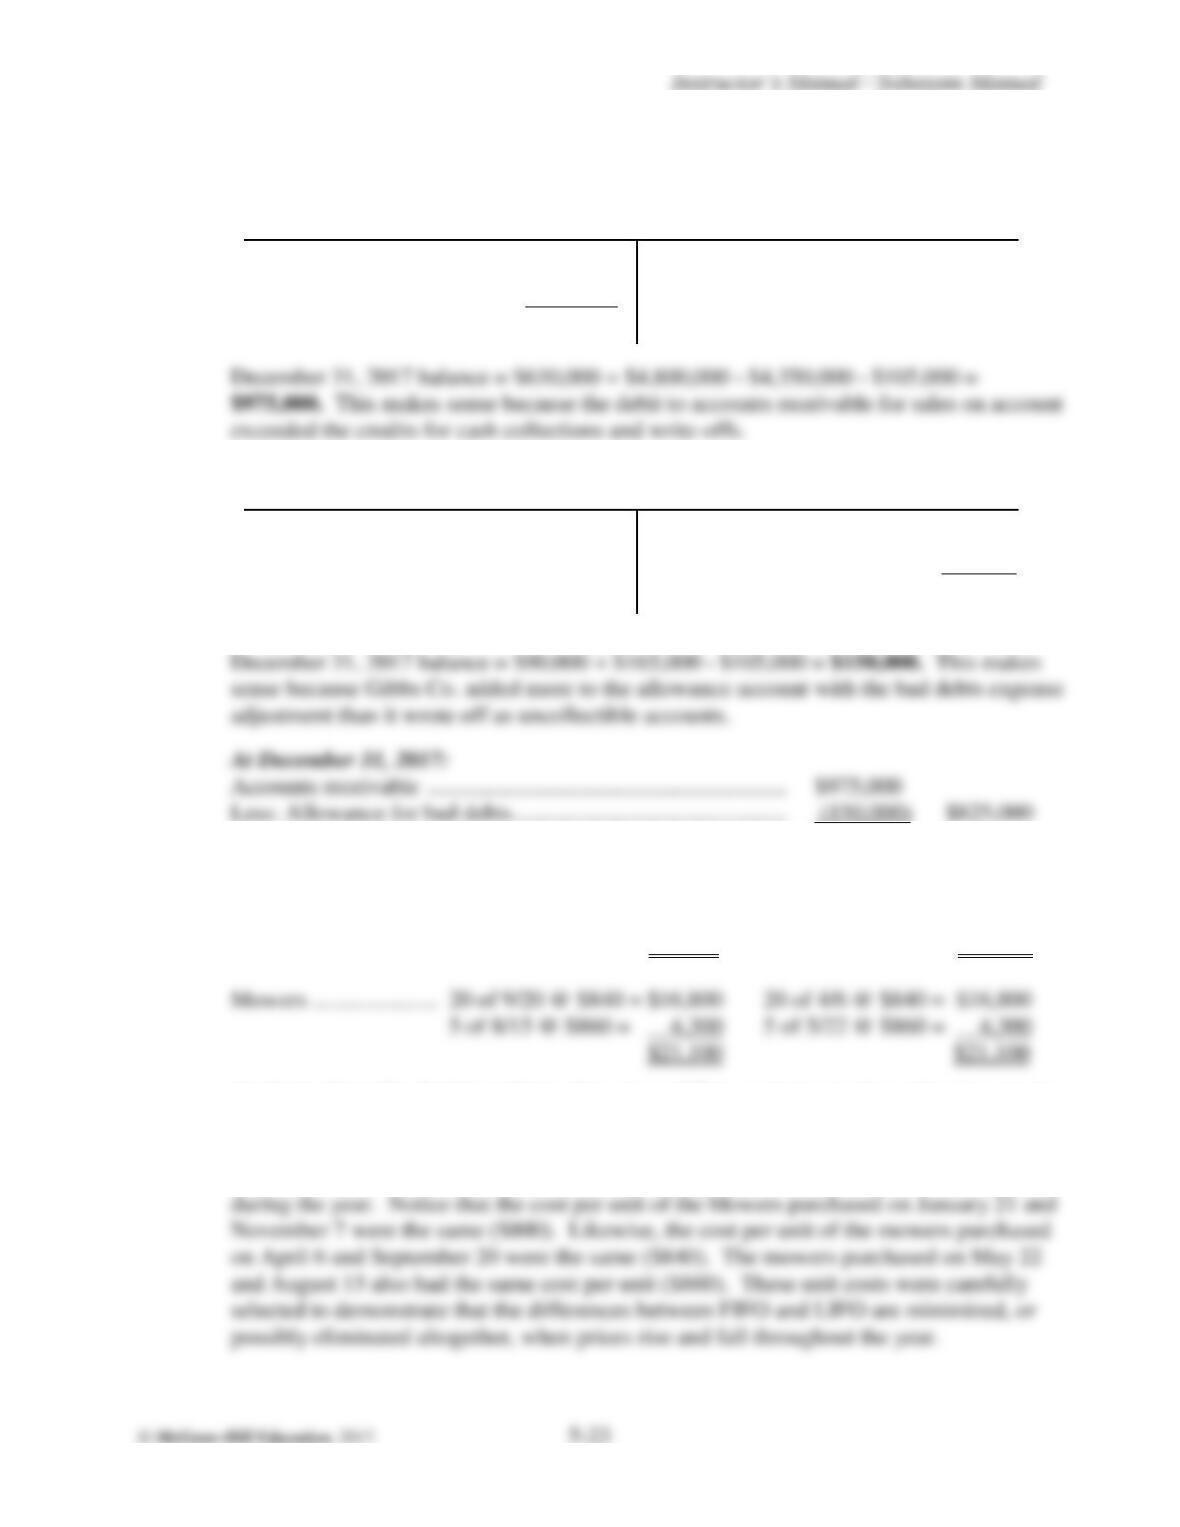
Accounts Receivable
12/31/16 balance ……………….. ? Cash collections …………………. 820,000
Sales on account ………………… 800,000 Accounts written off ………… 30,000
12/31/17 balance ……………….. 100,000
December 31, 2016 balance = $820,000 + $30,000 – $800,000 + $100,000 = $150,000.
This makes sense because the credits to accounts receivable during the year for cash
collections and write-offs exceeded the debit for sales on account.
Allowance for Bad Debts
Bad debt write-offs 12/31/16 balance ………….………. ?
P5.30.
Emphasize: Net realizable value = Accounts receivable – Allowance for bad debts.
Accounts Receivable
12/31/16 balance …………….. 630,000 Cash collections …….. 4,350,000
Sales on account ……………… 4,800,000 Accounts written off . 105,000
12/31/17 balance …………….. ?
Allowance for Bad Debts
Bad debt write-offs 12/31/16 balance ……………… 90,000
(during the year). . . . . . . . . 105,000 Bad debt expense ……………. 165,000
12/31/17 balance ……………… ?
P5.31.
a.
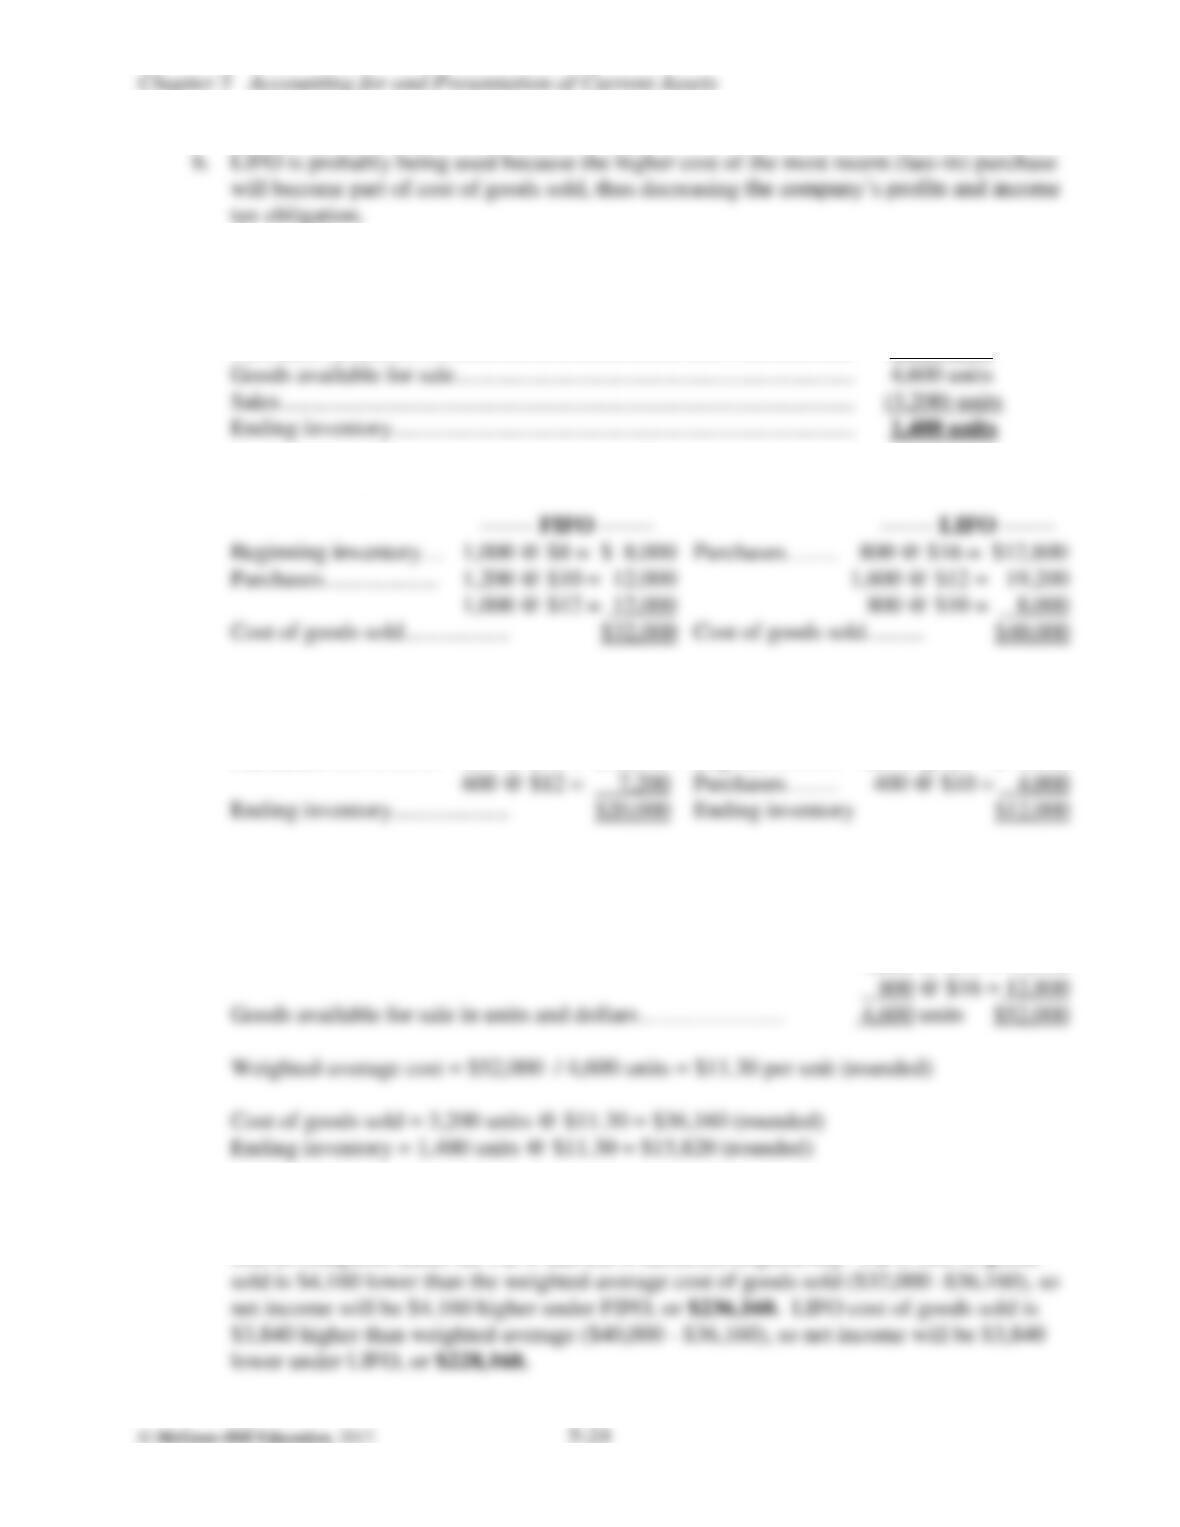
Ending inventory calculations:
——— FIFO ———- ———- LIFO ———-
Blowers …………………. 10 of 11/7 @ $800 = $ 8,000 10 of 1/21 @ $800 = $ 8,000
Analysis of results: In this problem, there is no difference between the ending inventories
amounts under FIFO and LIFO; thus there won’t be any difference between cost of goods
sold under either alternative. Why isn’t ending inventory affected by the inventory cost
flow assumption used? Look carefully at the cost per unit of inventory items purchased
P5.31.
(continued)
P5.32.
a.
Calculation of ending inventory in units:
Beginning inventory………………………………………………………………… 1,000 units
Purchases (total) ……………………………………………………………………… 3,600 units
Calculation of cost of goods sold amounts:
Calculation of ending inventory amounts:
——- FIFO ——- ——- LIFO ——-
Purchases……………….. 800 @ $16 = $12,800 Beg. Inv ..……. 1,000 @ $8 = $ 8,000
Weighted-average calculations:
Beginning inventory……………………………………………………… 1,000 @ $8 = $ 8,000
Purchases…………………………………………………………………….. 1,200 @ $10 = 12,000
1,600 @ $12 = 19,200
b.
$3,840 higher than weighted-average ($40,000 – $36,160), so net income will be $3,840
Solution approach: The effect on net income will be the difference between the cost of
goods sold as computed under the weighted-average method, versus the cost of goods
sold as computed under the FIFO and LIFO methods, respectively. FIFO cost of goods
P5.33.
a.
Solution approach: Calculate goods available for sale in units and dollars, and ending
inventory in units. These amounts are the same for both FIFO and LIFO under either a
periodic or a perpetual inventory system.
Beginning inventory…………………………………………………… 150 @ $60 = $ 9,000
FIFO periodic cost of goods sold ………………………………… 150 @ $60 = $ 9,000
70 @ 66 = 4,620
FIFO periodic ending inventory …………………………..……… 10 @ $70 = $ 700
140 @ 72 = 10,080
LIFO periodic cost of goods sold ………………………………… 50 @ $76 = $ 3,800
140 @ 72 = 10,080
90 @ 70 = 6,300
P5.33.
(continued)
b.
FIFO perpetual cost of goods sold……………..……… 2/22 sale 100 @ $60 = $ 6,000
6/11 sale 50 @ 60 = 3,000
50 @ 66 = 3,300
12/4 sale 20 @ 66 = 1,320
12/4 sale 50 @ 76 = 3,800
40 @ 72 = 2,880
10 @ 70 = 700
$21,000
LIFO perpetual ending inventory ………………………… 120 @ $60 = $ 7,200
P5.34.
a.
FIFO periodic cost of goods sold …………… 100 @ $26 = $2,600
160 @ 30 = 4,800
P5.34.
(continued)
b.
FIFO perpetual cost of goods sold:
4/10 sale 70 @ $26 = $1,820
6/11 sale 30 @ 26 = 780
120 @ 30 = 3,600
LIFO perpetual cost of goods sold:
4/10 sale 70 @ $26 = $1,820
6/11 sale 150 @ 30 = 4,500
c.
Under FIFO, the periodic and perpetual inventory systems always result in the same
dollar amounts being assigned to ending inventory and cost of goods sold—once first-in,
always first-in—and the timing of the application of the FIFO rules makes no difference.
Under LIFO, the “last–in cost” changes each time another inventory item is purchased.
P5.35.
Inventory Cost of Goods Sold
a.
Balance is Credit to Debit to correct
$15,000 too high correct error inventory error
P5.36.
a.
2017 2016
Sales…………………………………… $405,100 $393,200
Cost of goods sold……………………… (285,500) (287,500)
b.
Ending inventory errors are “self–correcting” as long as the physical inventory count is
made properly in the second year. By properly excluding the goods held on consignment
on behalf of Kirk’s Servistar at the end of 2017, the error was “self–correcting” and no
further action was necessary in 2018—from an accounting perspective, the physical
inventory count at the end of 2017 essentially served as the point of discovery of the
error.
c.
The error will have no effect on 2018 net income or stockholders’ equity. The error was
fully corrected when the December 31, 2017 ending inventory count was made properly.
C5.37.
It should be possible for most students to find the note disclosures for accounts receivable
and inventory. The answers will obviously vary depending on the focus company selected
by each student.
C5.38.
a.
Note to the instructor: Chapter 5 does not specifically address many of the complex
issues raised by part a of the case, but most students will find the list of the suggested
discussion points to be intuitive and easy to identify with. Keep it simple by highlighting
the points that you believe are worth emphasizing. A “guided tour” in-class approach
may work well with this case (rather than using it as a take-home assignment where
frustration may set in quickly for less mature students).
The most obvious and immediately noticeable difference is that John Wiley &
Sons uses April 30th as their fiscal year end whereas Pearson’s uses a calendar
year end of December 31st; thus the data presented in this case are 8 months apart
for each year presented, and not directly comparable.
Pearson’s data are presented in millions of GBP (£) rather than thousands of
USD ($). Pearson plc (meaning “public limited company” like a U.S.-based
“corporation”) is headquartered in London, England, UK, although 61% of the
company’s 2014 consolidated revenues were derived from North American
markets.