Instructor’s Manual / Solutions Manual
C3.23.
a.
It should be possible for most students to find the 5-year trend data for ROE within the
“Selected Financial Data” section of the annual report. Net income, net sales, and total
assets will ordinarily be presented within the 5-year summary as well, thus making it
C3.24.
a.
2014 2013
Cash and cash equivalents ….. ……….. ……….. ……….. ……….. ……….. $13,844 $14,259
Short-term marketable securities……. ……….. ……….. ……….. ……….. 11,233 26,287
Accounts receivable, less allowances of $84 and $99, respectively . 17,460 13,102
C3.24.
b.
(continued)
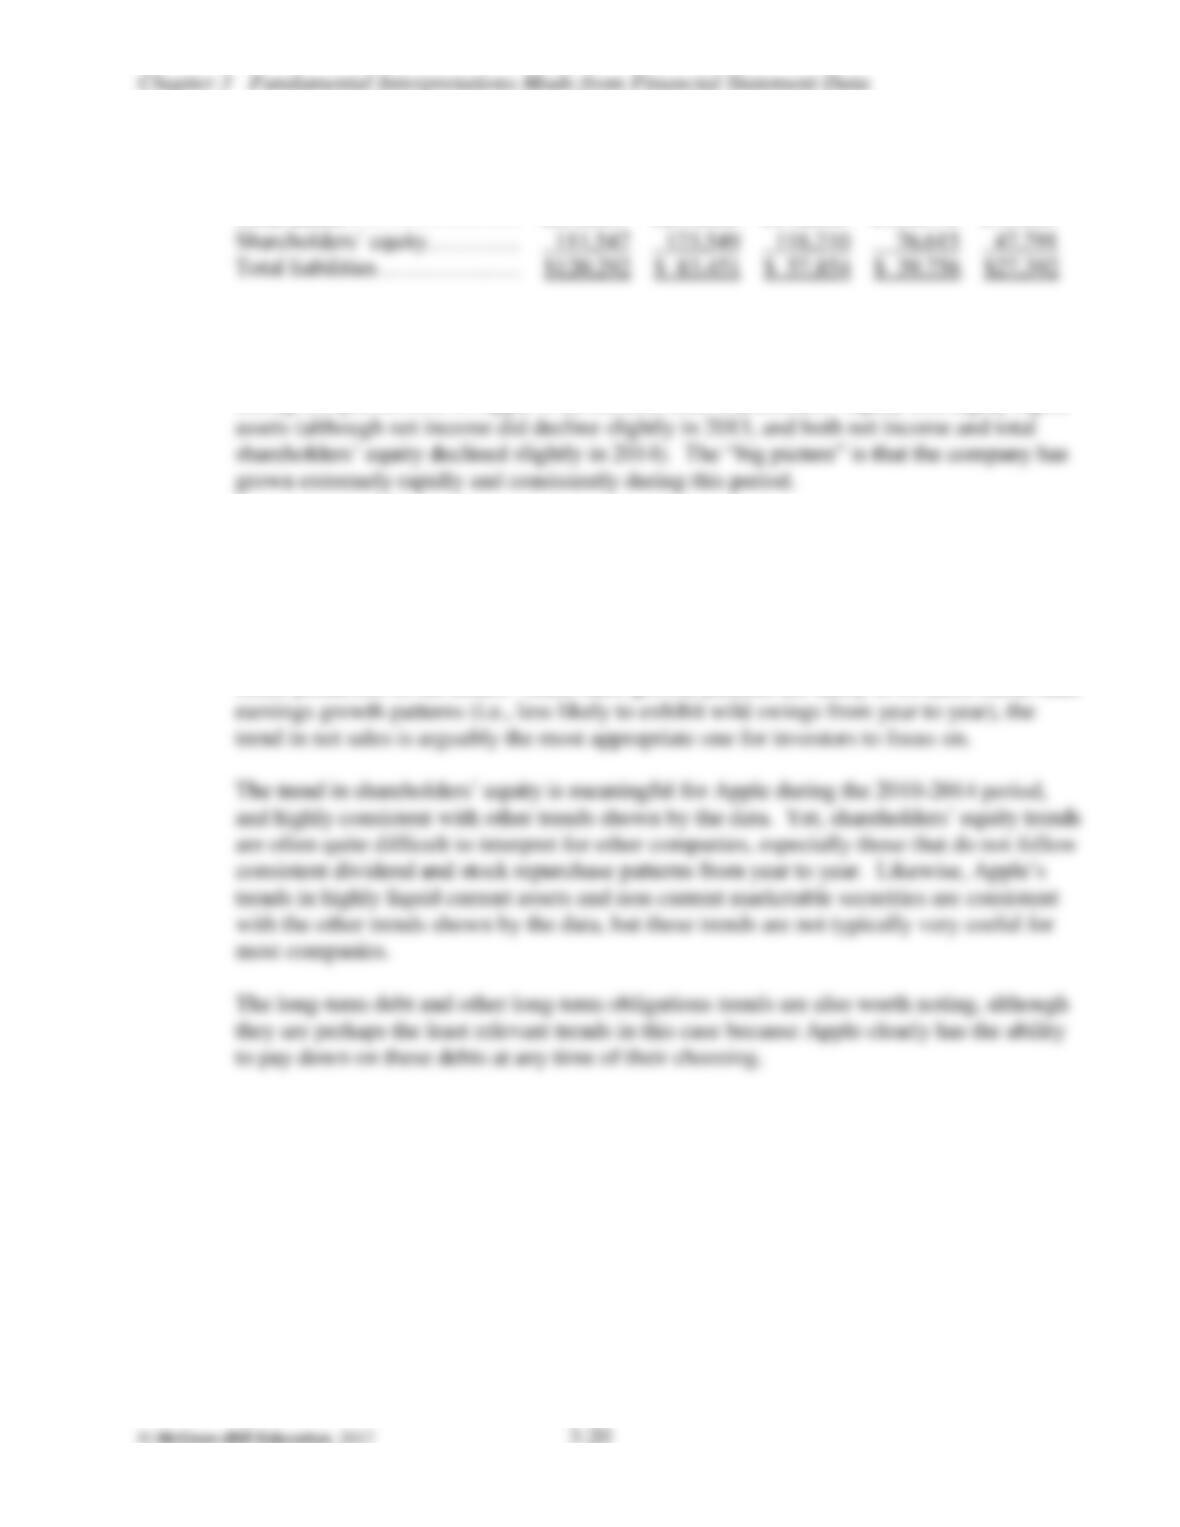
Common stock and additional paid-in capital, $0.00001 par value .. $ 23,313 $ 19,764
Retained earnings …… ……….. ……….. ……….. ……….. ……….. ……….. 87,152 104,256
Accumulated other comprehensive income (loss)…………………. 1,082 (471)
Total shareholders’ equity ….. ……….. ……….. ……….. ……….. ……….. $111,547 $123,549
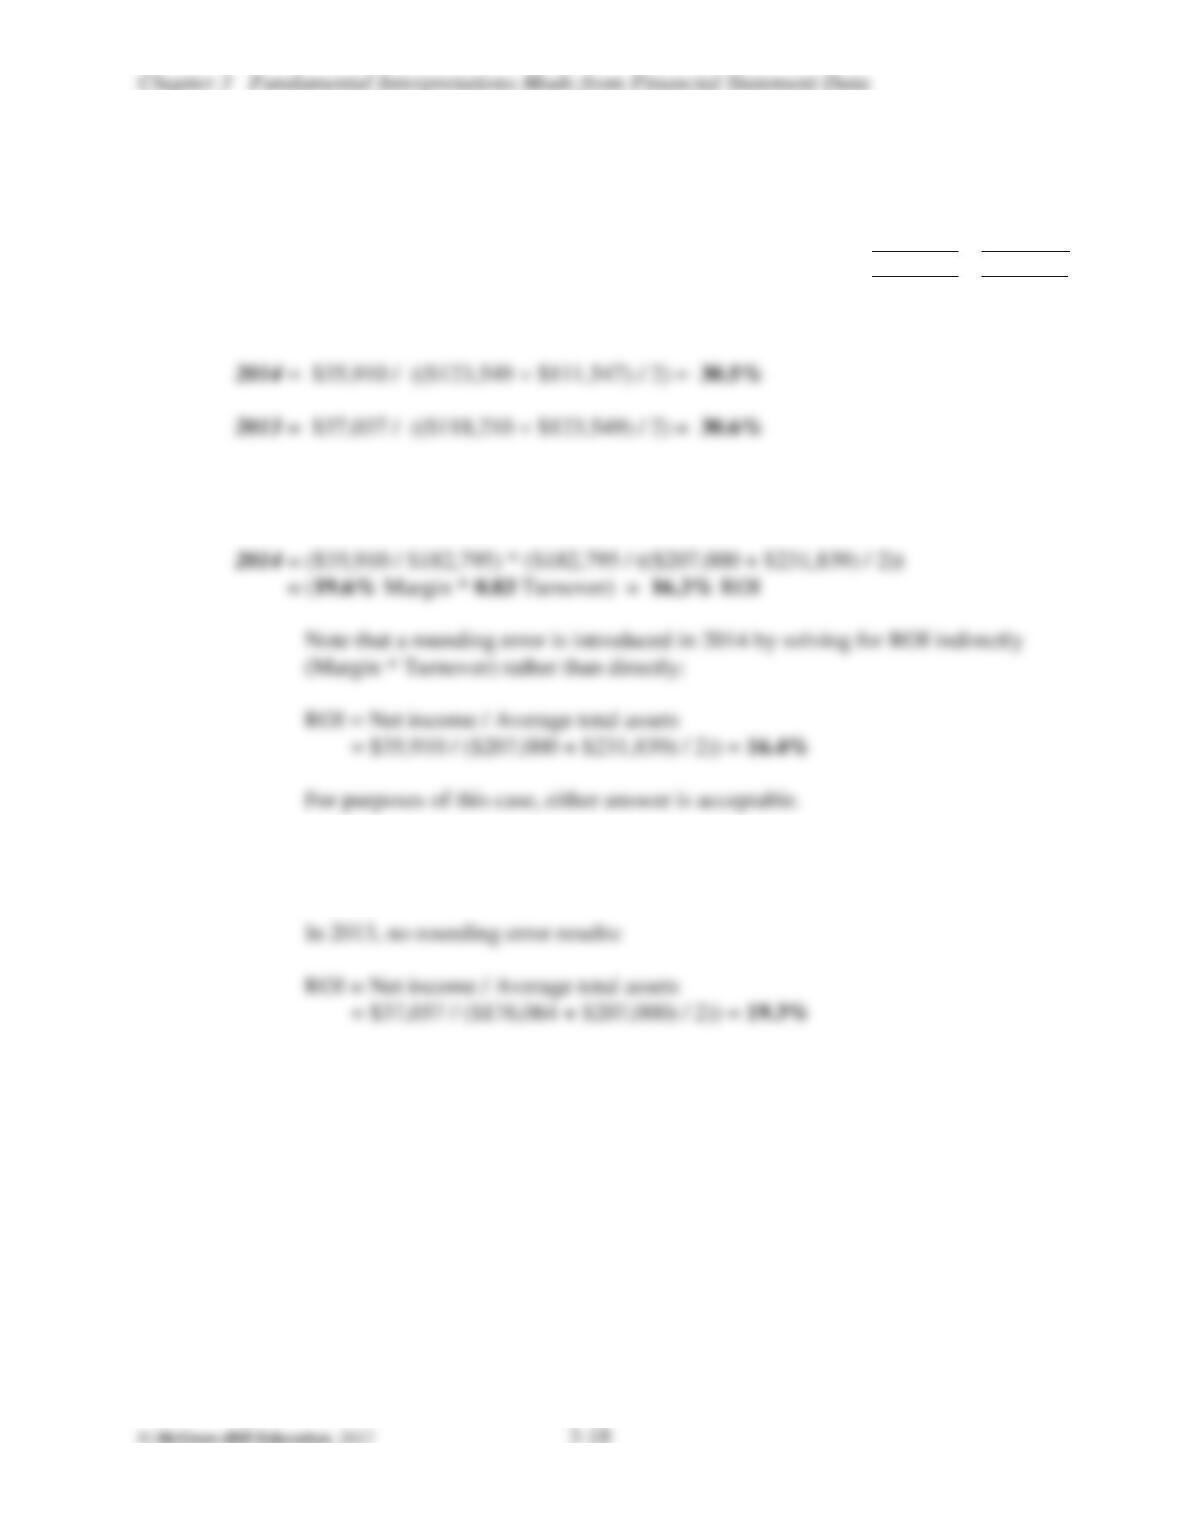
ROE = Net income / Average shareholders’ equity
c.
ROI = Margin * Turnover
= (Net income / Net sales) * (Net sales / Average total assets)
2013 = ($37,037 / $170,910) * ($170,910 / (($176,064 + $207,000) / 2))
= (21.7% Margin * 0.89 Turnover) = 19.3% ROI
C3.24.
d.
(continued)
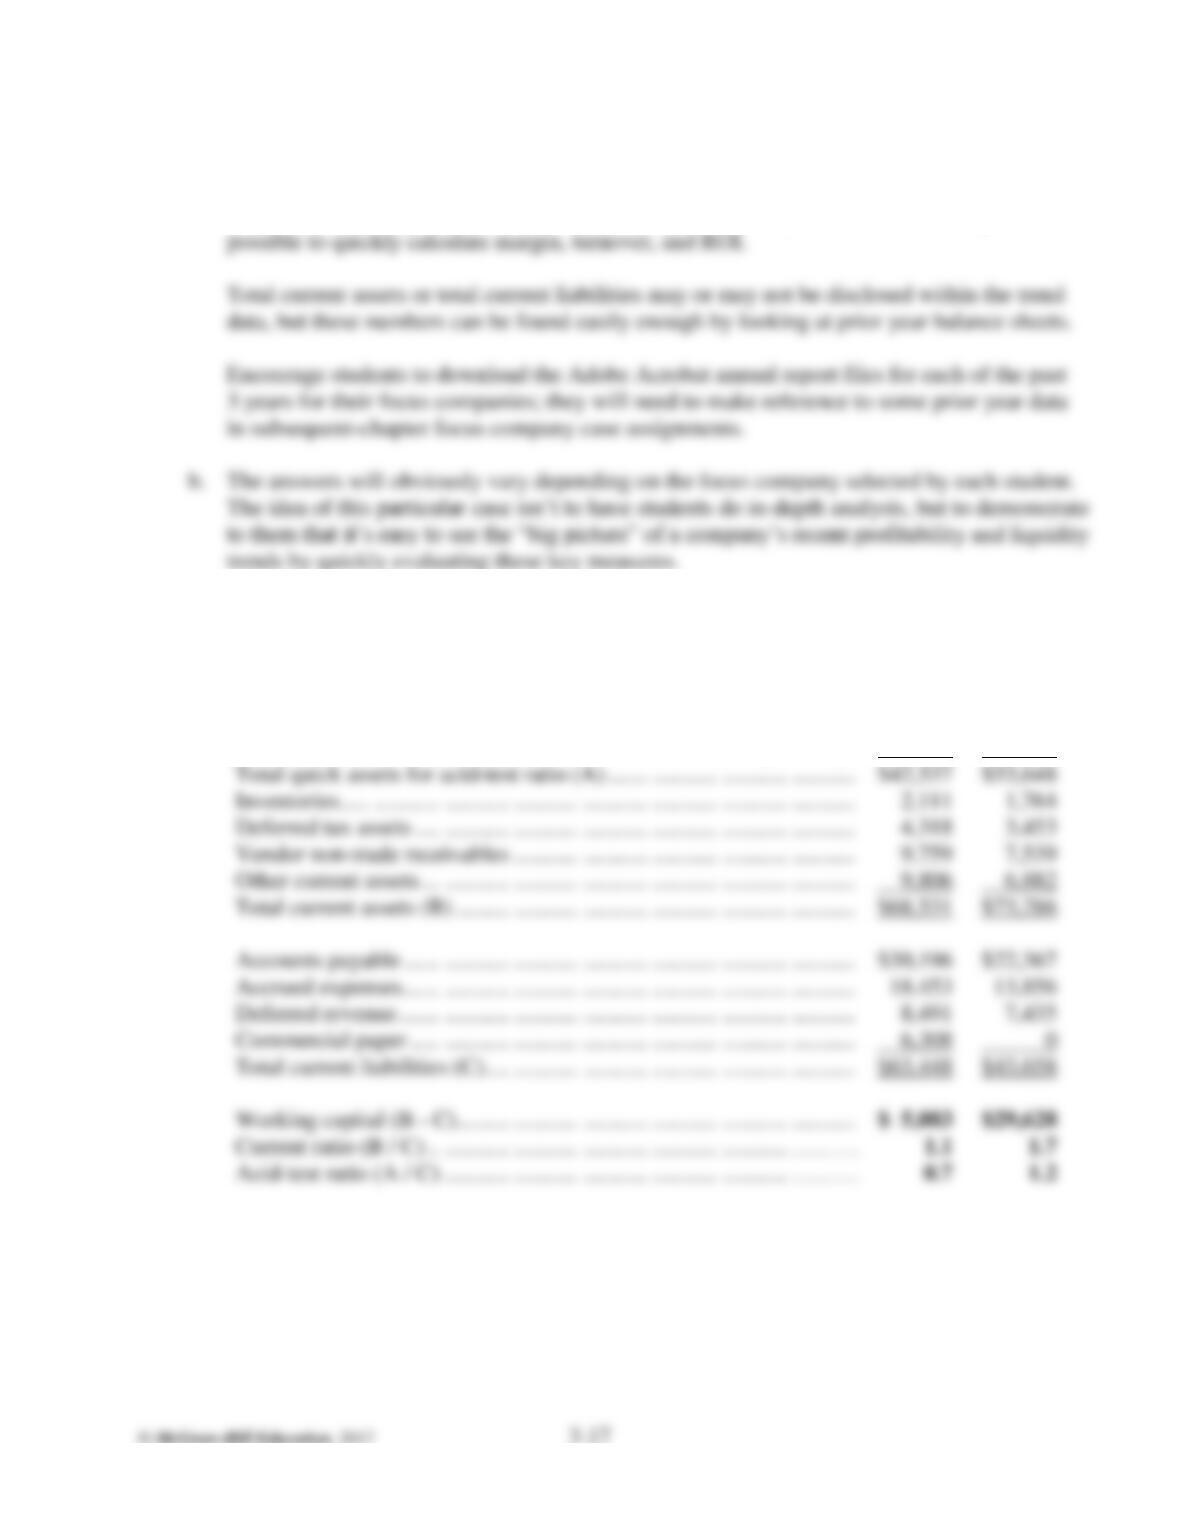
Apple’s liquidity position changed substantially in fiscal 2014, with working capital
declining from nearly $30 billion in September 2013 to just over $5 billion by the same
time the next year. Similar declines can be observed in both the current ratio and acid-test
ratio results (falling from 1.7 to 1.1 and from 1.2 to 0.7, respectively). Highlights of these
changes include a sharp decline in short-term marketable securities (from $26 billion to
The only reason that such investments are listed as long-term assets rather than current
assets is that management intends to hold them for more than one year after the balance
sheet date. Essentially, Apple generates more cash from operations than the company can
possibly redeploy in its core businesses and product markets. Thus, more than half of the
Apple’s profitability trends have been extremely strong as well. An ROI of 16.4% (for
2014) is certainly above average for a major corporation, and the 2013 result of 19.3% was
even more impressive, especially when considering that Apple has been maintaining high
levels of ROI for many consecutive years. ROE was significantly higher than ROI in both
2014 and 2013, indicating that the company is making effective use of borrowed funds—
(16.4%) in 2014 is more of an artifact of the calculation process than a true effort on the
company’s part to strategically utilize financial leverage to enhance shareholder value.
C3.24.
e.
f.
g.
(continued)
2014 2013 2012 2011 2010
Total assets………………….. $231,839 $207,000 $176,064 $116,371 $75,183
Yes, the trends in net sales, total assets, and long-term liabilities (the total of long-term
debt and other long-term obligations) show great consistency from 2010 through 2014. As
a direct consequence of these trends, there are equally aggressive growth patterns exhibited
during this period both in Apple’s net income, total shareholders’ equity and highly liquid
The net sales, net income, and total assets trends would each be meaningful to investors, in
that they express important growth patterns. Most investors tend to focus on sales growth
or earnings growth as opposed to asset growth because asset growth is sometimes financed
by debt, as was clearly the case with Apple (the combined long-term debt and other long-
term obligations trend saw substantial and consistent upward movements from less than $6
billion in 2010 to nearly $54 billion in 2014). Thus, income statement measures tend to be
better predictors of the future. Since sales growth patterns are likely to be more stable than
C3.24.
(continued)
1. What is the relative risk of the investment? In this case, although Apple’s common stock
2. How does an investment in Apple’s common stock “fit” within the investor’s overall
portfolio? The text does not cover Modern Portfolio Theory or similar “Finance” topics, but
3. How does an investment in Apple’s common stock fit within the investor’s investing
objectives? Different people invest for different reasons. A young couple in their 20′s or
4. Additional historical data concerning Apple and its industry would be helpful in making a
5. It would be helpful to have an understanding of current events surrounding the company
and its industry, as well as an understanding of general economic conditions at the time of
the investment. This is particularly important for a company such as Apple, because of
Chapter 3 Fundamental Interpretations Made from Financial Statement Data
TAKE-HOME QUIZ —CHAPTER 3 NAME______________________
Attached are the financial statements and the ____-year summary from the 20__ Annual
Report of ______________________________.
REQUIRED:
1. Calculate ROI, showing margin and turnover, for 20__, 20__, and 20__.
3. Calculate ROE for as many of the past three years as you can.
4. Assume that you have $5,000 that you would like to invest in the common stock of a
company. Evaluate the common stock of ______________________________ as a