Instructor’s Manual / Solutions Manual
E15.16.
(continued)
E15.17.
a.
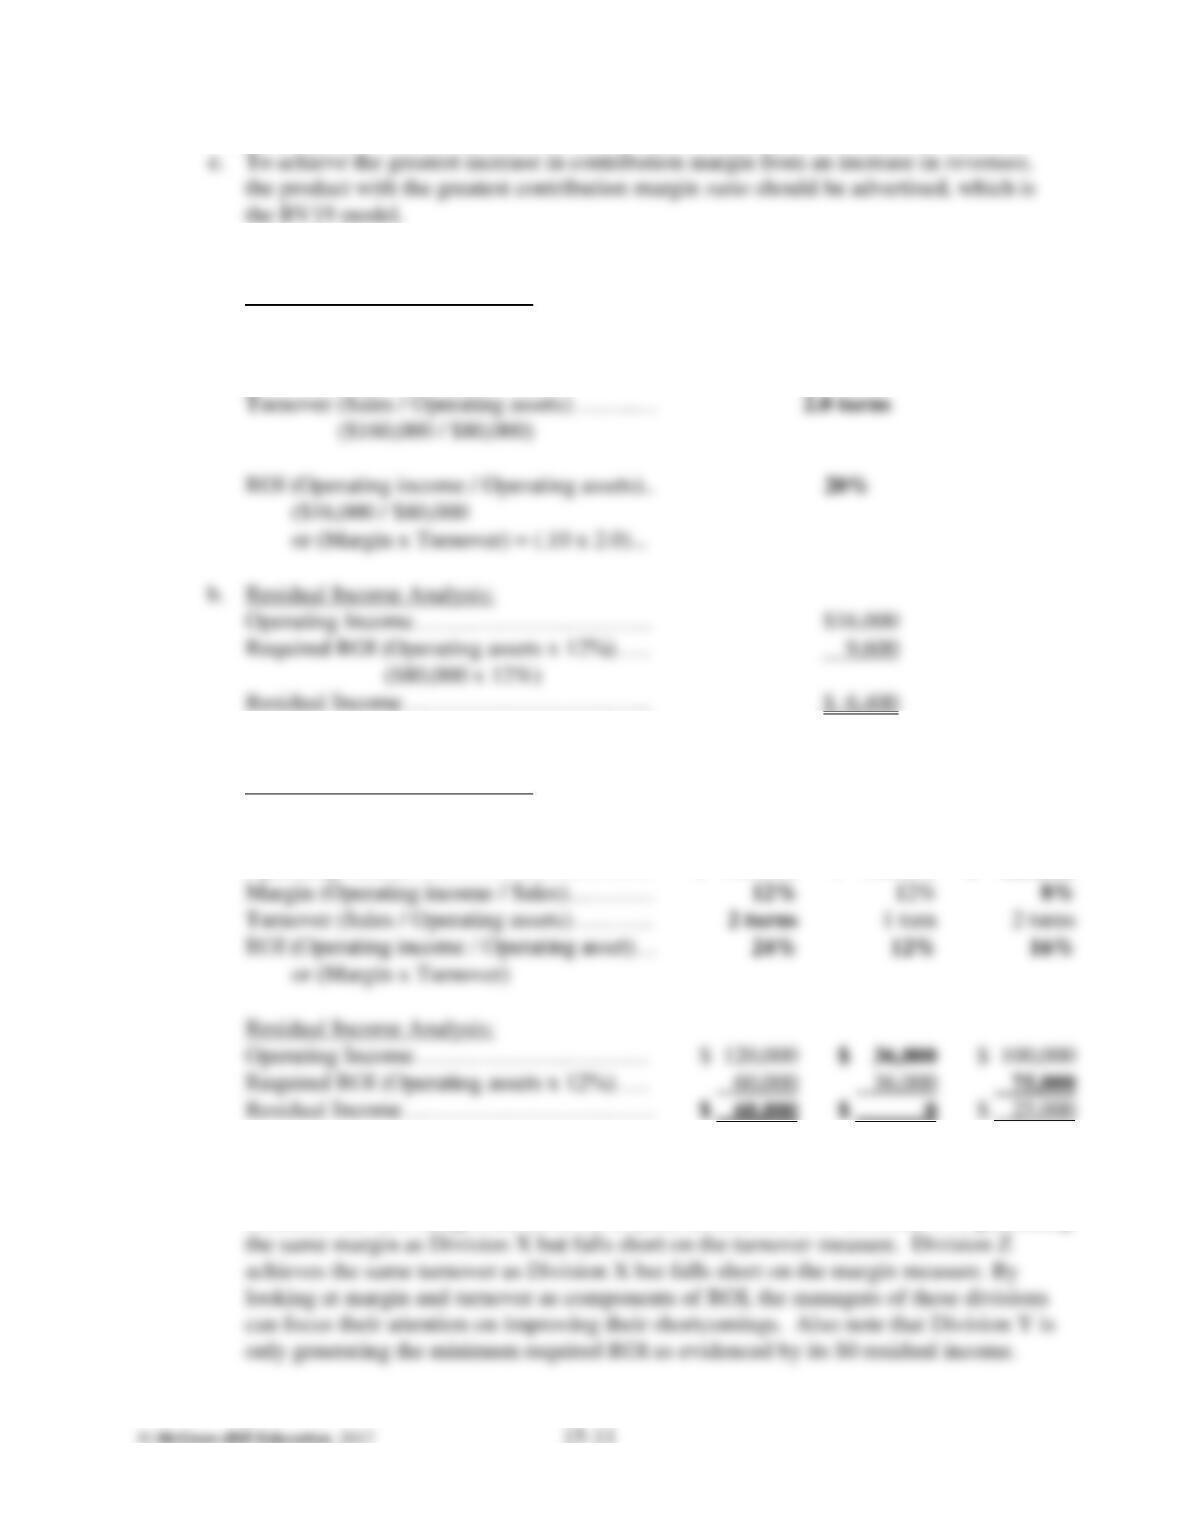
DuPont Performance Analysis:
Central Division
Margin (Operating income / Sales)…………
10%
($16,000 / $160,000)
Turnover (Sales / Operating assets)…………
($160,000 / $80,000)
ROI (Operating income / Operating assets)..
20%
($16,000 / $80,000
or (Margin x Turnover) = (.10 x 2.0)…
Residual Income Analysis:
Operating Income………………………….
Required ROI (Operating assets x 12%)…..
($80,000 x 12%)
Residual Income……………………………
E15.18.
a.
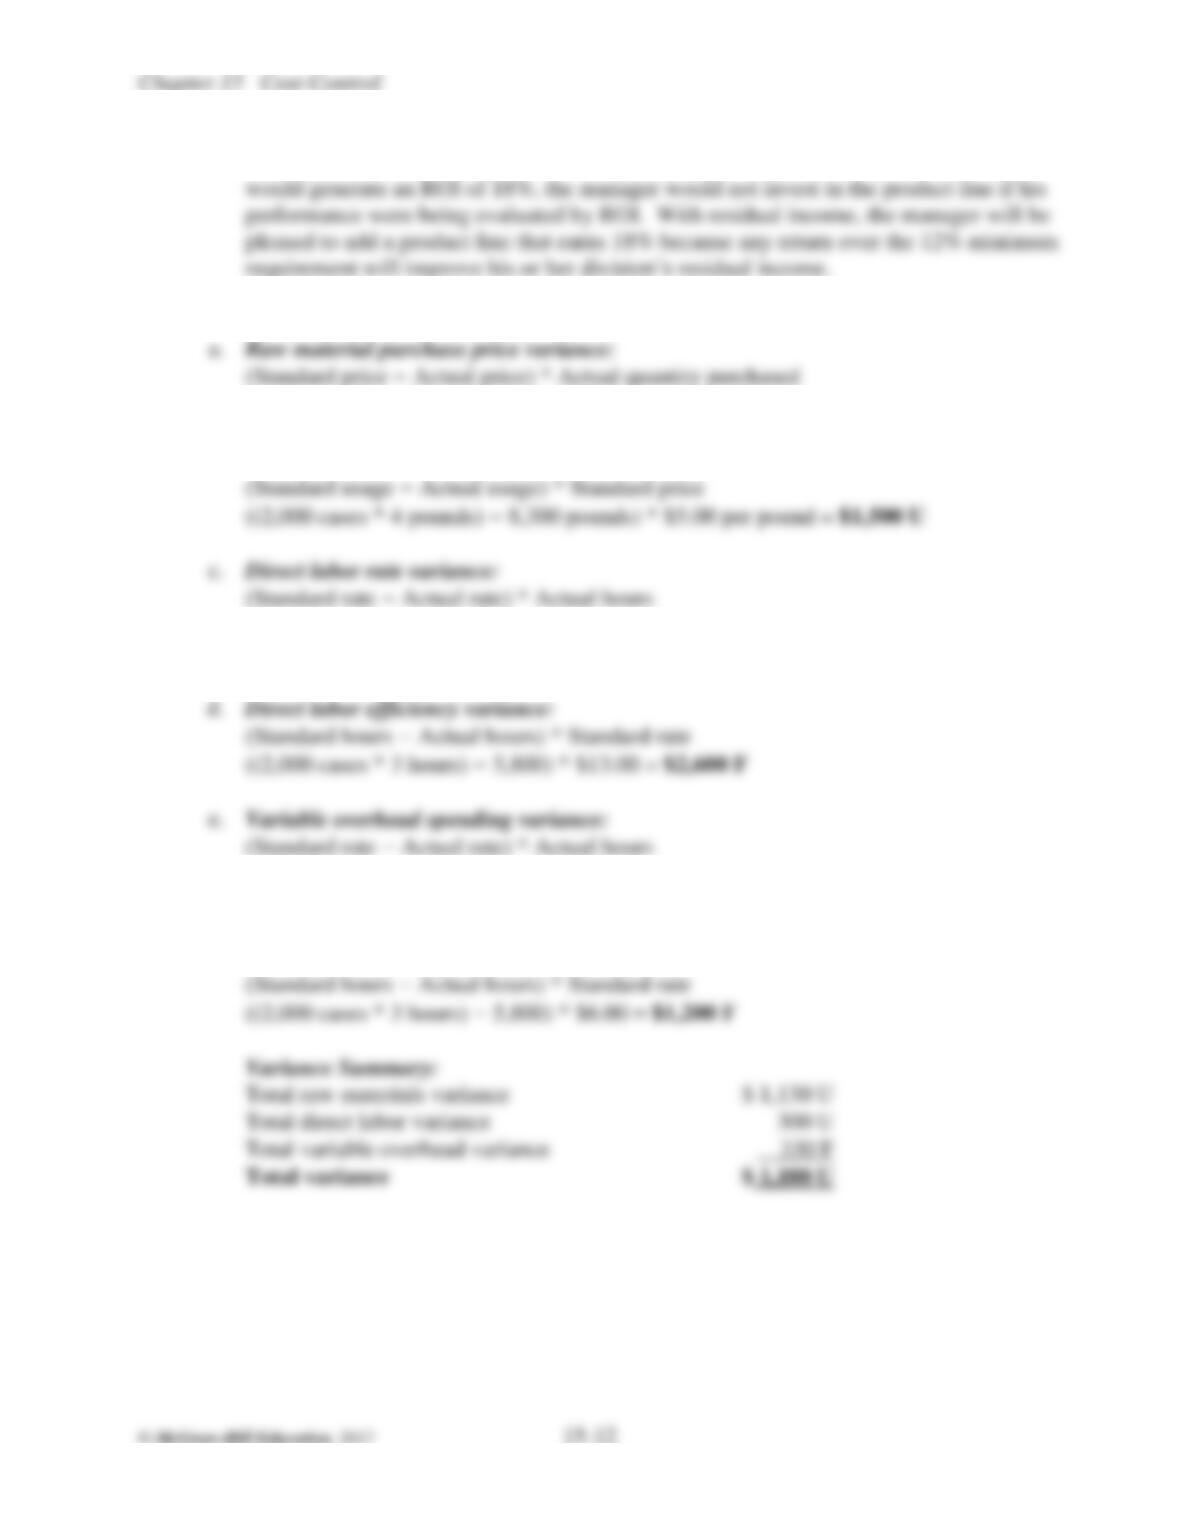
DuPont Performance Analysis:
Division X
Division Y
Division Z
Revenues……………………………………
$1,000,000
$ 300,000
$ 1,250,000
Operating Income…………………………..
$ 120,000
$ 36,000
$ 100,000
Operating Assets……………………………
$ 500,000
$ 300,000
$ 625,000
Margin (Operating income / Sales)…………
Turnover (Sales / Operating assets)………..
ROI (Operating income / Operating asset)…
or (Margin x Turnover)
Residual Income Analysis:
Operating Income……………………….…
Required ROI (Operating assets x 12%)…..
Residual Income……………………………
b.
The DuPont model provides an excellent basis of comparison between the three divisions
and illustrates the importance of managing both profit margin and turnover. Division X
combines the best margin and turnover to yield an ROI of 24%. Division Y is generating
E15.18.
(continued)
c.
If Division X were presented with an opportunity to bring on a new product line that
P15.19.
($5.00 – $4.95) * 7,400 pounds = $370 F
b.
Raw material usage variance:
($13.00 – $13.50 #) * 5,800 hours = $2,900 U
# Actual rate: $78,300 / 5,800 hours = $13.50
((2,000 cases * 3 hours) – 5,800) * $13.00 = $2,600 F
($6.00 – $6.15 #) * 5,800 hours = $870 U
# Actual rate: $35,670 / 5,800 hours = $6.15
f.
Total raw materials variance
Total variable overhead variance
Variable overhead efficiency variance:
E15.19.
(continued)
Explanation of results: In order to create a favorable purchase price variance, the
purchasing manager may have purchased lower-than-standard quality raw material
P15.20.
a.
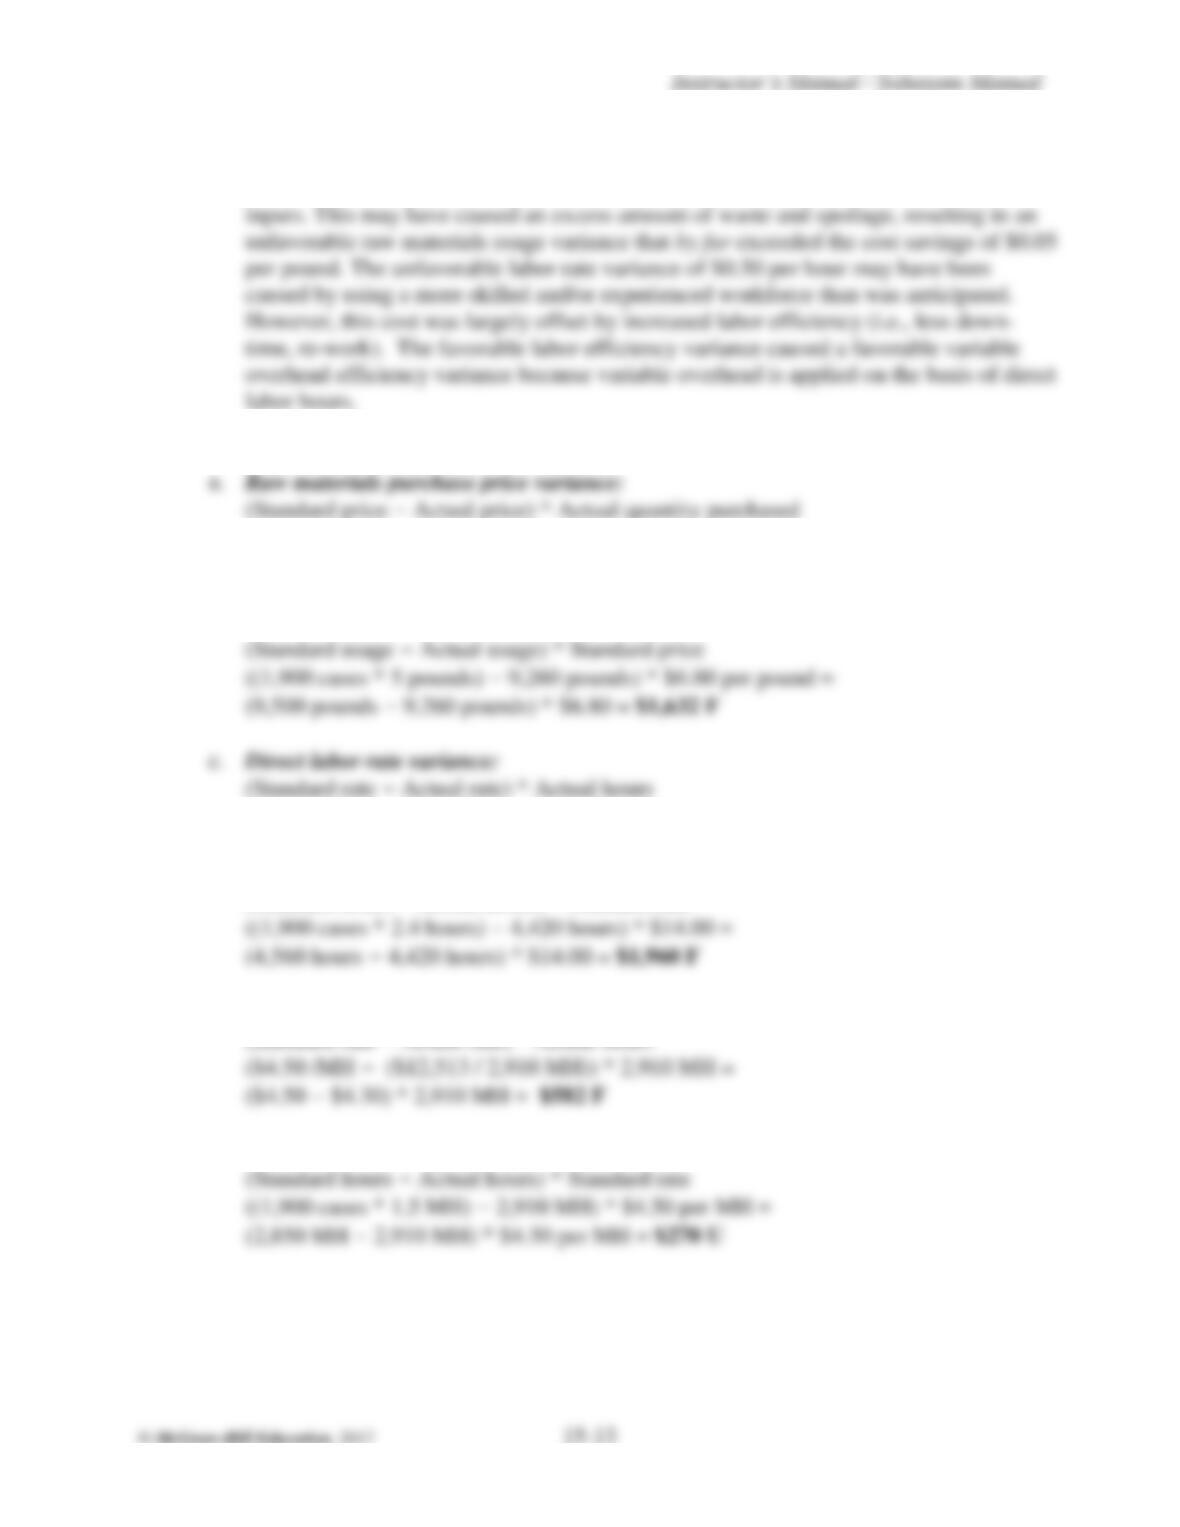
Raw materials purchase price variance:
(Standard price – Actual price) * Actual quantity purchased
($6.80 – ($80,940 / 11,400 pounds)) * 11,400 pounds =
($6.80 – $7.10) * 11,400 = $3,420 U
b.
(Standard usage – Actual usage) * Standard price
Raw materials usage variance:
($14.00 – $14.35) * 4,420 hours = $1,547 U
d.
Direct labor efficiency variance:
(Standard hours – Actual hours) * Standard rate
e.
Variable overhead spending variance:
(Standard rate – Actual rate) * Actual hours
f.
(Standard hours – Actual hours) * Standard rate
(2,850 MH – 2,910 MH) * $4.50 per MH = $270 U
Variable overhead efficiency variance:
E15.20.
(continued)
Variance Summary:
Total raw materials variance
$ 1,788 U
Total direct labor variance
413 F
Total variable overhead variance
312 F
Total variance
$ 1,063 U
Explanation of results: The unfavorable purchase price variance sometimes indicates
that higher-than-standard quality raw material inputs were purchased—and the
P15.21.
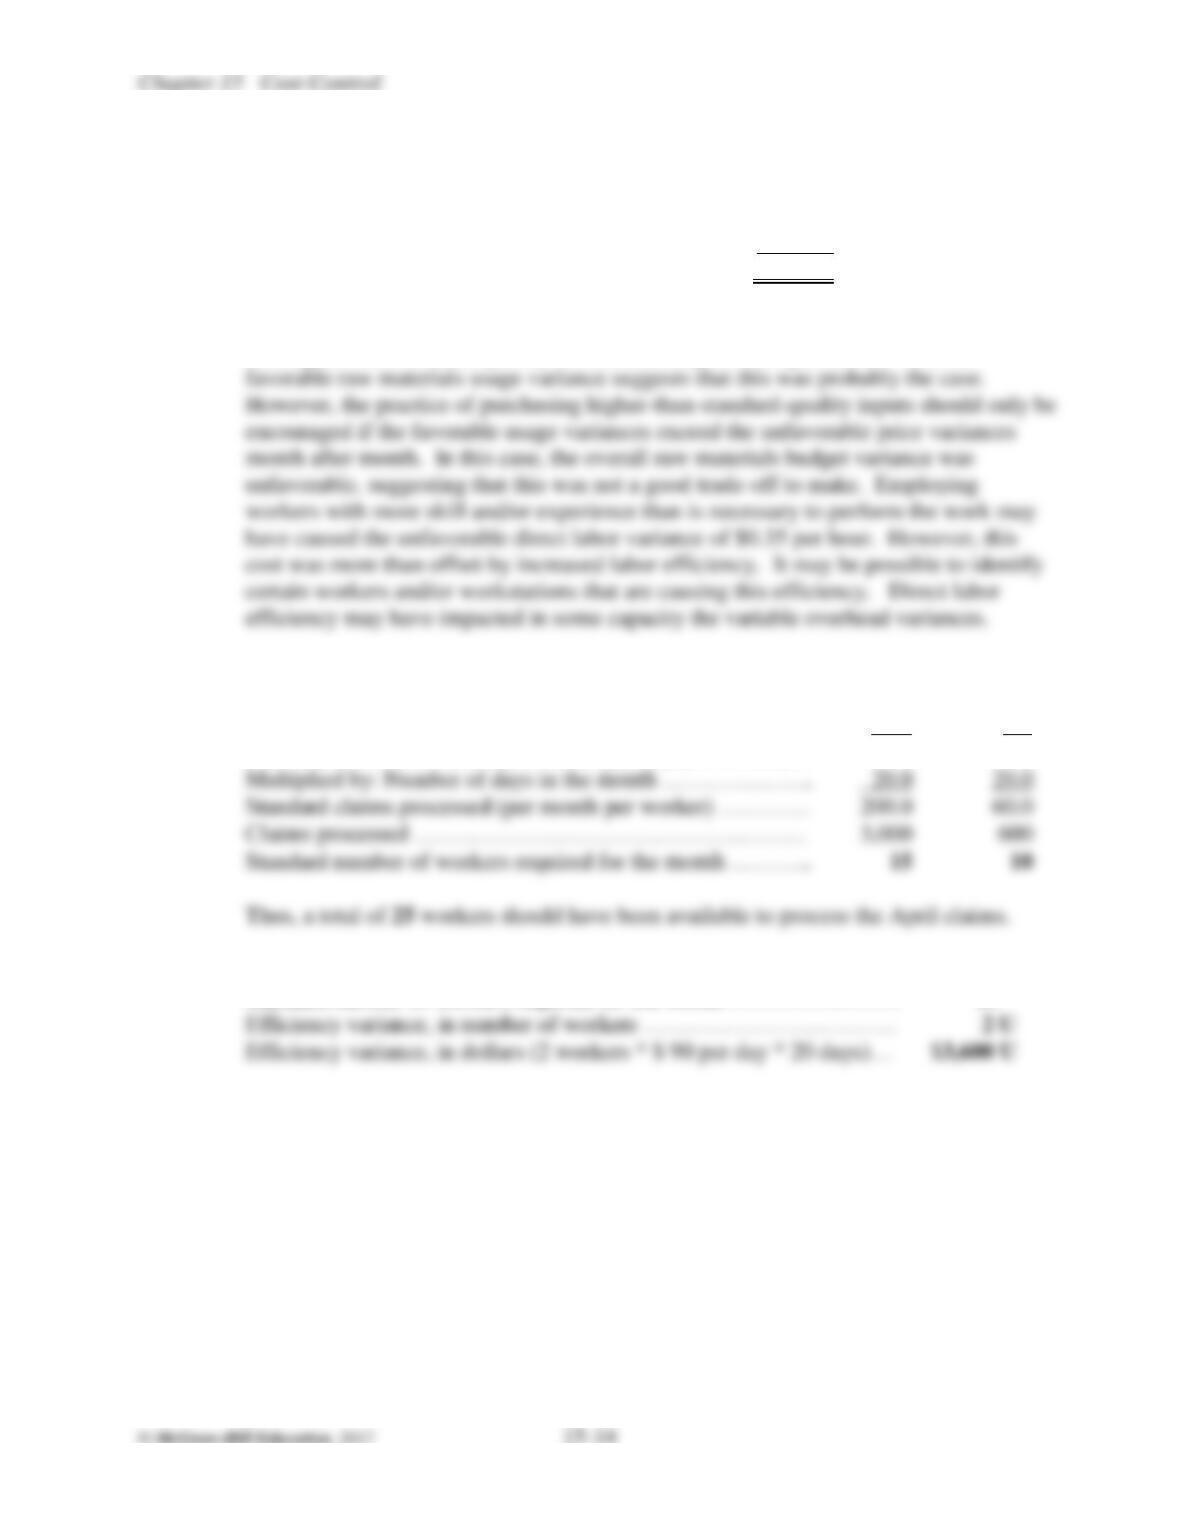
Simple
Complex
a.
Work hours per day ………………………………………….
7.5
7.5
Divided by: Standard processing time per claim (in hours) …
0.75
2.5
Standard number of claims processed (per day per worker)…
10.0
3.0
Multiplied by: Number of days in the month ………………..
20.0
Standard claims processed (per month per worker) …………
60.0
Claims processed ……………………………………………
Standard number of workers required for the month ………..
b.
Actual number of workers …………………………………………….
27
Standard number of workers required for the month ………………….
25
Efficiency variance, in number of workers ……………………………
Efficiency variance, in dollars (2 workers * $ 90 per day * 20 days)…
P15.22.
a.
Teller staffing analysis:
Number of customers per hour …………………………………
50
Divided by: Standard number of customers per hour per teller..
12
Number of tellers required per hour, at standard ………………
4.17
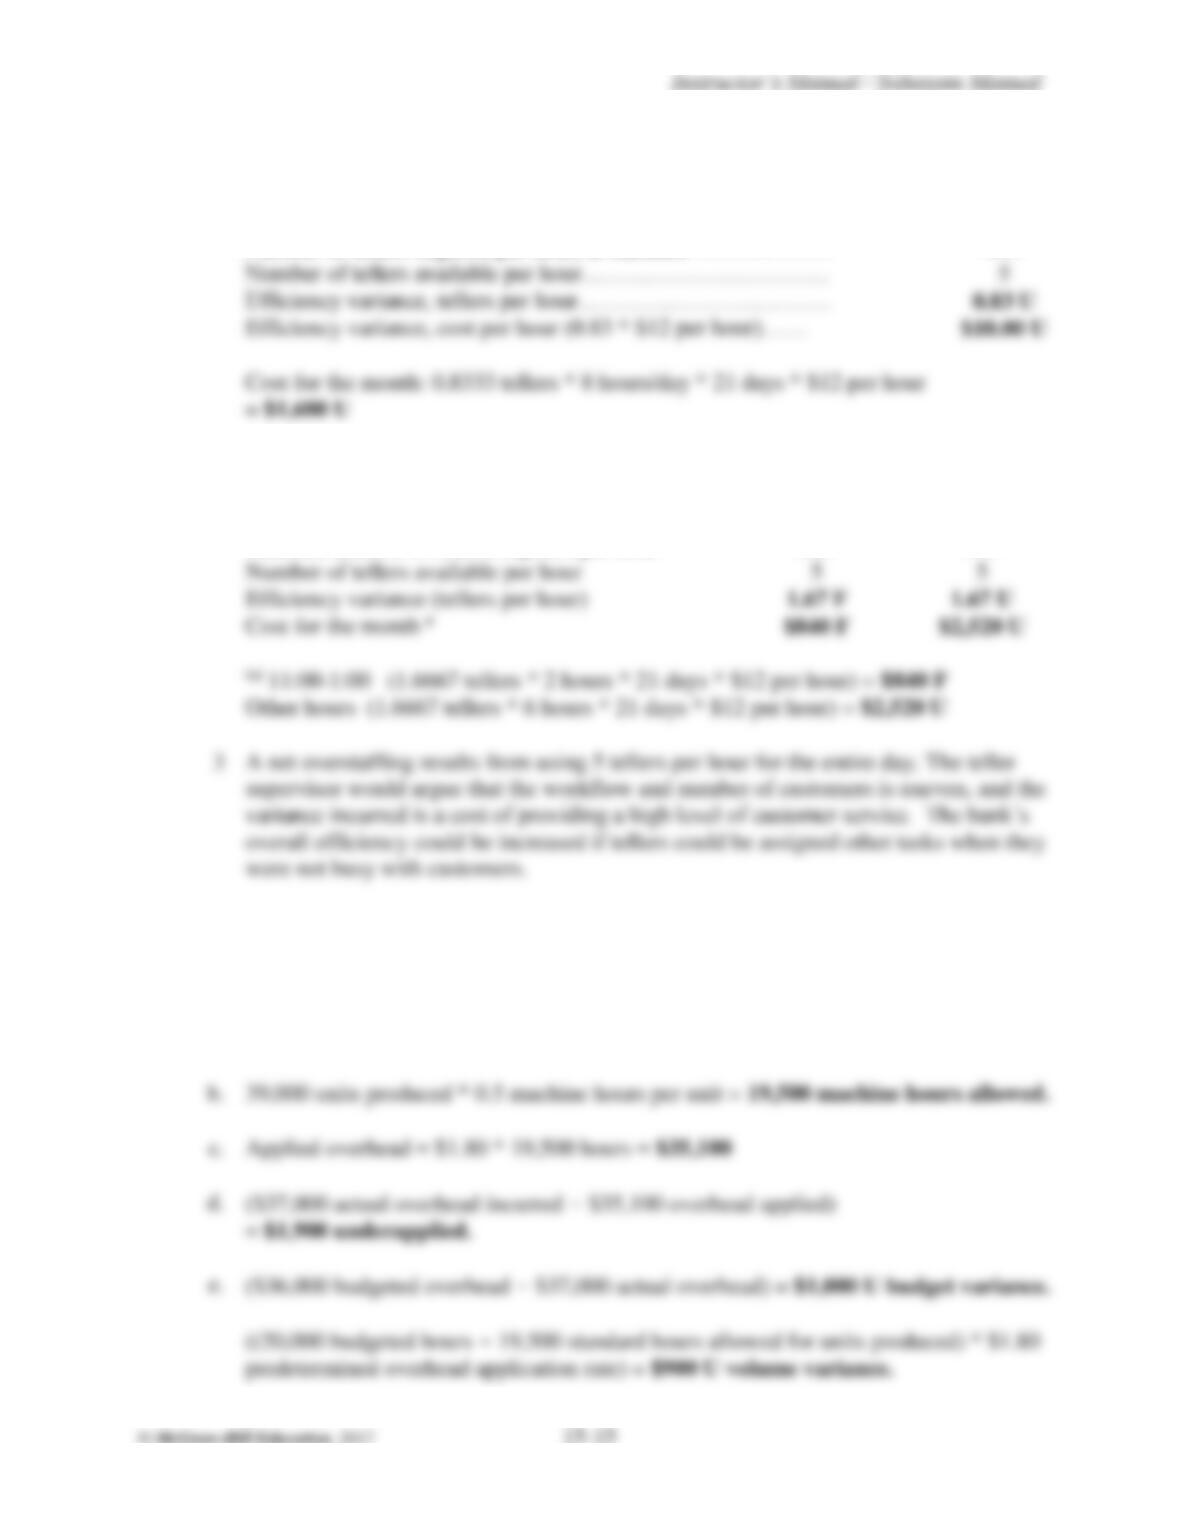
Number of tellers available per hour……………………………
Efficiency variance, tellers per hour……………………………
Efficiency variance, cost per hour (0.83 * $12 per hour)……
b.
Teller staffing analysis:
11:00-1:00
Other hours
1 & 2
Average number of customers per hour……………
80
40
Standard customers served per teller per hour ……
12
12
Standard number of tellers required per hour
6.67
3.33
Number of tellers available per hour
Efficiency variance (tellers per hour)
P15.23.
a.
Predetermined overhead application rate:
=
Activity Estimated
$ Overhead Estimated
=
hours) 5.0 * units 000,40(
000,36$
= $1.80 per machine hour
b.
c.
P15.24.
a.
Variable
Fixed
Original budget ………………………………………
$21,000
$32,000
Budgeted production, in units ……………………..…
15,000
Budget per unit ………………………………………
$ 1.40
not appropriate
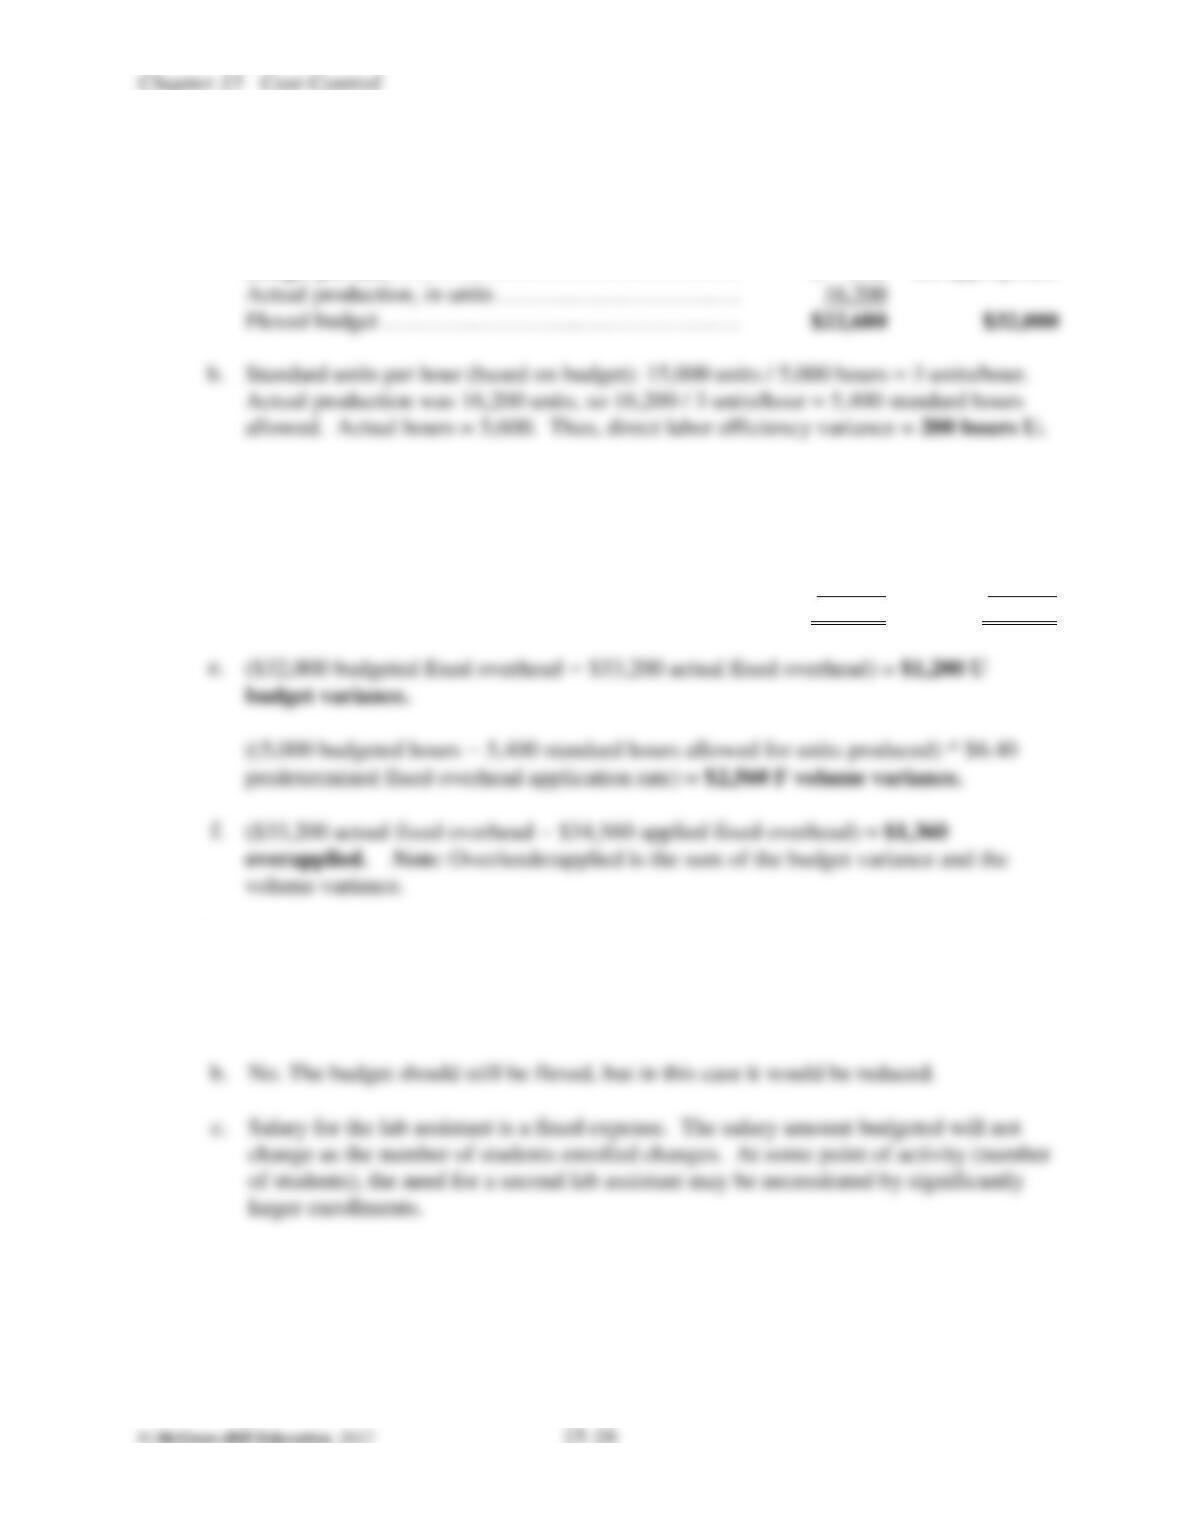
Actual production, in units …………..………………
16,200
Flexed budget ……………………..…………………
$22,680
$32,000
Standard units per hour (based on budget): 15,000 units / 5,000 hours = 3 units/hour.
Actual production was 16,200 units, so 16,200 / 3 units/hour = 5,400 standard hours
(c & d)
Variable
Fixed
Original budget ………………………………………
$21,000
$32,000
Budgeted activity (direct labor hours) ………………
5,000
5,000
c.
Predetermined overhead application rate per hour …
$ 4.20
$ 6.40
Standard hours allowed………………………………
5,400
5,400
d.
Overhead applied ……………………………………
$22,680
$34,560
C15.25.
a.
Supplies are a variable expense. The supplies budget should be flexed (i.e., it should
be increased to provide funds for the additional 18 students above the number
anticipated when the original budget was established).
No. The budget should still be flexed, but in this case it would be reduced.
change as the number of students enrolled changes. At some point of activity (number
of students), the need for a second lab assistant may be necessitated by significantly
larger enrollments.
C15.26.
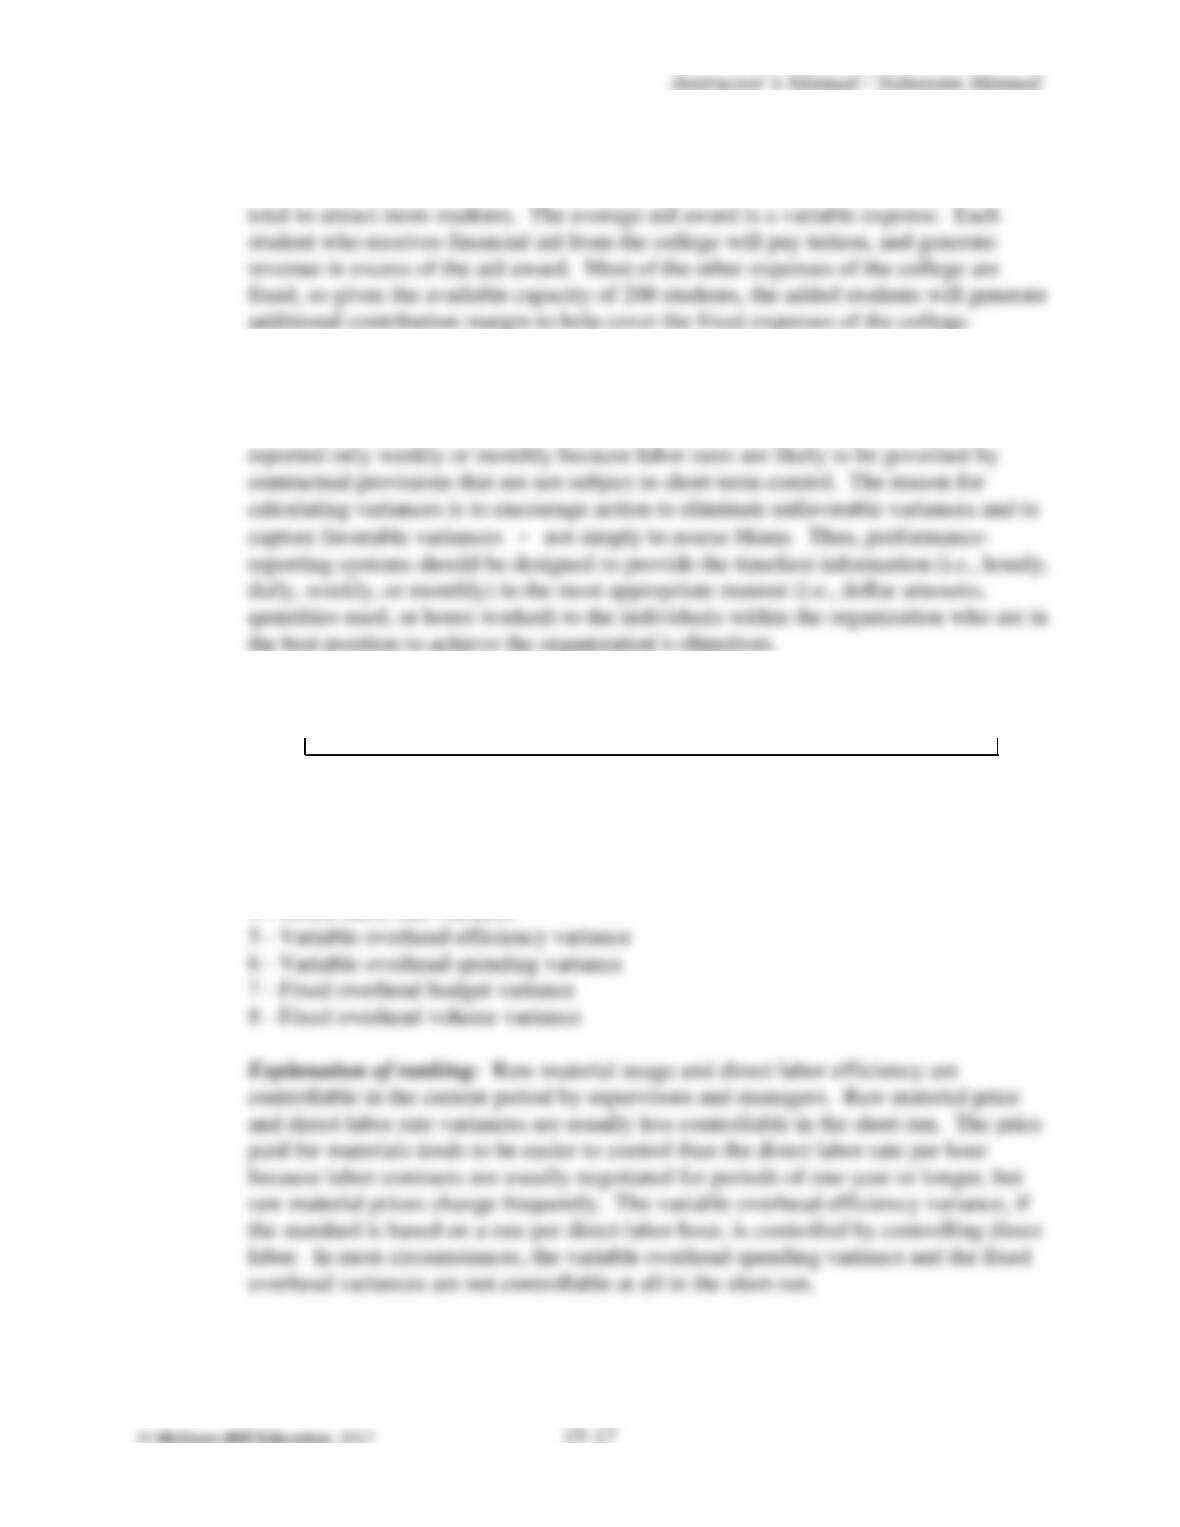
The gifts and grants budget should be flexed. In other words, it should be increased in
C15.27.
No. For example, management might be able to control results better if the labor
efficiency variance is reported daily, in hours. The labor rate variance might be
C15.28.
a.
and direct labor rate variances are usually less controllable in the short run. The price
paid for materials tends to be easier to control than the direct labor rate per hour
because labor contracts are usually negotiated for periods of one-year or longer, but
Most Useful Least Useful
1,2 3 4 5,6 7,8
1 – Raw material usage variance
2 – Direct labor efficiency variance
3 – Raw material price variance
4 – Direct labor rate variance