CHAPTER
14
Cost Planning
CHAPTER OUTLINE:
I. Introduction
A. Why Budgets are Useful
B. Definition of Performance Reporting
II. Cost Classifications
A. Relationship of Cost to Volume of Activity
2. Fixed cost
3. Mixed cost
B. According to a Time-Frame Perspective
1. Committed cost
2. Discretionary cost
III. Budgeting
A. The Budgeting Process in General
1. Usefulness of budgets–A function of management philosophy
2. Starting point for budget
a. Actual performance of current period
b. Zero–based budgeting approach
B. The Budget Time Frame
2. Multi–period, rolling budget
3. Different periods for different budgets
C. The Budgeting Process
1. Broad assumptions about the economy, industry, and company
2. Operating budget
a. Sales/revenue forecast
b. Purchases/production budget
Chapter 14 Cost Planning
CHAPTER OUTLINE (continued)
e. Cash budget and the timing of cash receipts and cash payments
f. Balance sheet budget
3. Sales forecast is the key
D. Illustration of the Purchases/Production Budget
1. Using the cost of goods sold model
2. Based on gross profit ratio
E. Cost of Goods Sold Budget Discussion
F. Operating Expense Budget Challenges
G. Budgeted Income Statement Discussion
IV. Standard Costs
A. Standards Defined – A Unit Budget Allowance
B. Using Standard Costs
2. Focus may be on dollar amounts and/or quantities
C. Developing Standards
2. Attainable standards
3. Past experience standards
D. Costing Products with Standard Costs
1. A budget for each component
2. Illustration of product cost development
E. Other Uses of Standards
V. Budgeting for Other Analytical Purposes
A. Other Important Resources
2. Utilization of productive capacity
B. Other Functional Areas
Instructor’s Manual / Solutions Manual
TEACHING/LEARNING OBJECTIVES:
Primary: To have the student understand:
1. That the sales/activity forecast is the starting point – and the key – to the entire budgeting
process.
3. That standard costs are unit budgets, and in turn, to appreciate how standards can be used in
the planning and control process.
Supporting: To have the student understand:
4. The significance of top management’s attitude toward the budgeting process, and the
5. That different time periods may be appropriate for different budgets.
6. How individual budgets interrelate to make up the overall operating budget.
TEACHING OBSERVATIONS:
1. The reasons for and advantages of budgeting for an entity can be related to the personal
budgeting that students may have done.
3. Be careful not to get caught up in the “how to” aspects of preparing budgets, or students
4. Emphasize that standards are unit budgets, and can be used to accomplish all of the
objectives associated with budgets.
5. Call attention to the behavioral implications that result from the standard setting process and
emphasize the importance of the perception that standards are attainable by those whose
Chapter 14 Cost Planning
ASSIGNMENT OVERVIEW:
NO.
LEARNING
OBJECTIVES
DIFFICULTY &
TIME ESTIMATE
OTHER COMMENTS
M14.1
4,5
Easy, 7-10 min.
Basic introduction to a production budget.
M14.2
4,5
Med., 10-12 min.
Purchases budget requires analysis of beginning inventory.
M14.3
6
Med., 12-15 min.
Uses flexible budget idea to create operating expense budget.
M14.4
8
Easy, 7-10 min.
Straight-forward analysis of cash receipts.
M14.5
8
Easy, 10-12 min.
Uses cash receipt amount determined in M14.4 and continues
to complete preparation of a cash budget.
M14.6
10
Easy, 7-10 min.
Basic introduction to standard cost per unit determination.
E14.7
4,5
Easy, 7-10 min.
Stress that the Finished Goods account must be analyzed to
E14.8
4,5
Easy, 7-10 min.
See 14.7. Good in-class exercise.
E14.9
5
Easy, 7-10 min.
Emphasize the importance of management planning in the
development of appropriate ending inventory policies.
E14.10
4,5
Med., 12-15 min.
Good homework assignment.
E14.11
4,8
Easy, 5-8 min.
Straight-forward cash receipts budget.
E14.12
4,8
Easy, 7-10 min.
See 14.11. Good in-class demonstration problem.
E14.13
9,10
Easy, 5-8 min.
Emphasize that standards must be appropriate and fair if they
are to be useful for managerial planning and control purposes.
E14.14
9,10
Med., 7-10 min.
See 14.13. Good in-class exercise.
E14.15
10,11
Easy, 5-8 min.
Emphasize the importance of management planning and data
gathering in the development of appropriate standards.
E14.16
10,11
Med., 10-12 min.
Good homework assignment.
P14.17
4,5
Med., 10-12 min.
The key is to calculate budgeted cost of sales for each month,
using: Sales * (1 – Gross profit ratio).
P14.18
4,5
Hard, 15-20 min.
Group learning problem. Students have difficulty converting
4,8
Med., 10-15 min.
Walk students through the solution in class—make sure they
understand the rhythm of this problem before assigning 14.20.
P14.20
4,8
Hard, 25-35 min.
to 14.19 before attempting this problem.
Group learning problem. Students should review the answers
P14.21
8
Med.-Hard,
Explain to students that the purpose of this problem is to help
P14.22
8
Hard, 45-60 min.
Excel problem. Group learning problem. Good homework
assignment.
P14.23
4,5,8
Hard, 45-60 min.
Students should review the solution to this problem before
attempting 14.24.
P14.24
4,5,8
Hard, 45-60 min.
Excel problem. Group learning problem. Emphasize the
inter-relationships among the budgets.
C14.25
Med., 15-20 min.
Good class discussion case. Students consider the challenges in
the process of setting standards of performance.
C14.26
Med., 30-40 min.
budget process described in the chapter.
Internet case. This case is intended to introduce the student to
C14.27
Med., 30-45 min.
gathering exercise and introduction to various budgeting
software products.
Internet case. Group learning case. Good information
M14.1.
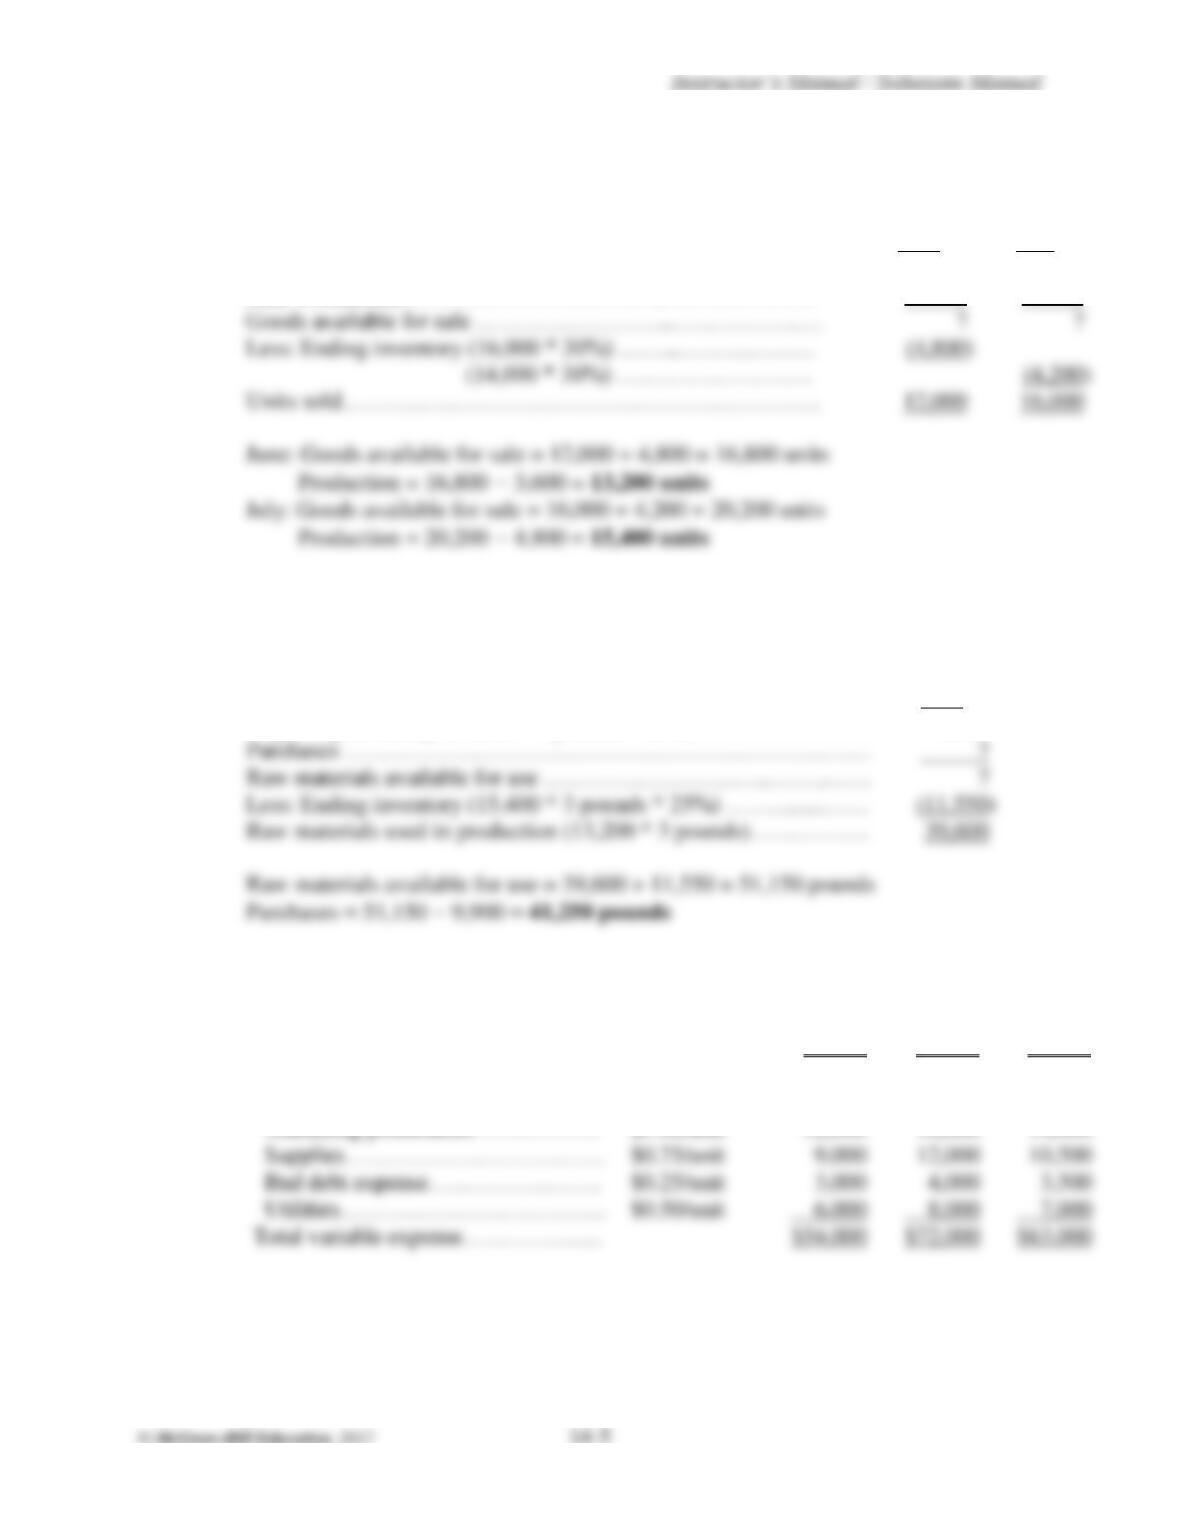
Use the cost of goods sold model, and work from the bottom up and then top down to
calculate production:
June
July
Beginning inventory…………………………..………………
3,600
4,800
Add: Production……………………………..………………..
?
?
Goods available for sale ……………………..……………..…
?
?
Less: Ending inventory (16,000 * 30%) ……..………………
(14,000 * 30%) …..…………………
Units sold………………………………………………………
M14.2.
Use the same approach as M14.1, but notice that raw material used is a function of
quantity produced from the production budget. Each unit requires 3 pounds of raw
material.
June
Beginning inventory (13,200 * 3 pounds * 25%) …….……….……
9,900
Purchases ……………………………………………………………
Raw materials available for use ………………………………..……
Less: Ending inventory (15,400 * 3 pounds * 25%) ……..…….……
Raw materials used in production (13,200 * 3 pounds)…….………
Raw materials available for use = 39,600 + 11,550 = 51,150 pounds
M14.3.
Variable
Rate
June
July
August
Budgeted sales (units)…..…………….
12,000
16,000
14,000
Variable operating expenses:
Sales commissions…….…………..
$2.00/unit
$24,000
$32,000
$28,000
Marketing promotions……………..
$1.00/unit
12,000
16,000
14,000
Supplies…………………………….
$0.75/unit
12,000
10,500
Bad debt expense…………………..
$0.25/unit
Utilities……………………………..
$0.50/unit
6,000
8,000
7,000
Total variable expense………….……
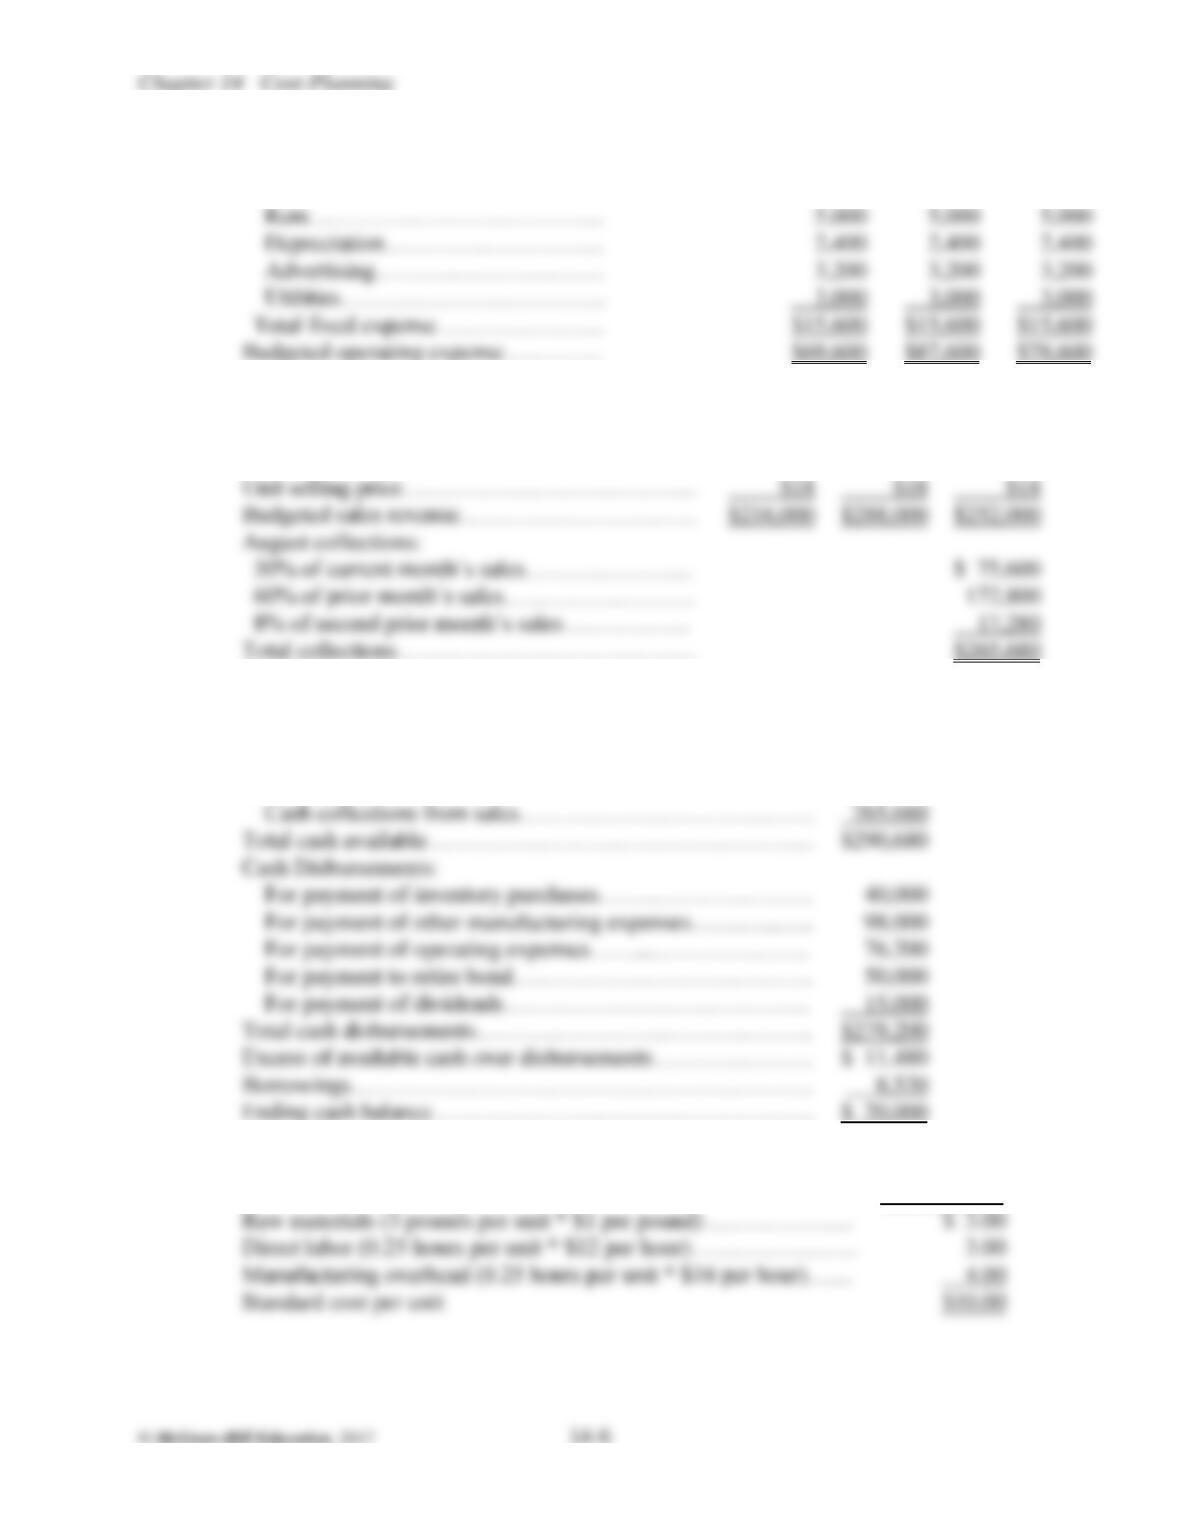
M14.3.
(continued)
June
July
August
Fixed operating expenses:
Salaries……………………………..
$ 2,000
$ 2,000
$ 2,000
Rent…………………………………
Depreciation………………………..
Advertising…………………………
Utilities……………………………..
3,000
3,000
3,000
Total fixed expense……….…….……
Budgeted operating expense………….
$69,600
$87,600
$78,600
M14.4.
June
July
August
Budgeted sales units……..……………………….
12,000
16,000
14,000
Unit selling price…………………………………
$18
$18
$18
30% of current month’s sales………………….
60% of prior month’s sales…………………….
172,800
8% of second prior month’s sales……………..
Total collections…………………………………
$265,680
M14.5.
August
Beginning cash balance….……………………………….…….
$ 25,000
Cash Receipts:
Cash collections from sales………..……………………….
265,680
Total cash available……………………………………………
$290,680
Cash Disbursements:
For payment of inventory purchases……………………….
40,000
For payment of other manufacturing expenses……………..
For payment of operating expenses…………………………
76,200
For payment to retire bond…………………………………
For payment of dividends………………………………….
15,000
Total cash disbursements……………………………………..
Excess of available cash over disbursements…………………
$ 11,480
Ending cash balance…………………………………………..
$ 20,000
M14.6.
Cost per unit
Raw materials (3 pounds per unit * $1 per pound) ….……………..
Direct labor (0.25 hours per unit * $12 per hour)………………….
Standard cost per unit
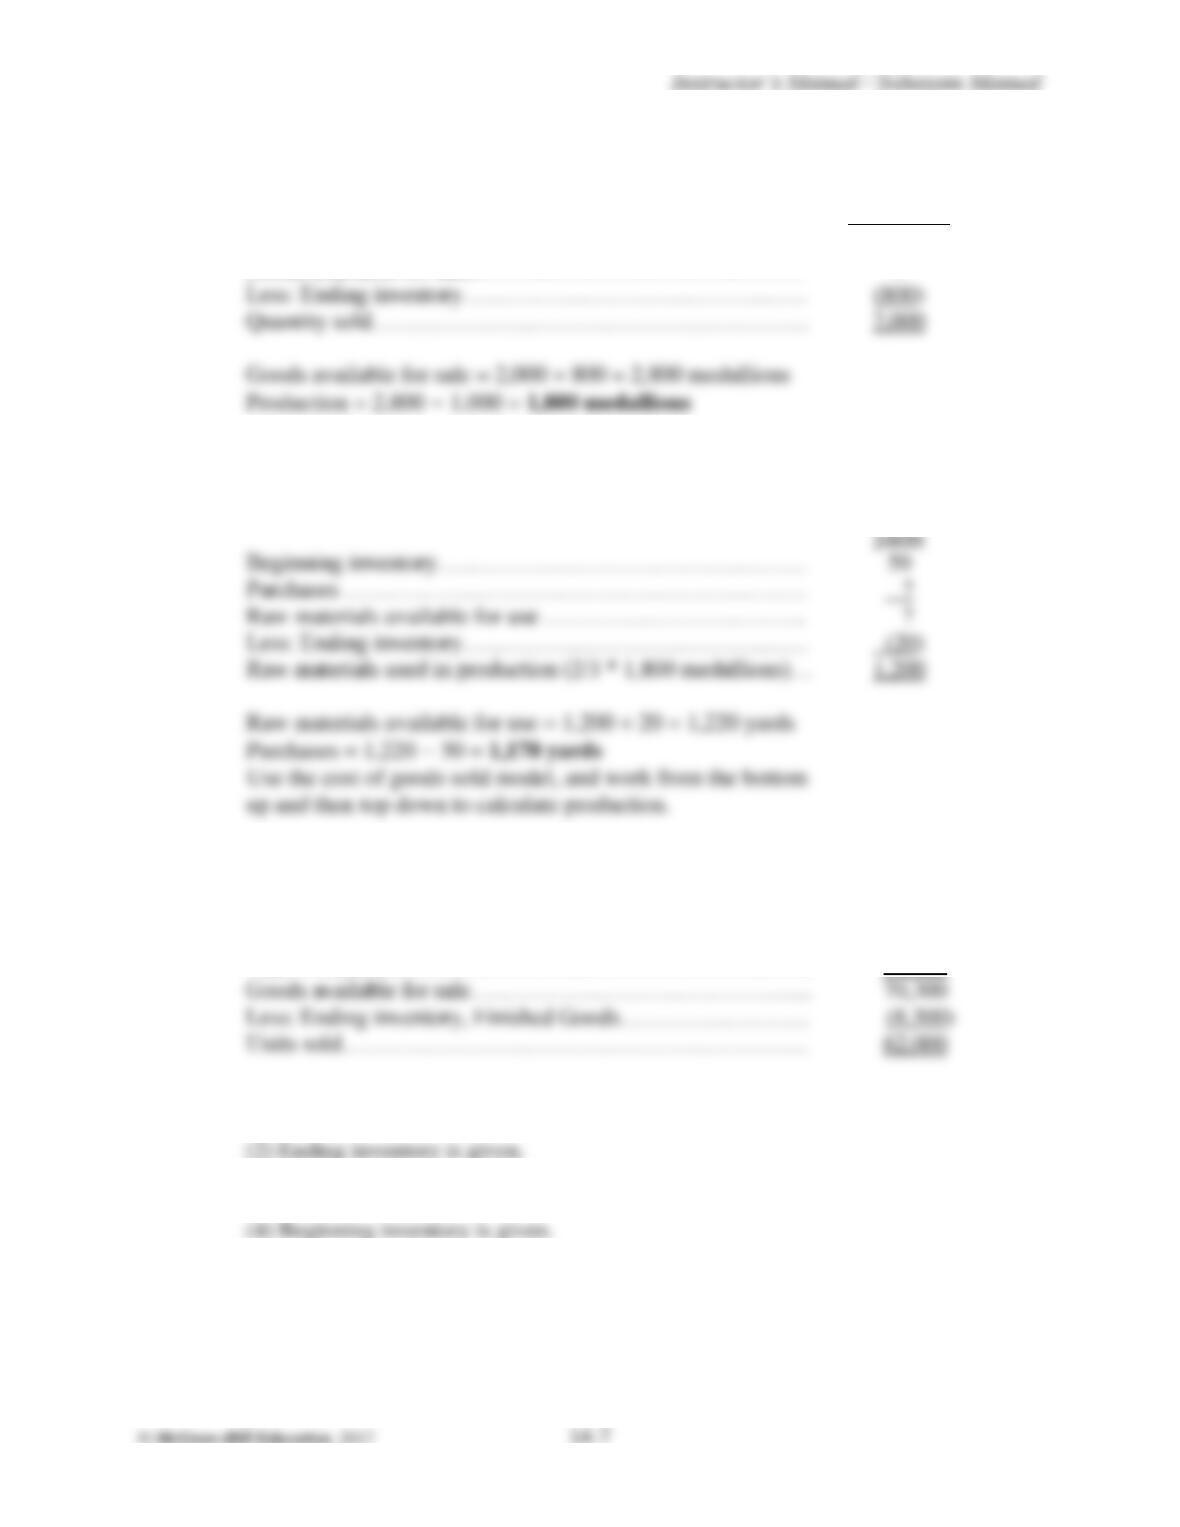
E14.7.
a.
Use the cost of goods sold model, and work from the bottom
up and then top down to calculate production:
medallions
Beginning inventory…………………………………………
1,000
Goods available for sale..……………………………………
?
Less: Ending inventory………………………………………
(800)
Quantity sold…………………………………………………
2,000
Goods available for sale = 2,000 + 800 = 2,800 medallions
b.
Use the same approach, but notice that quantity used is a
function of quantity produced from the production budget.
Each medallion requires 2/3 of a yard of ribbon.
yards
Beginning inventory…………………………………………
Purchases ……………………………………………………
Raw materials available for use …………………………….
Less: Ending inventory………………………………………
(20)
Raw materials used in production (2/3 * 1,800 medallions)…
1,200
Raw materials available for use = 1,200 + 20 = 1,220 yards
E14.8.
a.
Use the “Cost of Goods Sold” model:
Beginning inventory, Finished Goods………………………..
5,900
Add: Production………………………………………………
64,400
Goods available for sale………………………………………
Less: Ending inventory, Finished Goods…………………….
(8,300)
Units sold…………………………………………………….
Steps:
(1) Units sold based on sales forecast.
(2) Ending inventory is given.
(3) Goods available for sale = units sold (based on sales
forecast) + ending inventory.
(4) Beginning inventory is given.
(5) Production = goods available – beginning inventory.
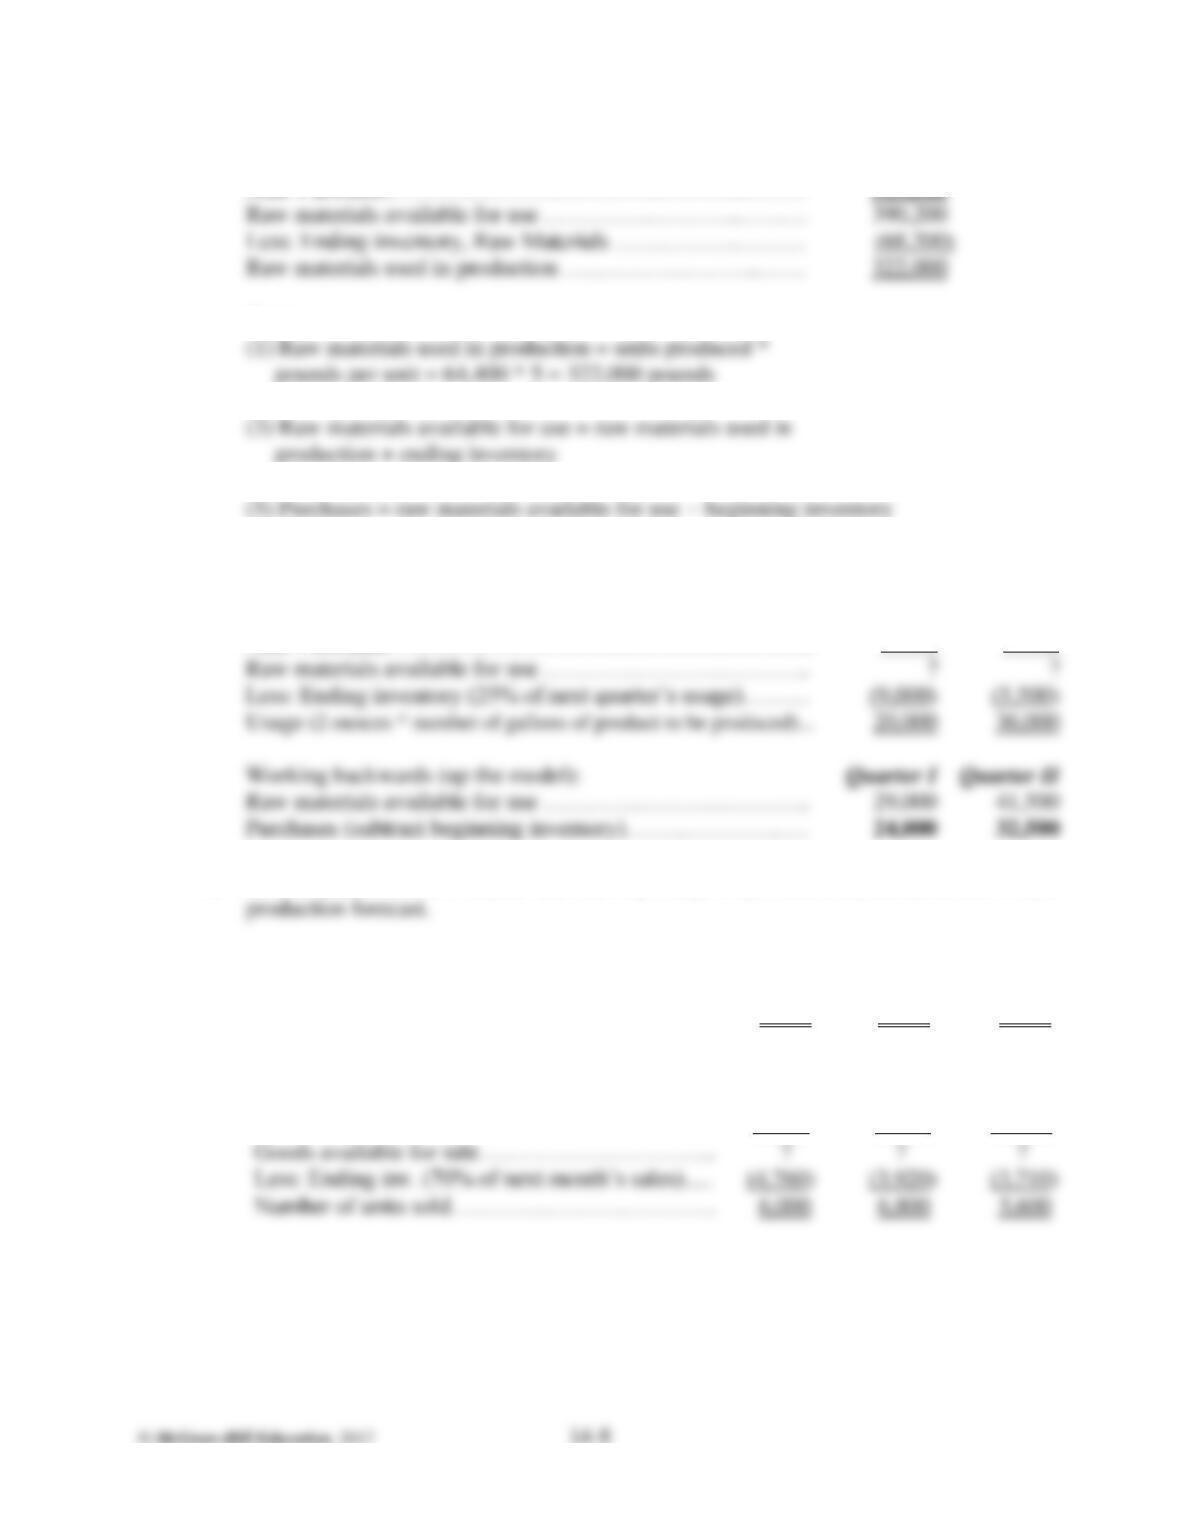
Chapter 14 Cost Planning
E14.8.
(continued)
b.
Beginning inventory, Raw Materials …………………..……
74,700
Add: Purchases………………………………………………
315,500
Raw materials available for use ……………………..………
Less: Ending inventory, Raw Materials …………….………
Raw materials used in production ……………………..……
Steps:
(1) Raw materials used in production = units produced *
pounds per unit = 64,400 * 5 = 322,000 pounds
(2) Ending inventory is given
(3) Raw materials available for use = raw materials used in
production + ending inventory
(4) Beginning inventory is given
E14.9.
a.
Use the raw material inventory/usage model:
Quarter I
Quarter II
Beginning inventory …………………………………………
5,000
9,000
Add: Purchases ………………………………………………
?
?
Raw materials available for use ……………………………..
Less: Ending inventory (25% of next quarter’s usage)………
Usage (2 ounces * number of gallons of product to be produced)…
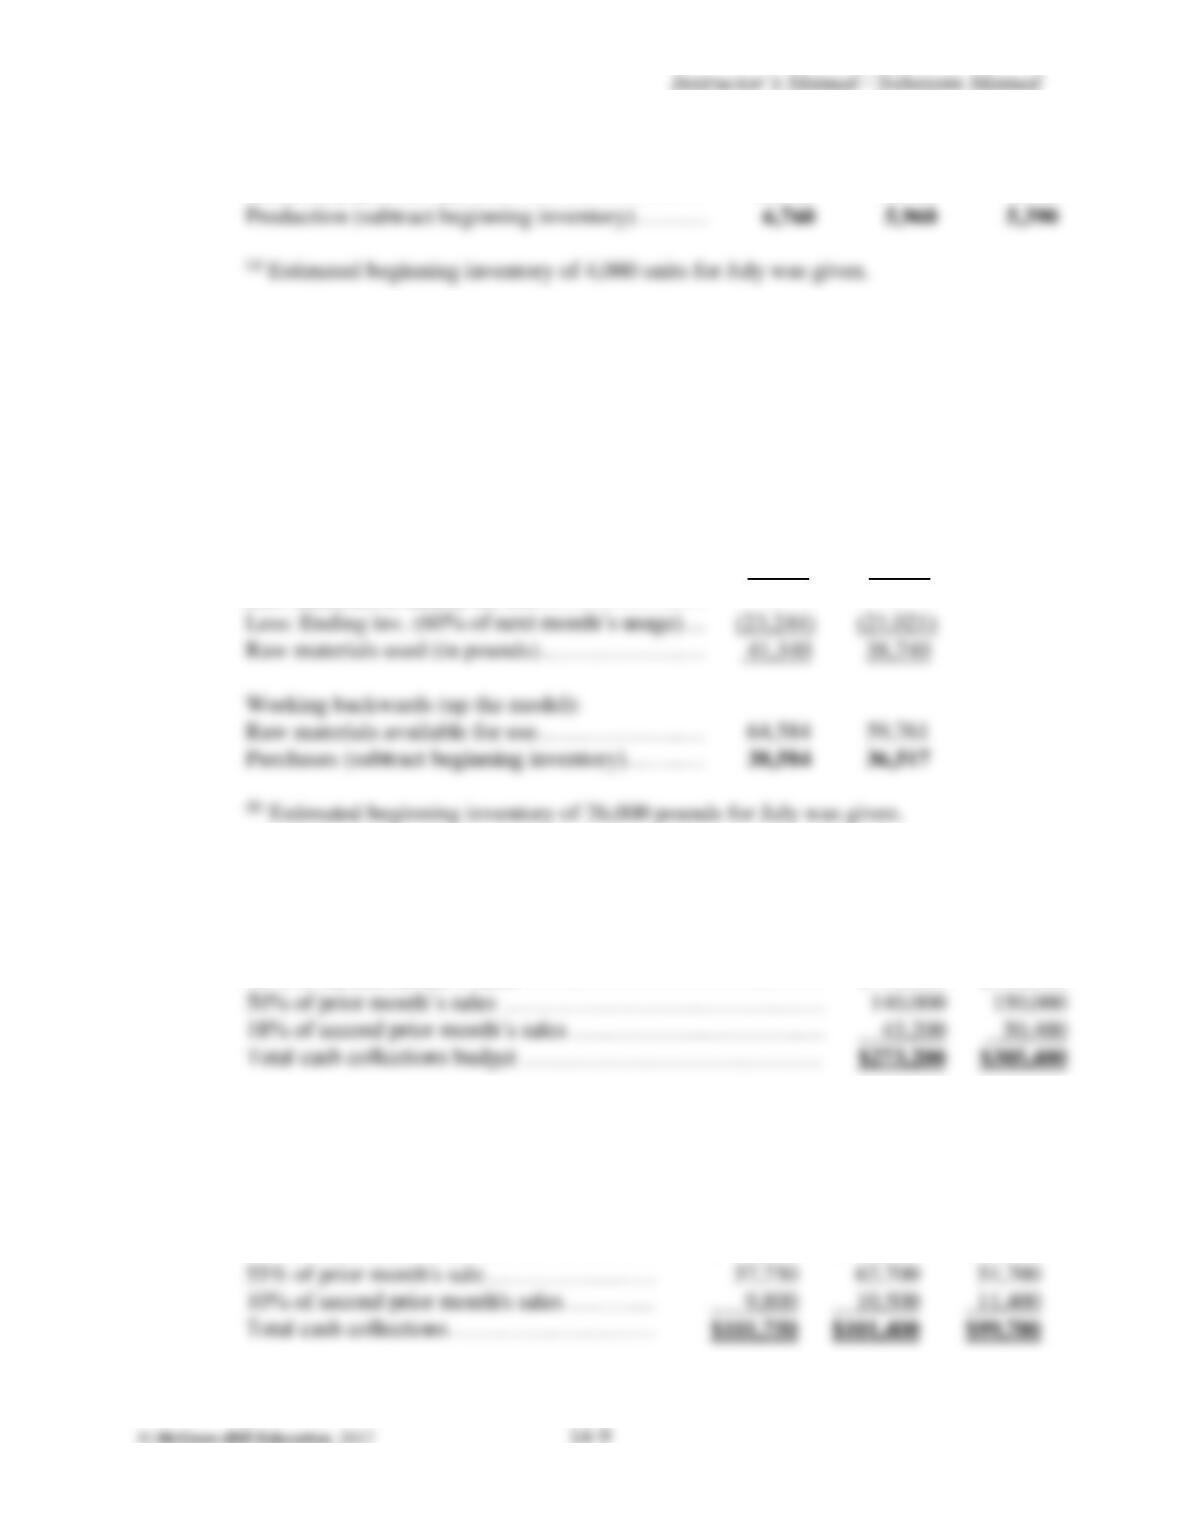
Working backwards (up the model):
Raw materials available for use ……………………………..
Purchases (subtract beginning inventory)……………………
b.
production forecast.
Inventory provides a “cushion” for delivery delays or production needs in excess of the
E14.10.
a.
July
August
September
Sales forecast (units)
6,000
6,800
5,600
Production forecast (analysis of finished goods inventory):
Beginning inv. (70% of current month’s sales)…..
4,000 a
4,760
3,920
Add: Production…………………………………..
? .
? .
? .
Less: Ending inv. (70% of next month’s sales)…..
(3,920)
(3,710)
6,800
5,600
E14.10.
(continued)
Working backwards (up the model):
July
August
September
Goods available for sale……………………………
10,760
10,720
9,310
Production (subtract beginning inventory)…….…
b.
For raw materials purchases, the model is similar, but keys on the production forecast
and raw materials inventory instead of the sales forecast and finished goods inventory.
July
August
September
Production forecast (units)…………………..……
6,360
5,960
5,390
Raw materials used (6.5 pounds per unit)……..…
41,340
38,740
35,035
Purchases forecast (analysis of raw materials inventory):
Beginning inv. (60% of current month’s usage)...
26,000 b
23,244
Purchases (in pounds)….…………………………
? .
? .
Raw materials available for use………………..…
?
?
Less: Ending inv. (60% of next month’s usage)....
(23,244)
Raw materials used (in pounds)………………..…
38,740
Working backwards (up the model):
Raw materials available for use………………..…
64,584
59,761
Purchases (subtract beginning inventory)…………
E14.11.
May
June
July
August
Sales forecast…………………………
$240,000
$280,000
$300,000
$350,000
Cash collections:
30% of current month’s sales …………………………………
$ 90,000
$105,000
150,000
18% of second prior month’s sales ……………………………
43,200
E14.12.
July
August
September
October
November
Actual sales
$98,000
$105,000
Sales forecast
$114,000
$94,000
$122,000
Cash collections:
30% of sales made in the current month……
$ 34,200
$ 28,200
$36,600
55% of prior month’s sale……………………
9,800
10,500
11,400
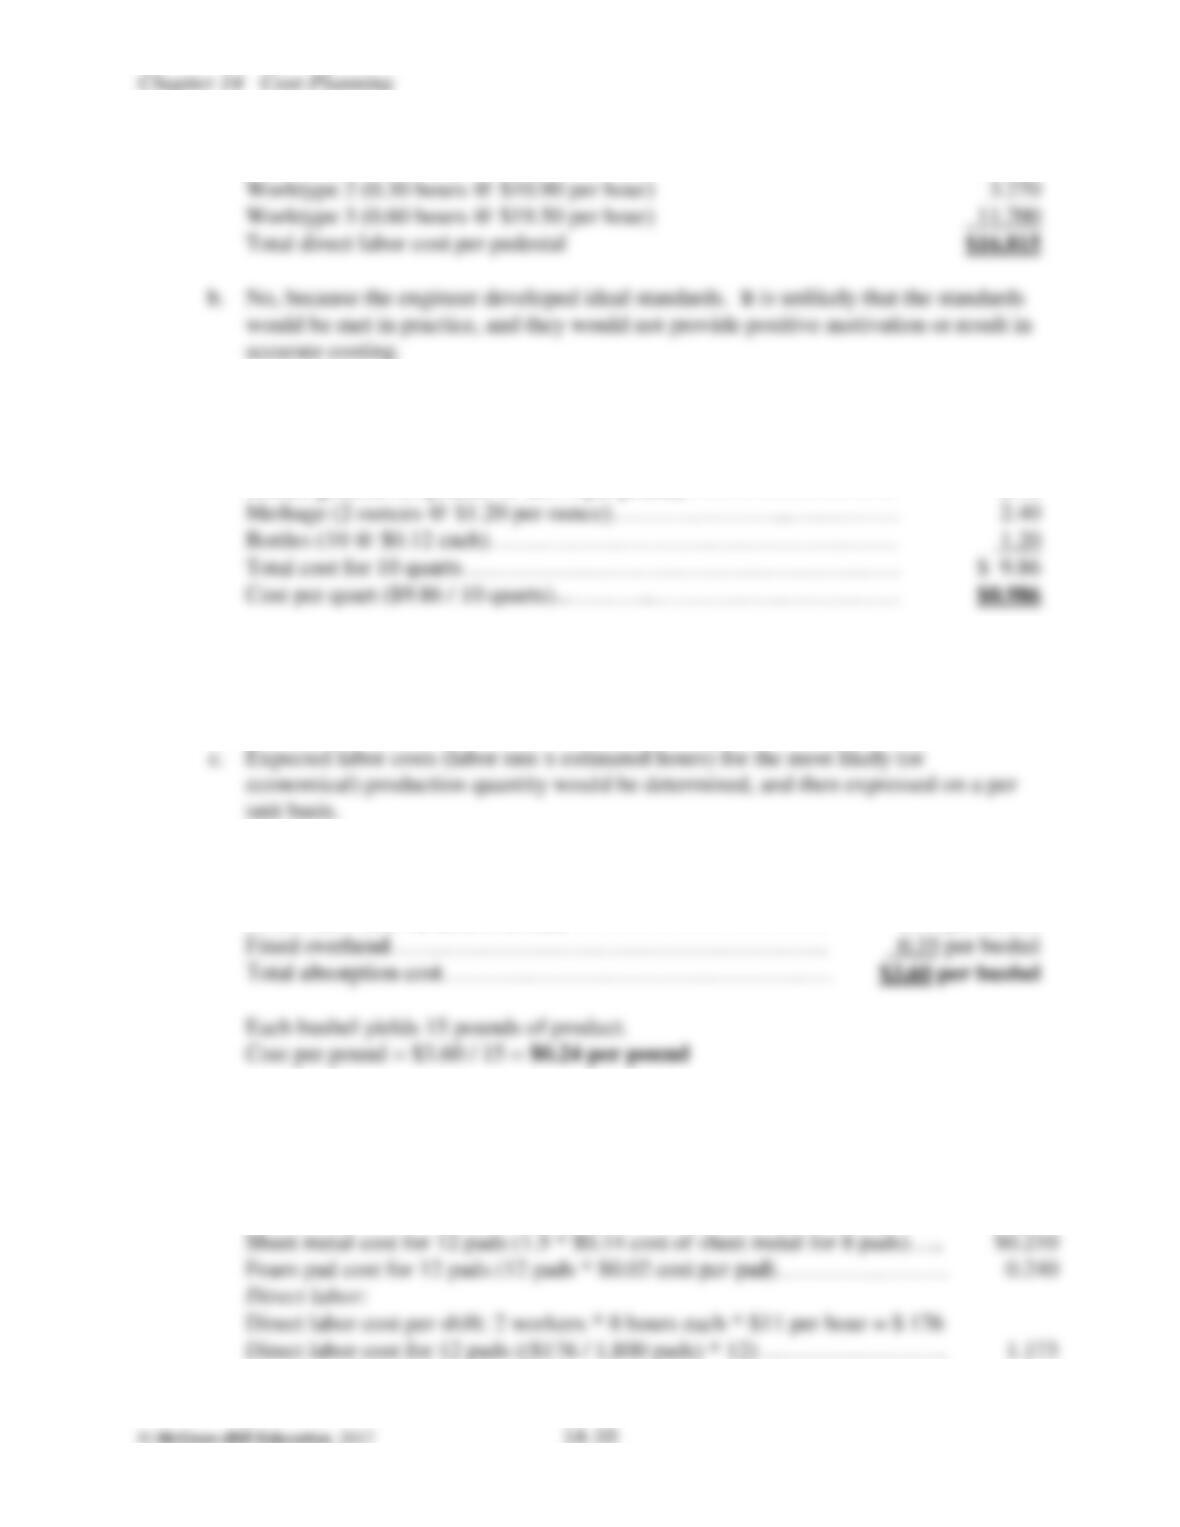
E14.13.
a.
Worktype 1 (0.15 hours @ $12.30 per hour)
$ 1.845
Worktype 2 (0.30 hours @ $10.90 per hour)
Worktype 3 (0.60 hours @ $19.50 per hour)
Total direct labor cost per pedestal
E14.14.
a.
Costs for a “batch” of 10 quarts:
Triphate solution (11 quarts @ $0.30 per quart) ………………………
$ 3.30
Sobase granules (4 pounds @ $0.74 per pound) ………………………
2.96
Methage (2 ounces @ $1.20 per ounce)…………………………………
2.40
Bottles (10 @ $0.12 each)………………………………………………
Total cost for 10 quarts…………………………………………………
$ 9.86
Cost per quart ($9.86 / 10 quarts)…………..……………………………
b.
Other factors to be considered:
1. Possible cost increases during coming year.
2. Spillage / spoilage / waste in the manufacturing process.
E14.15.
a.
Raw material cost………………………………………………
$2.83 per bushel
Direct labor and variable overhead ……………………………
0.42 per bushel
Fixed overhead…………………………………………………
0.35 per bushel
b.
This cost per pound is not very useful for management planning and control because it
includes unitized fixed expenses, which do not behave on a per unit basis.
E14.16.
a.
Raw materials:
Sheet metal cost for 12 pads (1.5 * $0.14 cost of sheet metal for 8 pads)…..
Foam pad cost for 12 pads (12 pads * $0.02 cost per pad)..…………………