Chapter 13 Cost Accounting and Reporting
C13.30.
(continued)
d.
Raw Materials Inventory
BI 39,000
Purchases 240,000 ? Raw materials used during the year
e.
Direct labor hours worked during the year
= ($480,000 direct labor costs incurred / $16.00 per hour direct labor rate)
= 30,000 direct labor hours
Variable manufacturing overhead applied to work in process
= (30,000 direct labor hours * $6 per hour) = $180,000
f.
Fixed manufacturing overhead applied to work in process
= (88,000 machine hours * $3.25 per hour) = $286,000
depreciation, property taxes, maintenance, etc. It is possible that Custom Granite could
addition, Custom Granite planned to spread fixed overhead to the units produced based
on working 96,000 machine hours, and if the company incurs more or less than 96,000
Yes, the amount of fixed overhead applied to work in process during the year could be
different from the amount actually incurred for two reasons. The cost category of fixed
overhead is comprised of many individual cost items such as supervisor salaries,
C13.30.
(continued)
g.
Analysis of the Work in Process Inventory account:
Beginning balance ………………………………………………………
$ 33,000
Add: Raw materials used ………………………..………………………
252,000
Direct labor ……………………………..…………………………
480,000
Fixed manufacturing overhead applied….…………………………
286,000
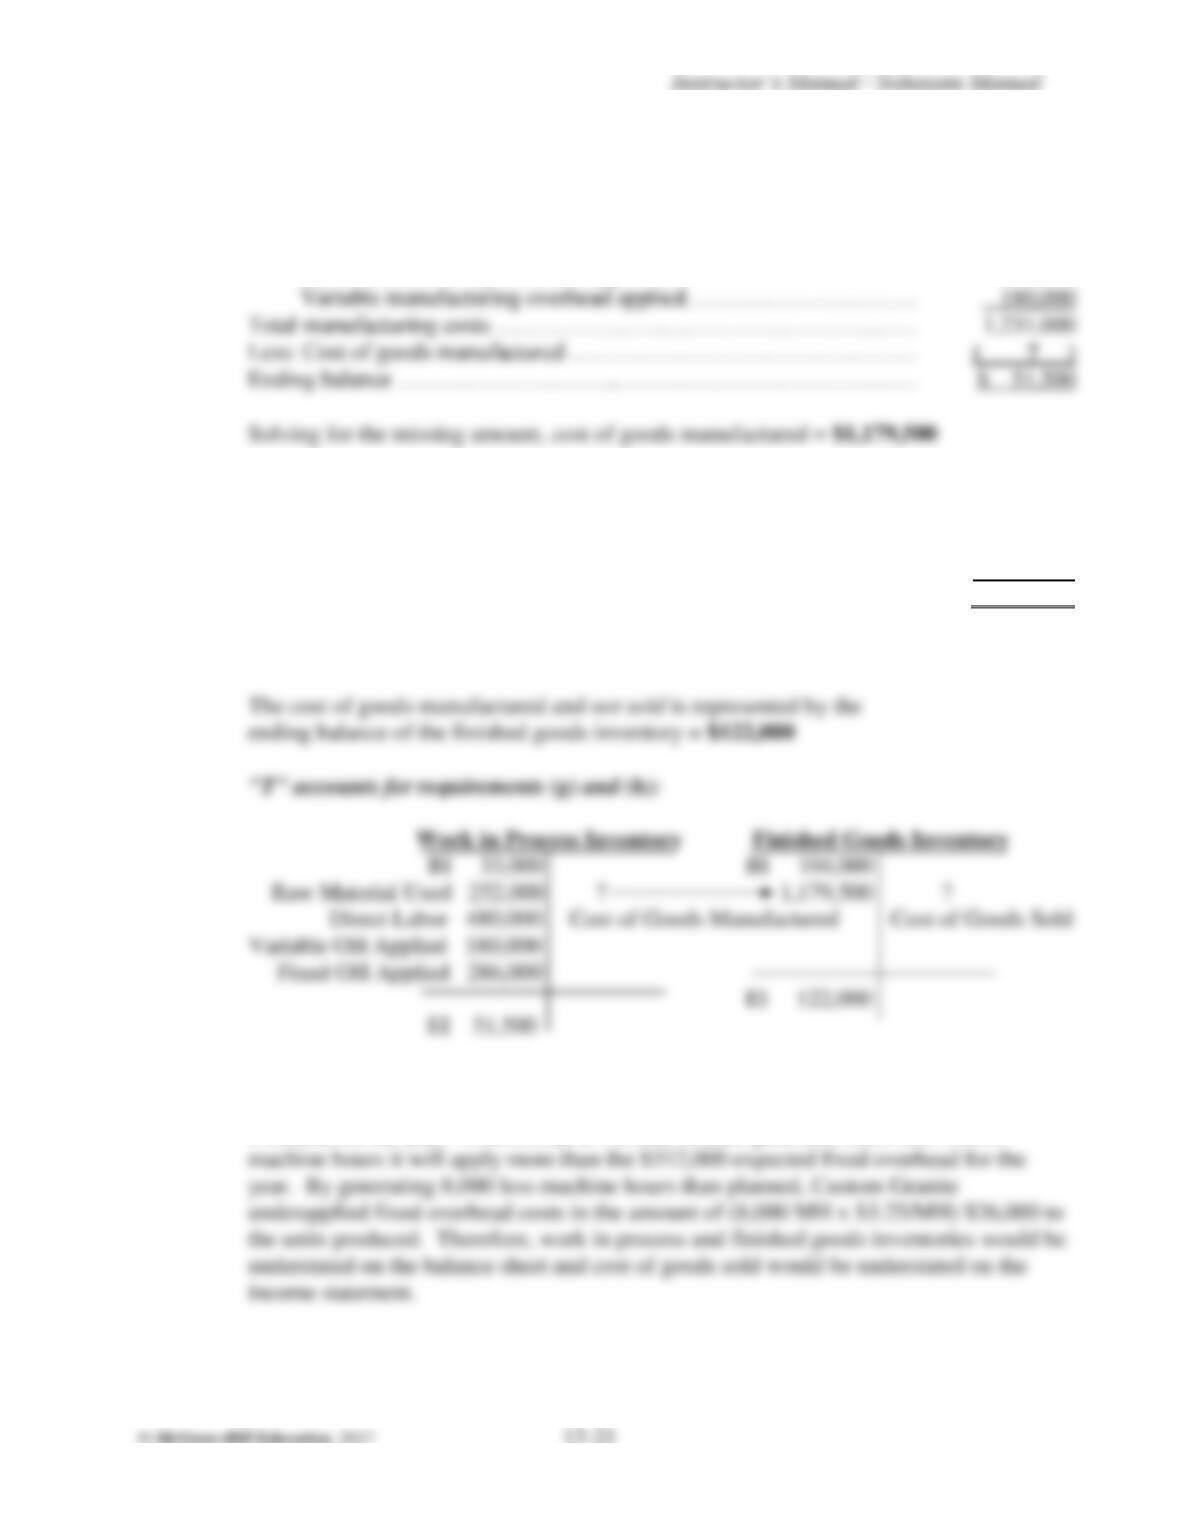
Variable manufacturing overhead applied…………………………
1,231,000
Less: Cost of goods manufactured ………………………………………
( ? )
Ending balance ………………………..…………………………………
Solving for the missing amount, cost of goods manufactured = $1,179,500
h.
Analysis of the Finished Goods Inventory account:
Beginning balance
$ 104,000
Add: Cost of goods manufactured
1,179,500
Less: Cost of goods sold
( ? )
Ending balance
$ 122,000
Solving for the missing amount, cost of goods sold = $1,161,500
i.
Observing the graph in requirement (b) illustrates that when Custom Granite generates
less than 96,000 machine hours, it will not apply the $312,000 amount of expected fixed
overhead for the year. Conversely, if Custom Granite generates more that 96,000
C13.31.
2014
2012
2011
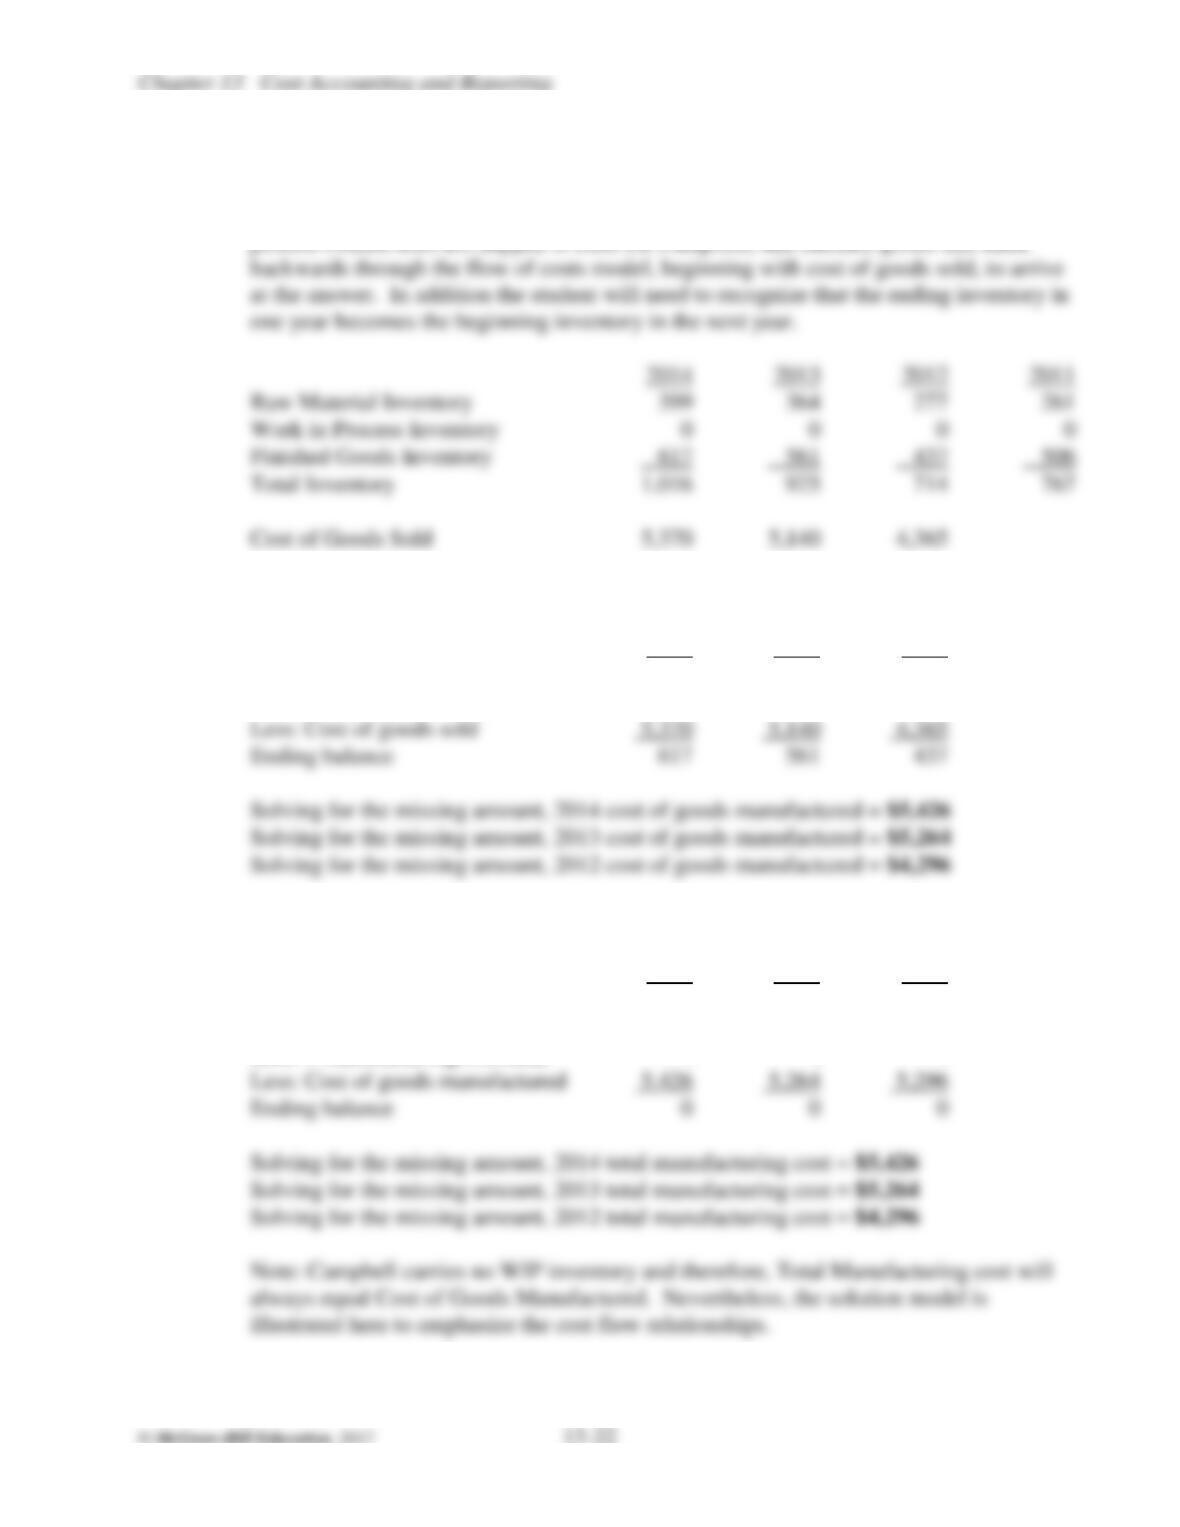
Raw Material Inventory
399
277
261
Work in Process Inventory
Finished Goods Inventory
Total Inventory
Cost of Goods Sold
For requirements a and b, the following information is used from the 2014, 2013, and
2012 annual reports for Campbell Soup Company (amounts are in millions). The
student will need to recognize the relationship of the inventory amounts for work in
process (which does not happen to exist for Campbell) and finished goods and think
a.
Analysis of the Finished Goods Inventory account (working backwards):
2014
2013
2012
Beginning balance
561
437
506
Add: Cost of goods manufactured
?
?
?
Less: Cost of goods sold
Ending balance
b.
Analysis of the Work in Process Inventory account (working backwards):
2014
2013
2012
Beginning balance
0
0
0
Add: Cost of raw material + direct
labor + manufacturing overhead
?
?
?
Less: Cost of goods manufactured
Ending balance
0
0
0
C13.31.
(continued)
c.
The 2014 management discussion and analysis of financial condition and results of
operations provides the following ratios for gross profit (Net Sales – Cost of products
sold) a percentage of net revenue for the years 2014, 2013, and 2012. Cost of sales can
therefore be calculated as:
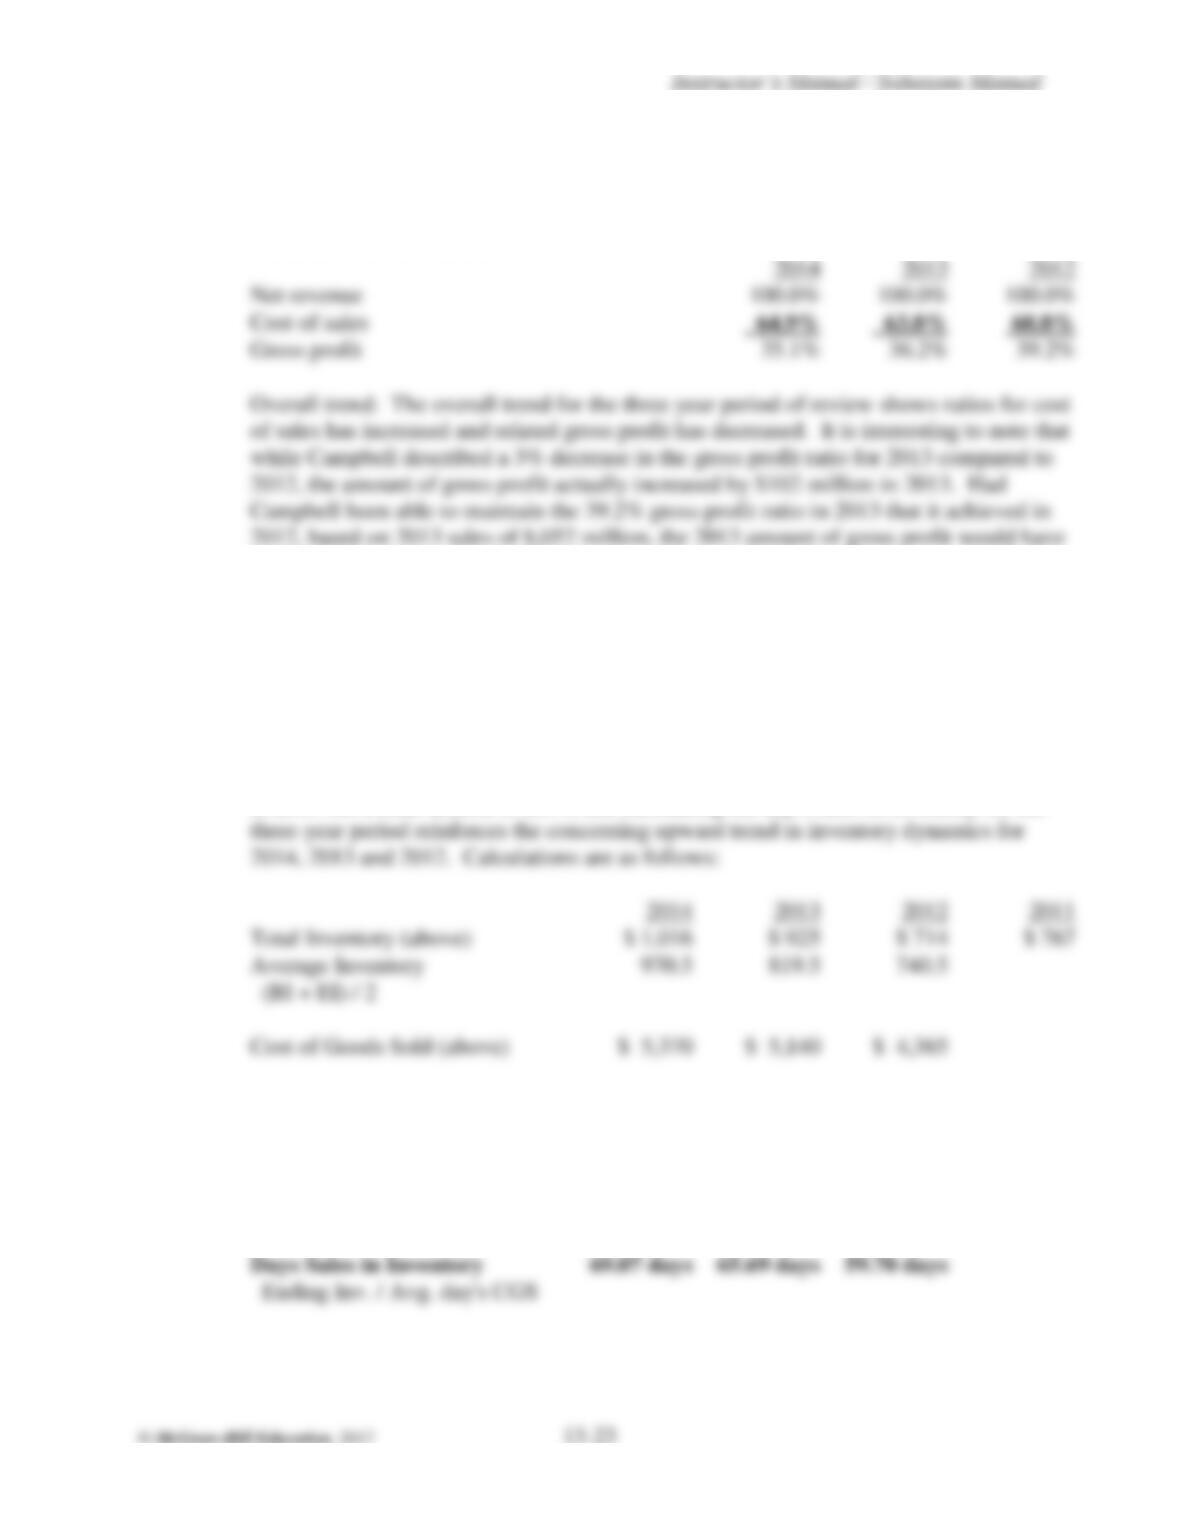
Net revenue
Cost of sales
Gross profit
increased by $343 million. A 3% decline in the gross profit ratio may not appear on the
surface as a significant decline, but in this case it amounted to a decline gross profit of
$241 million. Management attributes the three year decline in the gross profit ratio to
cost inflation of supply chain costs and other factors, a higher level of promotional
spending, and the impact of acquisitions.
d.
Total Inventory (above)
Average Inventory
(BI + EI) / 2
Cost of Goods Sold (above)
Overall trend: The swing in inventory levels over the three-year period is trending up
where both raw material and finished goods inventories have increased rather
significantly. Calculating the three-year inventory turnover trend indicates improvement
in 2013 but a clear decline in 2014, and calculating the day’s sales in inventory for the
Inventory Turnover
5.53 times
6.27 times
5.89 times
CGS / Avg. Inv.
Average Day’s CGS
$ 14.71
$ 14.08
$ 11.96
CGS / 365
Days Sales in Inventory
Ending Inv. / Avg. day’s CGS
C13-32.
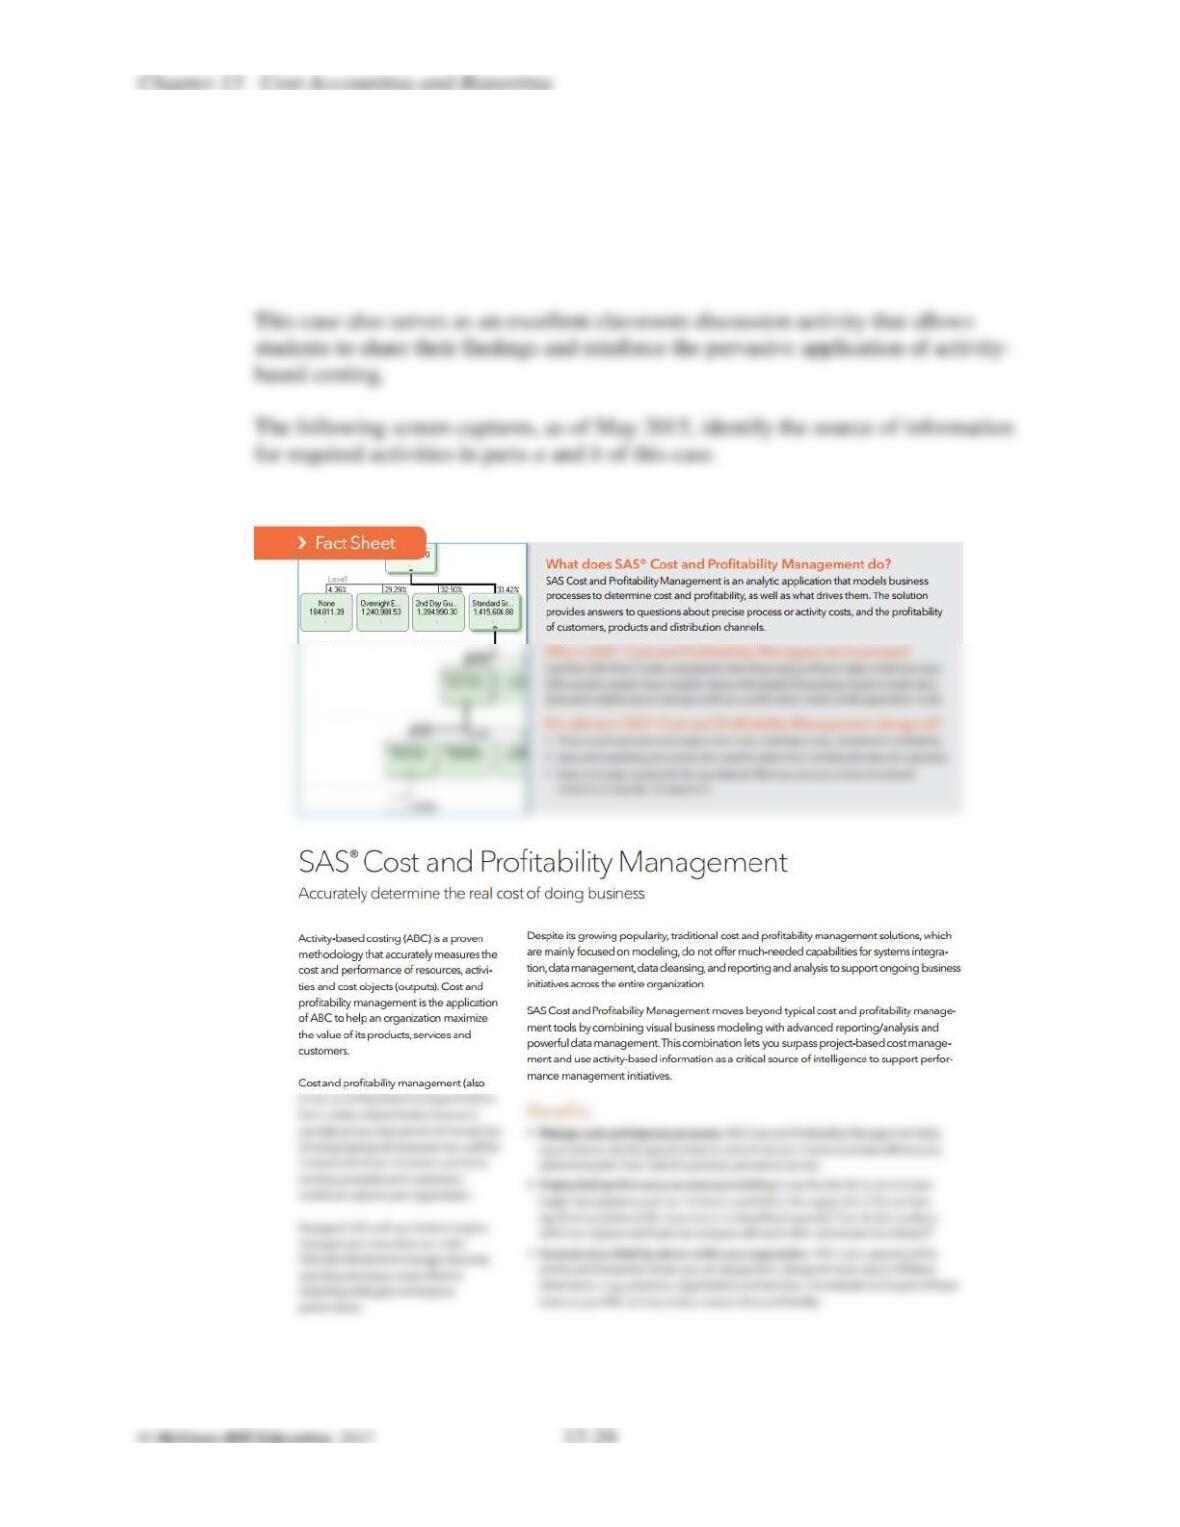
Note to instructor: The purpose of the case is to make students aware of the
practical applications of activity-based costing by having them read, summarize,
compare, and communicate the results of their findings. SAS presents information
about their software solution and testimonials from companies in the several
industries who have successfully implemented activity-based costing.
for required activities in parts a and b of this case.
a.
Activity-Based Management Fact Sheet:
C13.32.
(continued)
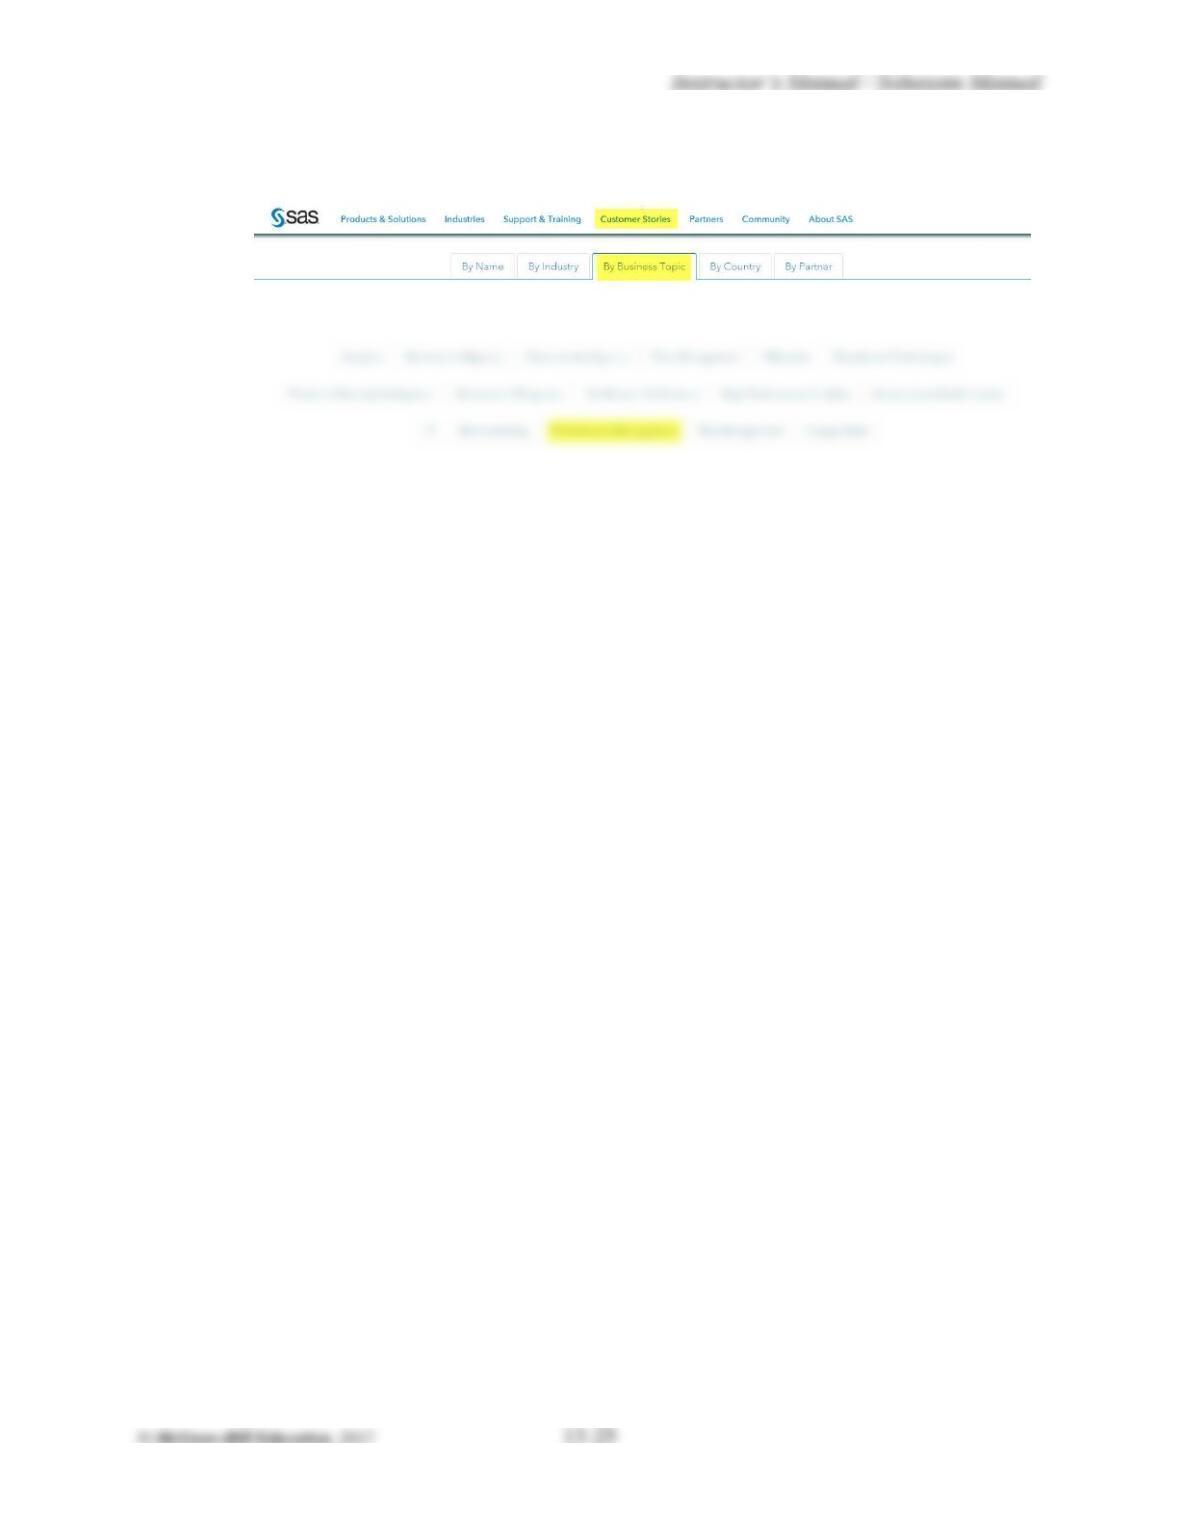
b.
Activity-Based Management Success Stories:
Chapter 13 Cost Accounting and Reporting
TAKE-HOME QUIZ: CHAPTER 13 NAME______________________
1. Gears, Inc., manufactures a single product. During March, 6,700 units of product were
manufactured, and 6,350 units of the product were sold. There were no beginning
inventories. During March, the following costs were incurred:
Raw Materials
$ 76,900
Direct Labor
132,600
Manufacturing Overhead
Selling Expenses
Administrative Expenses
Interest Expense
a. Calculate the total cost of goods manufactured during March, and the average cost of a
single unit of the product.
b. Calculate the cost of goods sold during March.
c. Calculate the ending finished goods inventory for March.
d. Where in the financial statements will the difference between the total cost of goods
manufactured and cost of goods sold be classified?
Instructor’s Manual / Solutions Manual
TAKE-HOME QUIZ KEY: CHAPTER 13
1.
a.
Total manufacturing cost = (Direct materials + Direct labor + Manufacturing
overhead)
Direct materials
……………………………………………………………
$ 76,900
Direct
labor…………………………………………………………………
132,600
overhead……………………………………………………
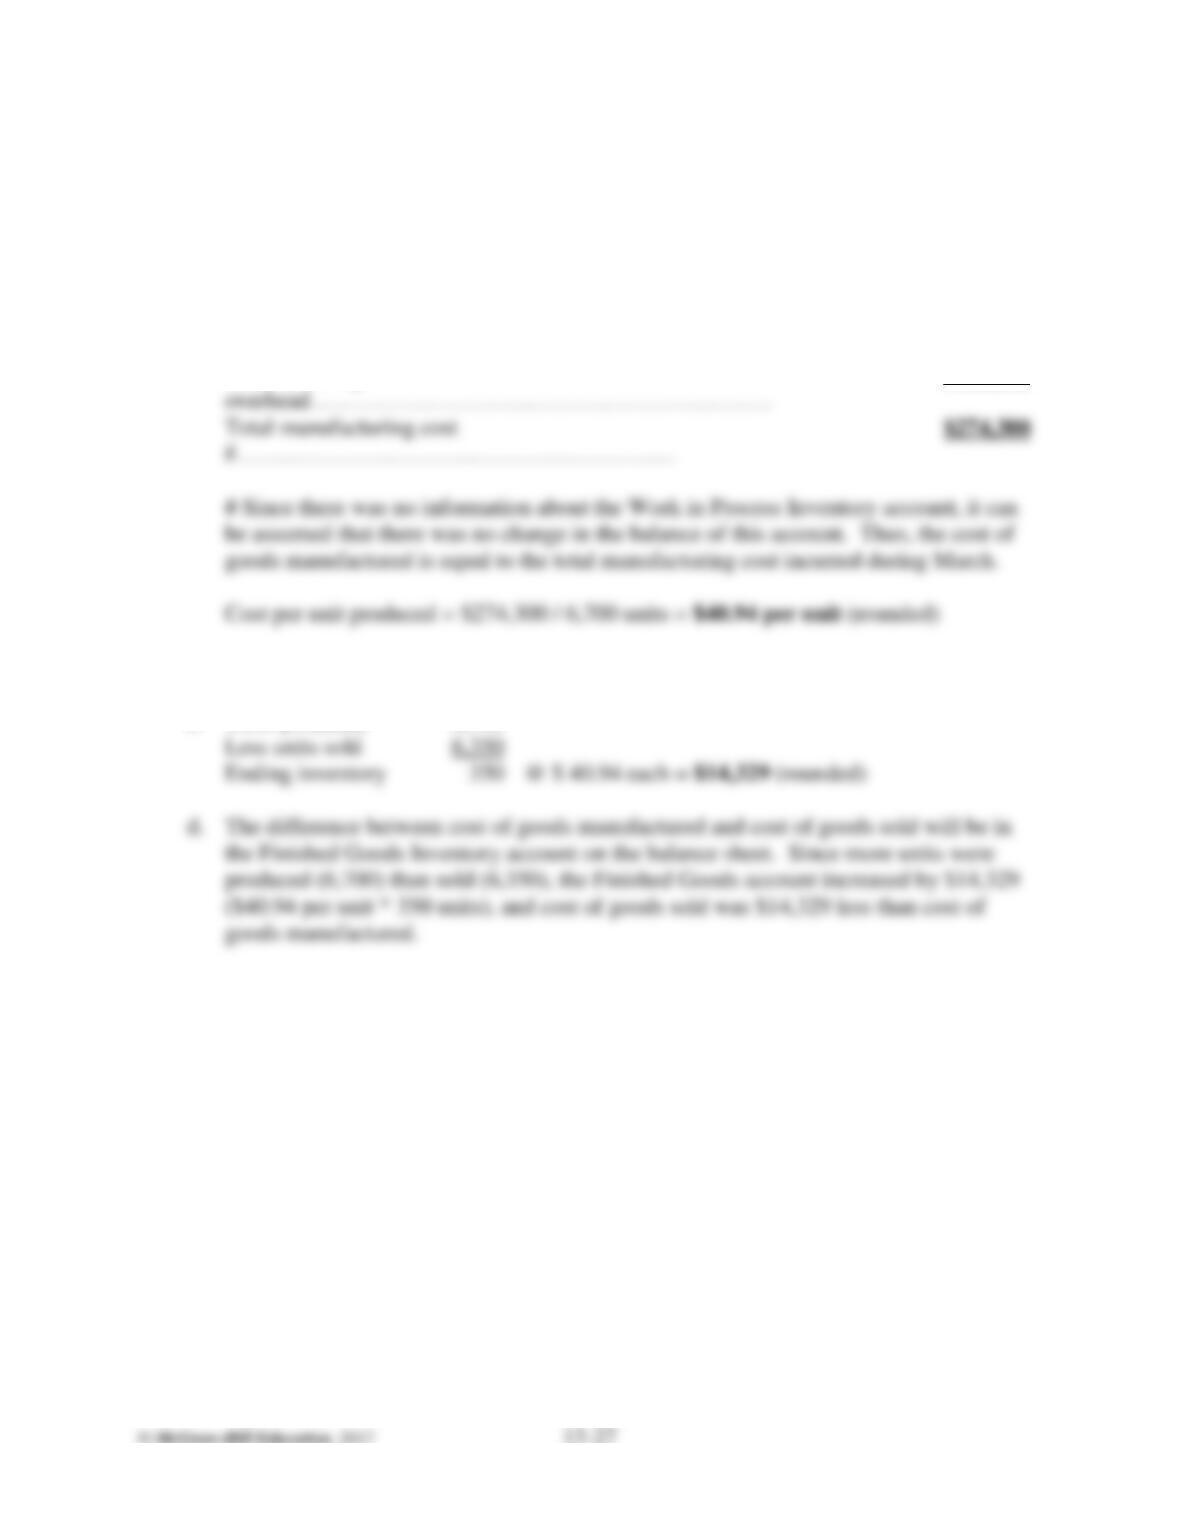
Total manufacturing cost
#…………………………………………………
Cost per unit produced = $274,300 / 6,700 units = $40.94 per unit (rounded)
Manufacturing
64,800
b.
(6,350 units sold @ $ 40.94 each) = $259,969
c.
Units produced
6,700
Less units sold
6,350
Ending inventory
@ $ 40.94 each = $14,329 (rounded)
($40.94 per unit * 350 units), and cost of goods sold was $14,329 less than cost of
goods manufactured.