E13.18.
a.
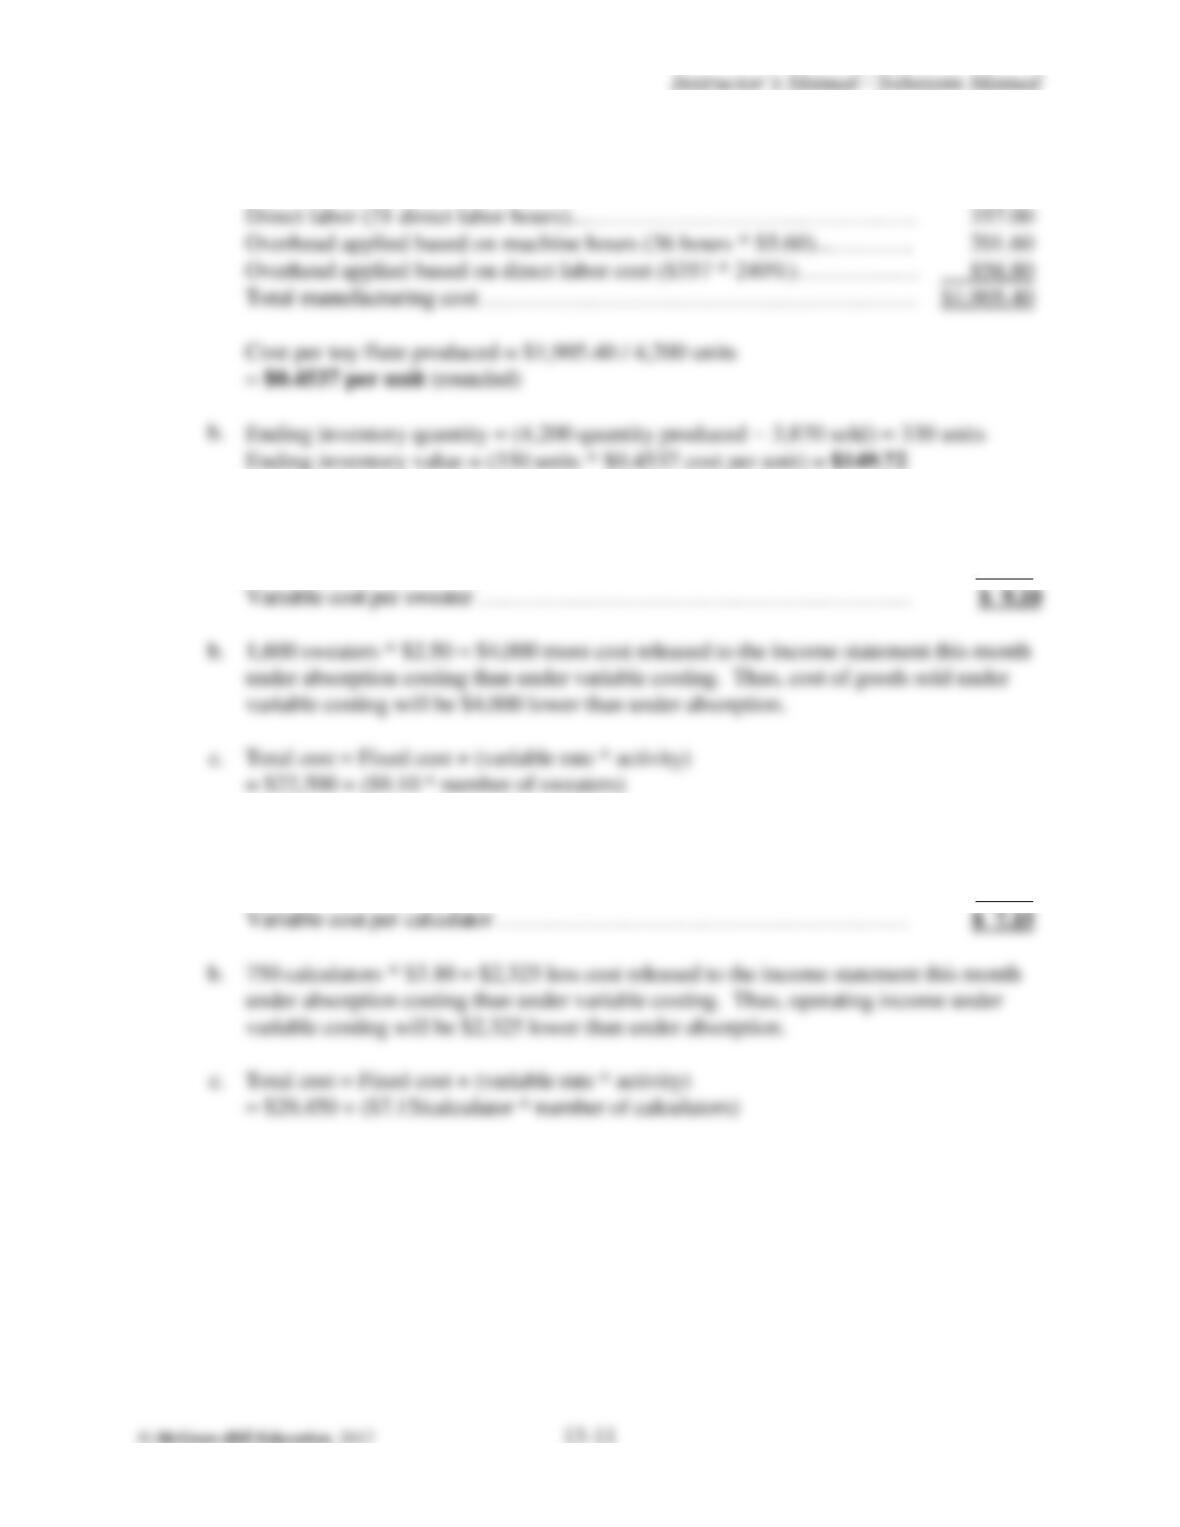
Total cost for 4,200 toy flutes produced:
Raw materials ……………………………………………………………
$490.00
Overhead applied based on machine hours (36 hours * $5.60)…………..
Total manufacturing cost…………………………………………………
Ending inventory quantity = (4,200 quantity produced – 3,870 sold) = 330 units
E13.19.
a.
Absorption cost per sweater ………………………………………………
$11.60
Less: Fixed manufacturing overhead per sweater ($22,500 / 9,000)………
(2.50)
E13.20.
a.
Absorption cost per calculator ……………………………………………
$10.25
Less: Fixed manufacturing overhead per calculator ($29,450 / 9,500)……
(3.10)
Variable cost per calculator ………………………………………………
P13.21.
a.
Total manufacturing cost = (Direct materials + Direct labor + Manufacturing overhead)
Direct materials ………………………………………………..
$3,500,000
Direct labor (160,000 hours * $20 per hour) …………………..
3,200,000
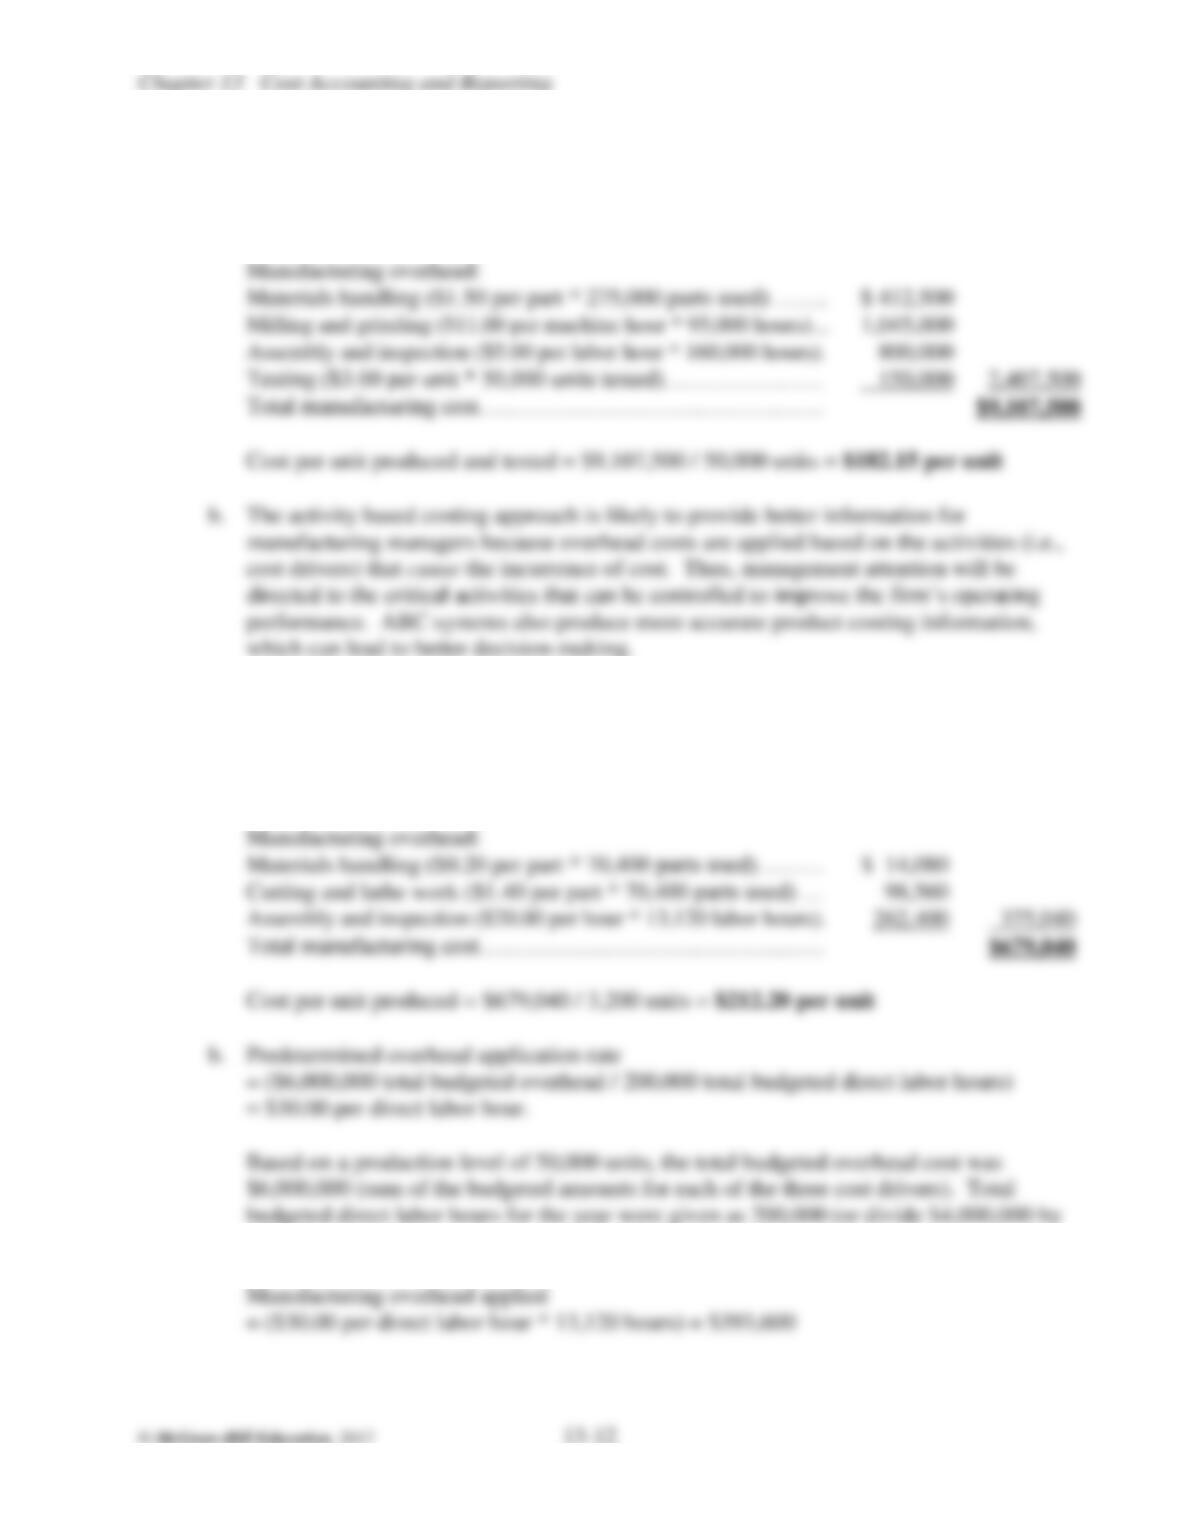
Manufacturing overhead:
Materials handling ($1.50 per part * 275,000 parts used) …….
Milling and grinding ($11.00 per machine hour * 95,000 hours)…
which can lead to better decision-making.
P13.22.
a.
Total manufacturing cost = (Direct materials + Direct labor + Manufacturing overhead)
Direct materials ……………….………………………………
$107,200
Direct labor (13,120 hours * $15 per hour)……………………
196,800
Manufacturing overhead:
Materials handling ($0.20 per part * 70,400 parts used)………
Cutting and lathe work ($1.40 per part * 70,400 parts used) …
Assembly and inspection ($20.00 per hour * 13,120 labor hours).
= $30.00 per direct labor hour.
$20.00 per direct labor hour for assembly and inspection).
P13.22.
(continued)
Total manufacturing cost = (Direct materials + Direct labor + Manufacturing overhead)
= $107,200 + $196,800 + $393,600 = $697,600
Cost per unit produced = $697,600 / 3,200 units = $218.00 per unit
c.
The activity based costing approach is likely to provide better information for
manufacturing managers because overhead costs are applied based on the activities that
cause the incurrence of each cost. Even in this simplified situation, the advantages of an
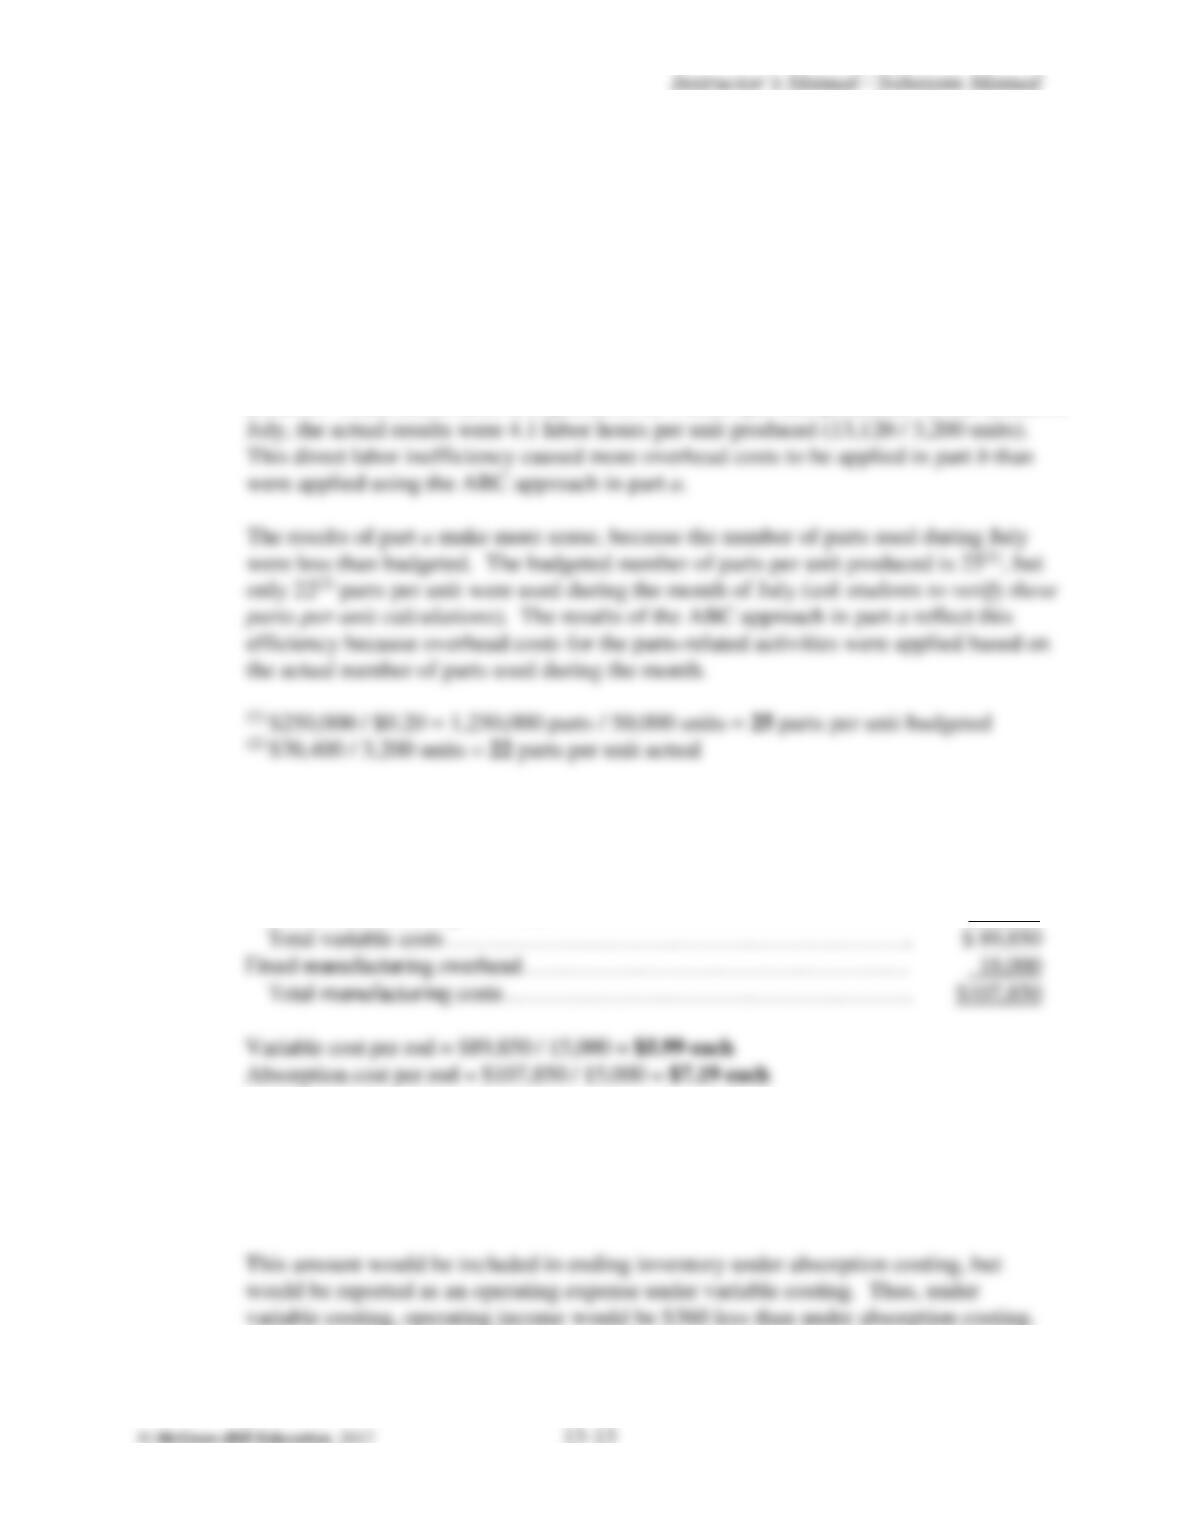
ABC system are easy to see. At 50,000 units of production, budgeted labor hours are
200,000. Thus, direct labor is expected to be 4 hours per unit produced. In the month of
P13.23.
a.
Variable manufacturing costs:
Raw materials …………………………………………………………….
$ 62,100
Direct labor ……………………………………………………………….
16,500
Variable manufacturing overhead…………………………………………
11,250
Fixed manufacturing overhead……………………………………………
18,000
Variable cost per rod = $89,850 / 15,000 = $5.99 each
b.
The fixed cost per rod is $7.19 – $5.99 = $1.20.
This can also be computed as: $18,000 / 15,000 = $1.20.
The total fixed cost associated with the 300 fishing rods in inventory is:
300 * $1.20 = $360.
P13.23.
(continued)
Total cost = $18,000 + $5.99 per fishing rod produced.
P13.24.
a.
Variable manufacturing costs:
Raw materials …………………………..………………………………
$275,200
Direct labor …………………………..…………………………………
454,400
Variable manufacturing overhead…….…………………………………
115,200
Total variable costs ……………..….…………………………………
$844,800
Fixed manufacturing overhead…….….…………………………………
108,800
Total manufacturing costs……….….…………………………………
$953,600
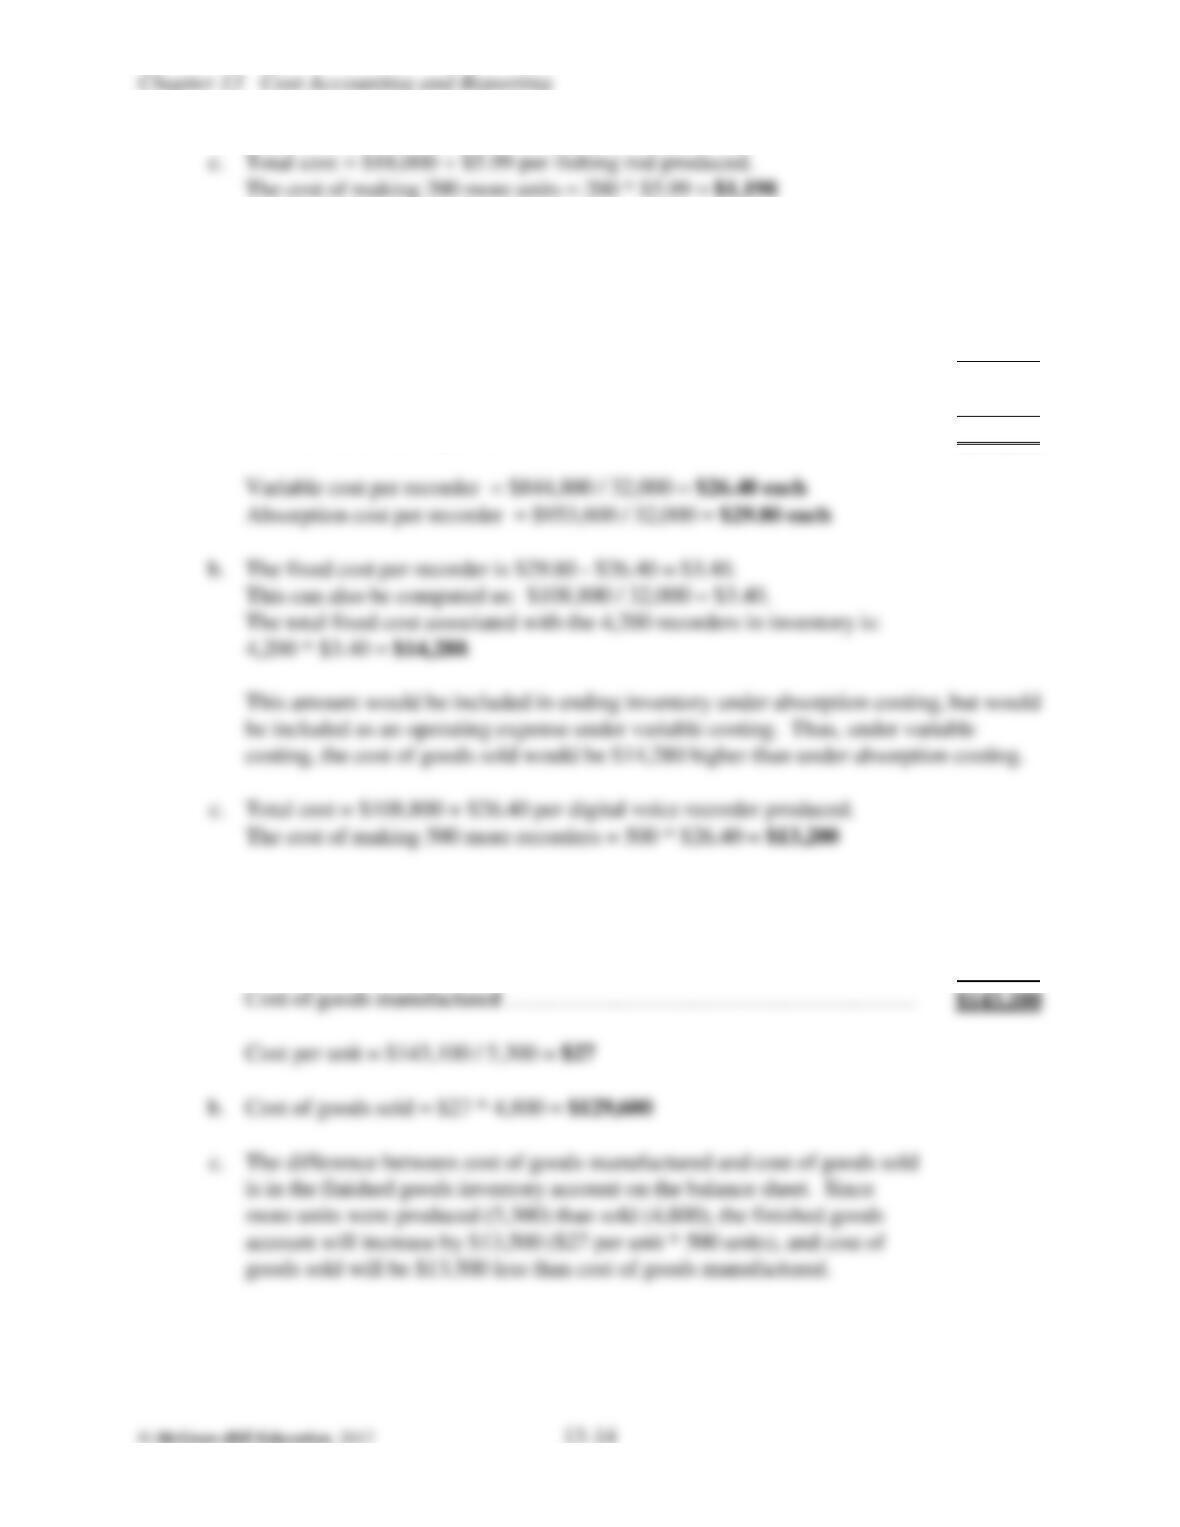
c.
Total cost = $108,800 + $26.40 per digital voice recorder produced.
P13.25.
a.
Raw materials …………………………………………………………….
$ 33,100
Direct labor ……………………………………………………………….
65,200
Manufacturing overhead …………………………………………………
44,800
P13.25.
(continued)
d.
MARYVILLE, INC.
Absorption Income Statement
For the month of August
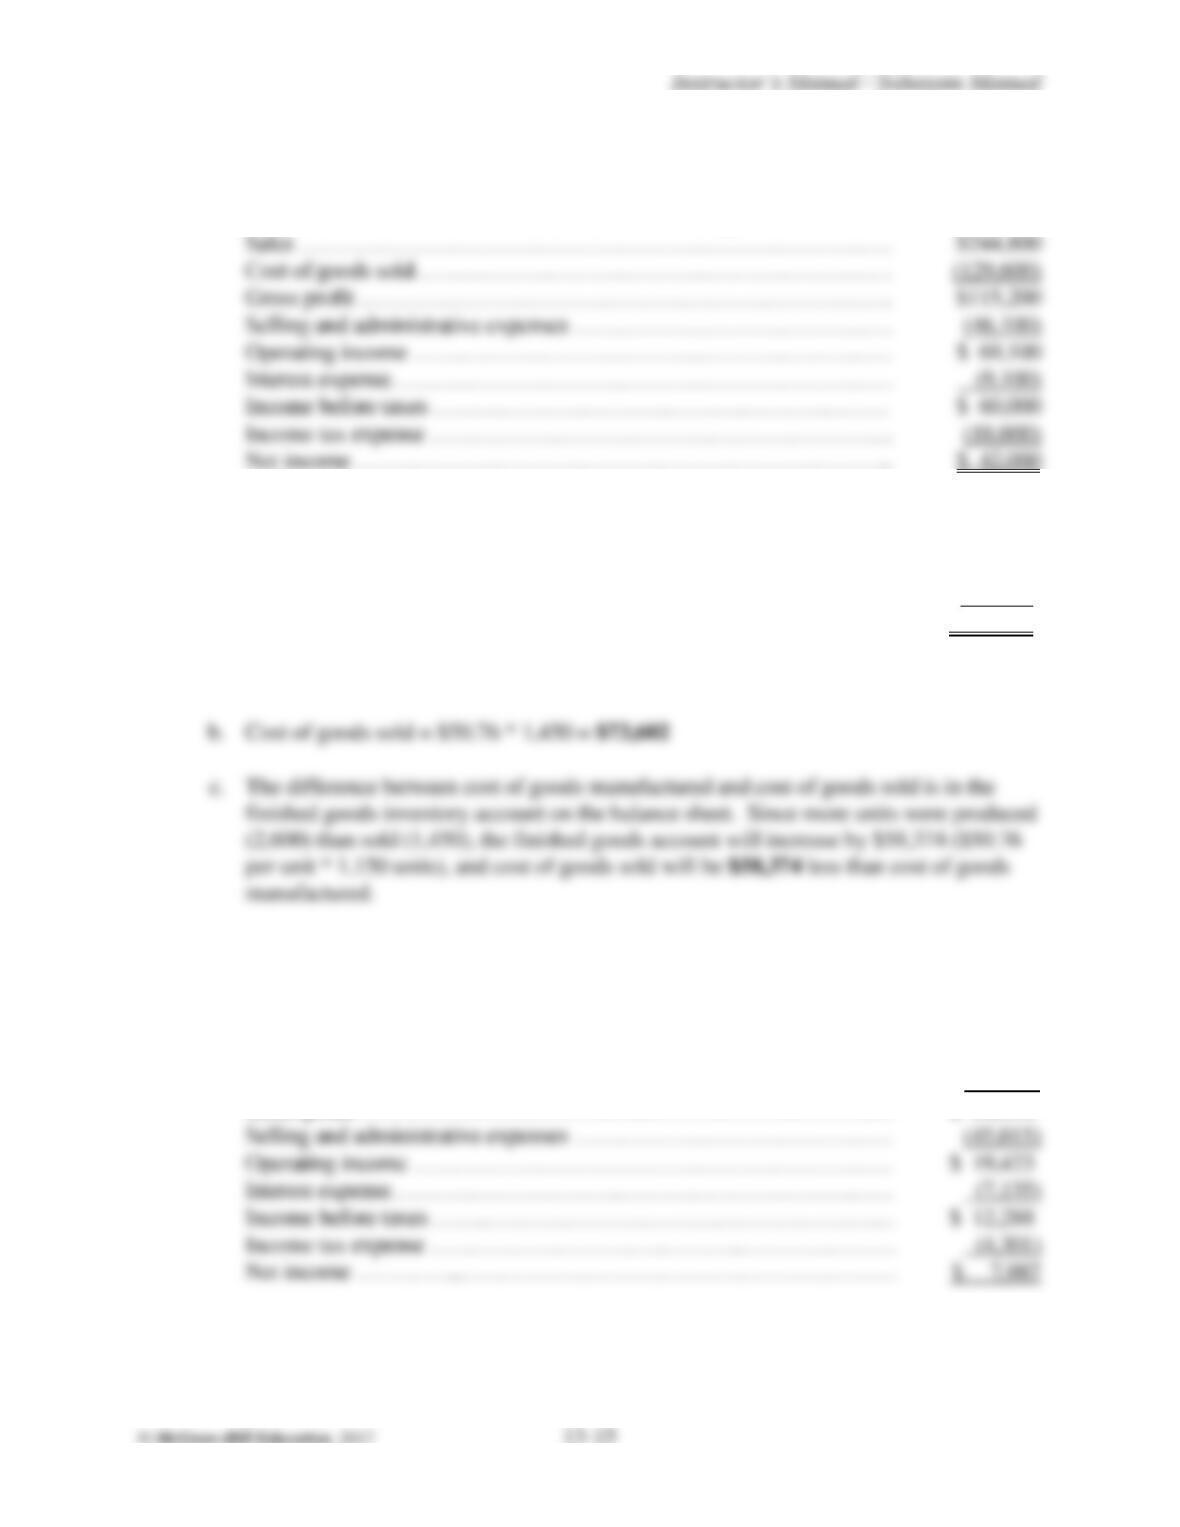
Sales ……………………………………………………………………
Cost of goods sold………………………………………………………
Gross profit …………………………………………………………….
Selling and administrative expenses ……………………………………
Operating income ………………………………………………………
Interest expense…………………………………………………………
Income before taxes ……………………………………………………
Income tax expense …………………………………………………….
Net income ……………………………………………………………..
P13.26.
a.
Raw materials …………………………………………………………...
$ 61,464
Direct labor ……………………………………………………………..
37,752
Manufacturing overhead ……………………………………………….
32,760
Cost of goods manufactured …………………………………………….
$131,976
Cost per unit = $131,976 / 2,600 = $50.76
Cost of goods sold = $50.76 * 1,450 = $73,602
d.
GRANDSLAM, INC.
Absorption Income Statement
For the month of March
Sales ……………………………………………………………………
$138,040
Cost of goods sold………………………………………………………
(73,602)
Gross profit ………………………………..……………………………
$ 64,438
Selling and administrative expenses ……………………………………
(45,015)
Operating income ………………………………………………………
Interest expense…………………………………………………………
Income before taxes …….………………………………………………
$ 12,288
Income tax expense ………………………….……….…………………
Net income …………...…………………………………………………
P13.27.
a.
Note: This problem does not require a formal statement of cost of goods manufactured;
the requirements can be solved using a “T” account approach.
Raw materials:
Inventory, Sept. 30 …………………………………………
$ 33,500
Purchases during October ………………………………….
123,900
Raw materials available for use ……………………………
157,400
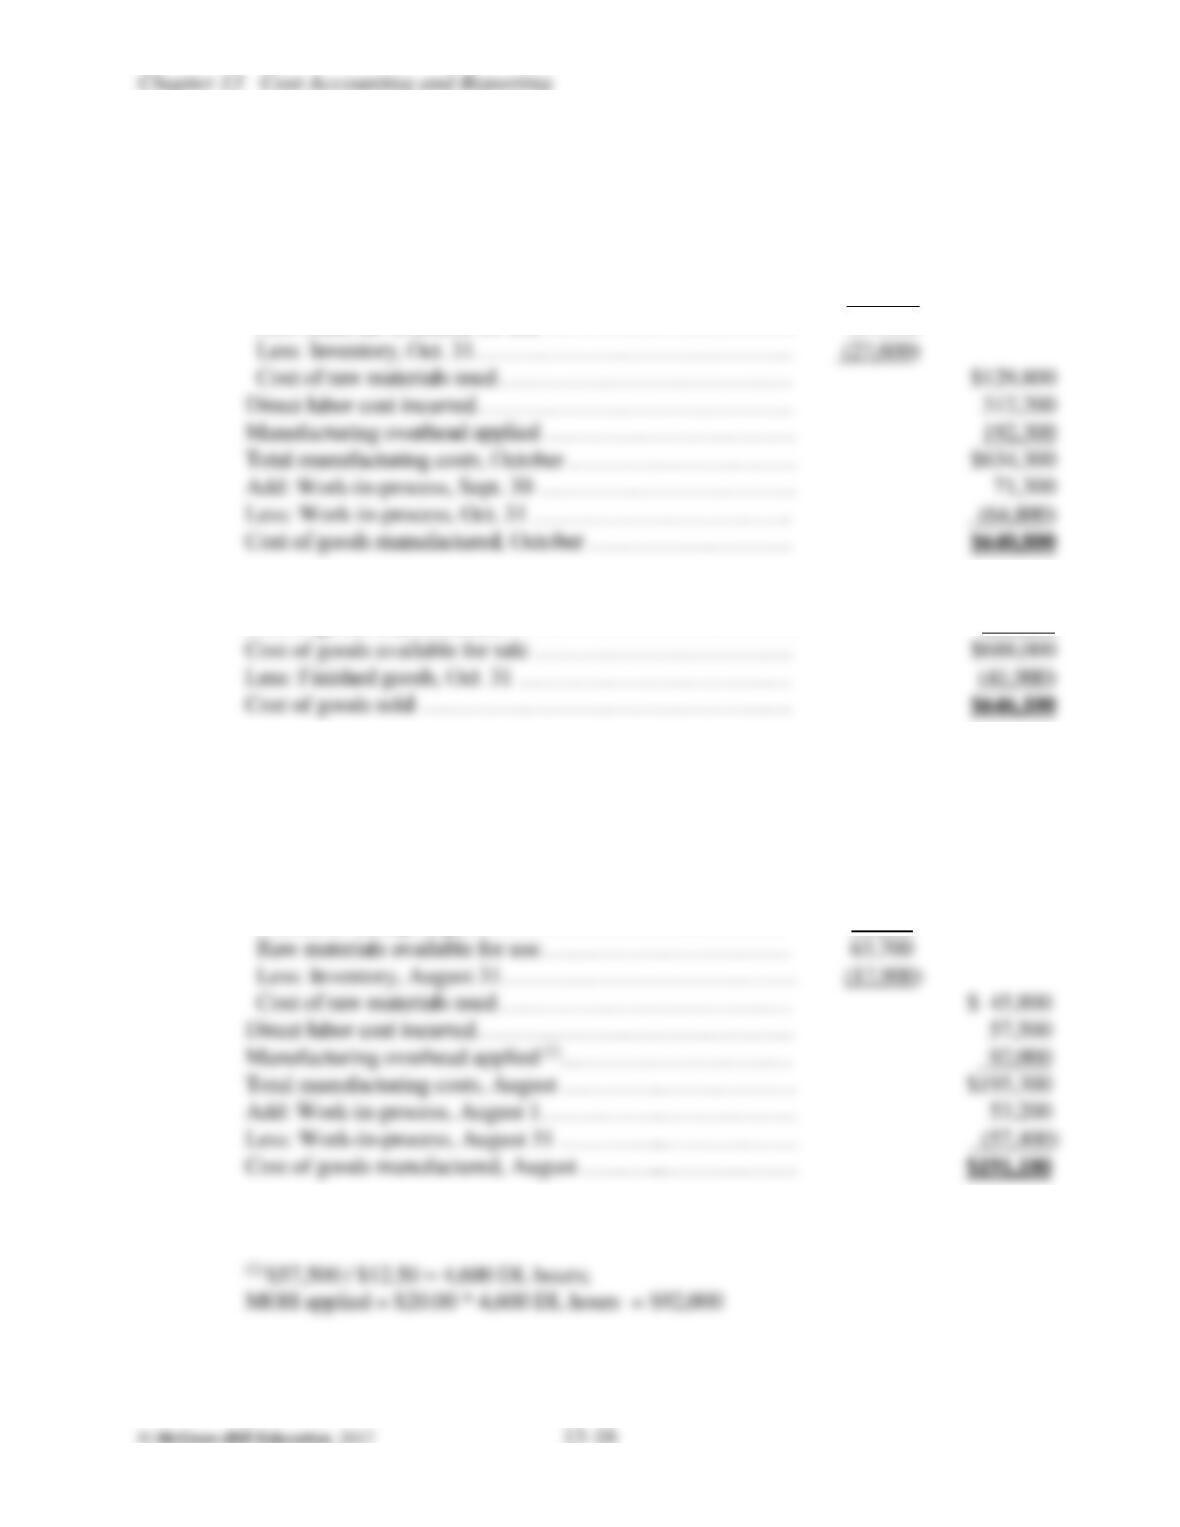
Less: Inventory, Oct. 31……………………………………
Cost of raw materials used…………………………………
Direct labor cost incurred……………………………………
312,200
Manufacturing overhead applied ……………………………
Total manufacturing costs, October …………………………
Add: Work–in-process, Sept. 30 …………………………….
Less: Work-in–process, Oct. 31 …………………………….
Cost of goods manufactured, October ………………………
b.
Finished goods, Sept. 30 ……………………………………
$ 47,200
Cost of goods manufactured…………………………………
640,800
Cost of goods available for sale …………………………….
Less: Finished goods, Oct. 31 ………………………………
Cost of goods sold ………………………………………….
P13.28.
a.
BUCK & COMPANY
Statement of Cost of Goods Manufactured
For the month of August
Raw materials:
Inventory, August 1 ………………………………………
$ 19,600
Purchases during August …………………………………
44,100
Raw materials available for use……………………………
Less: Inventory, August 31…………………………………
Cost of raw materials used…………………………………
Direct labor cost incurred……………………………………
Total manufacturing costs, August ………….………………
Add: Work–in-process, August 1…………….………………
Less: Work-in–process, August 31 …………..………………
Cost of goods manufactured, August ………..………………
Cost per unit = $191,100 / 4,200 = $45.50
P13.28.
(continued)
b.
Finished goods, August 1 …………………………………………………
$ 41,800
Cost of goods manufactured ………………………………………………
191,100
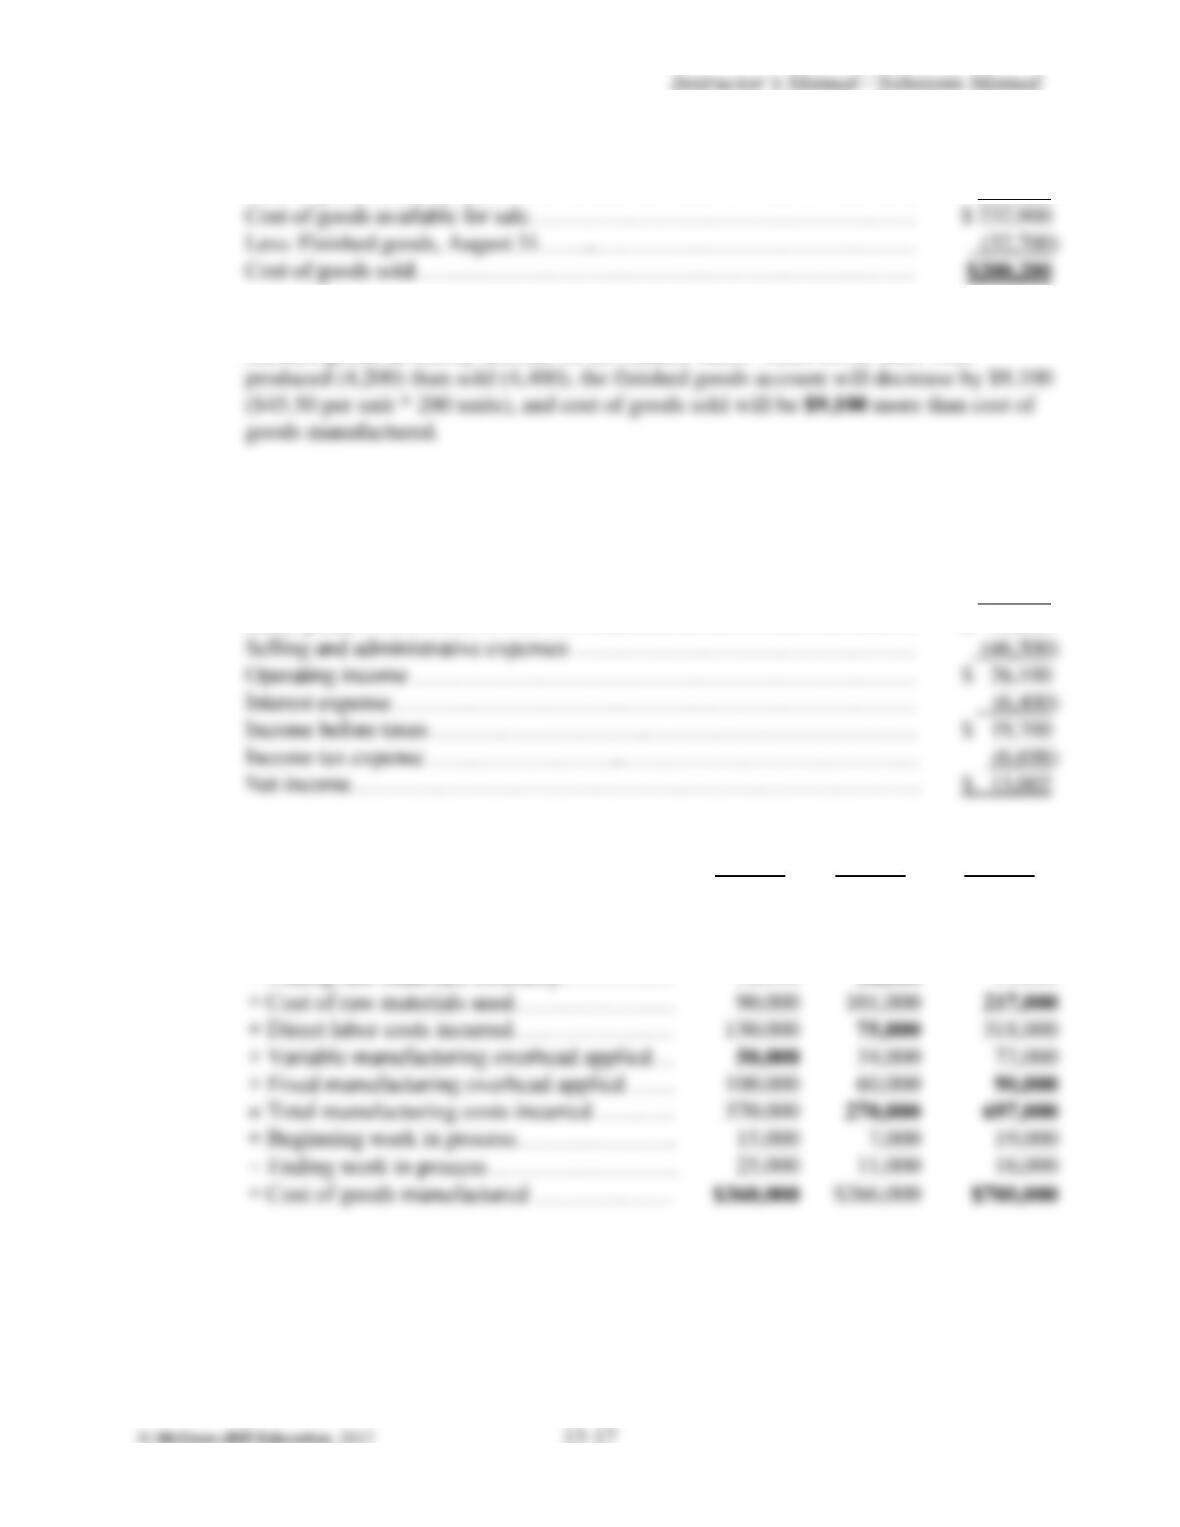
Cost of goods available for sale……………………………………………
$ 232,900
Less: Finished goods, August 31……..……………………………………
Cost of goods sold…………………………………………………………
$200,200
c.
The difference between cost of goods manufactured and cost of goods sold is in the
finished goods inventory account on the balance sheet. Since fewer units were
d.
BUCK & COMPANY
Absorption Income Statement
For the month of August
Sales ………………………………………………………………………
$ 272,800
Cost of goods sold…………………………………………………………
(200,200)
Gross profit ……………………………..…………………………………
$ 72,600
Selling and administrative expenses ………………………………………
Operating income …………………………………………………………
$ 26,100
Interest expense……………………………………………………………
Income before taxes ……………………….………………………………
$ 19,700
Income tax expense ……………………..…………………………………
Net income…………………………………………………………………
$ 13,002
C13.29.
Answer:
Firm A
Firm B
Firm C
Beginning raw materials inventory ………..
$ 17,000
$ 23,000
$ 42,000
+ Purchases of raw materials during the year..
85,000
96,000
226,000
= Raw materials available for use……………
102,000
119,000
268,000
– Ending raw materials inventory……………
12,000
18,000
51,000
+ Direct labor costs incurred…………………
75,000
318,000
+ Variable manufacturing overhead applied…
34,000
+ Fixed manufacturing overhead applied ……
60,000
+ Beginning work in process…………………
15,000
= Cost of goods manufactured ………………
C13.29.
(continued)
Firm A
Firm B
Firm C
Sales
$480,000
$410,000
$911,000
Less: Cost of goods sold:
Beginning finished goods inventory………….
30,000
37,000
61,000
+ Cost of goods manufactured………………….
360,000
266,000
700,000
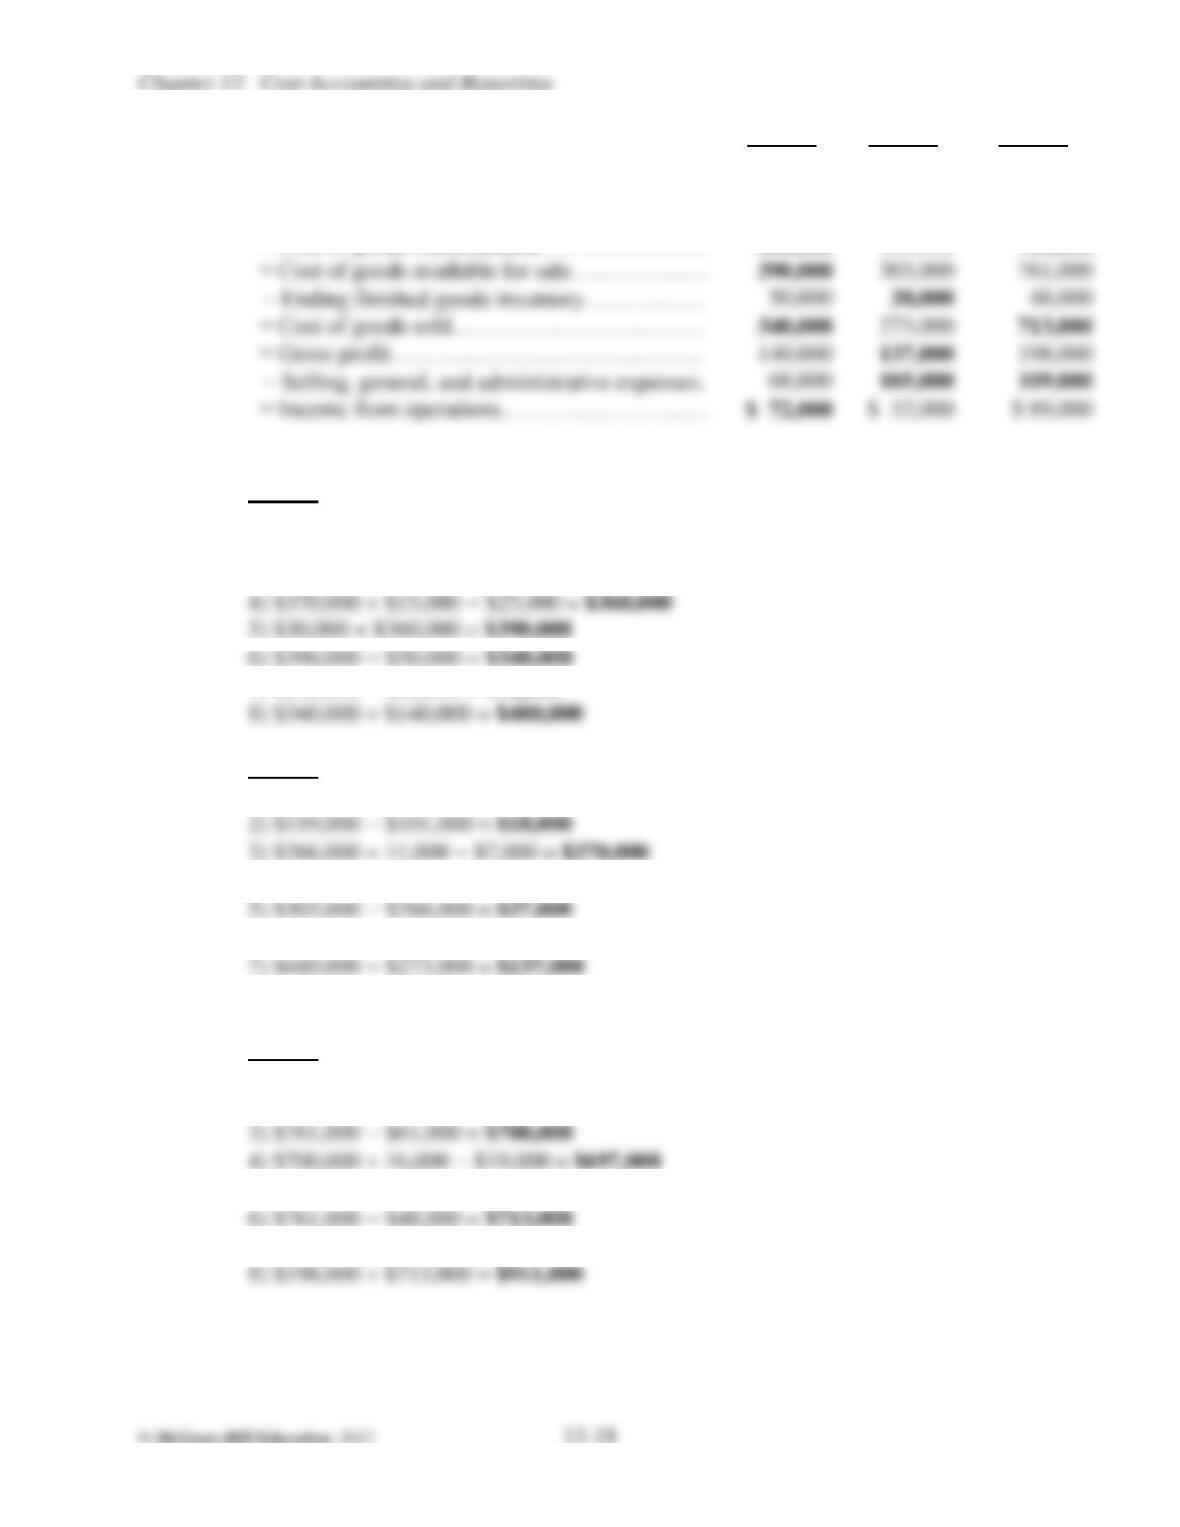
= Cost of goods available for sale………………
= Cost of goods sold……………………………
340,000
273,000
713,000
= Gross profit…………………………………..
= Income from operations………………………
$ 32,000
$ 89,000
Calculations:
Firm A
1) $90,000 + $12,000 = $102,000
2) $102,000 – $17,000 = $85,000
3) $370,000 – $90,000 – $130,000 – $100,000 = $50,000
7) $140,000 – $68,000 = $72,000
Firm B
1) $119,000 – $96,000 = $23,000
4) $270,000 – $101,000 – $34,000 – $60,000 = $75,000
6) $303,000 – $273,000 = $30,000
8) $137,000 – $32,000 = $105,000
Firm C
1) $42,000 + $226,000 = $268,000
2) $268,000 – $51,000 = $217,000
5) $697,000 – $217,000 – $318,000 – $72,000 = $90,000
7) $198,000 – $89,000 = $109,000
C13.30.
a.
Predetermined fixed manufacturing overhead application rate
= $312,000 / 96,000 machine hours = $3.25 per machine hour
b.
Graph of fixed manufacturing overhead relationships:
$’s
Fixed overhead assigned to production
at the rate of $3.25 per machine hour
The graph illustrates that fixed overhead costs are treated differently for planning
and control purposes than for product costing purposes. For planning purposes, fixed
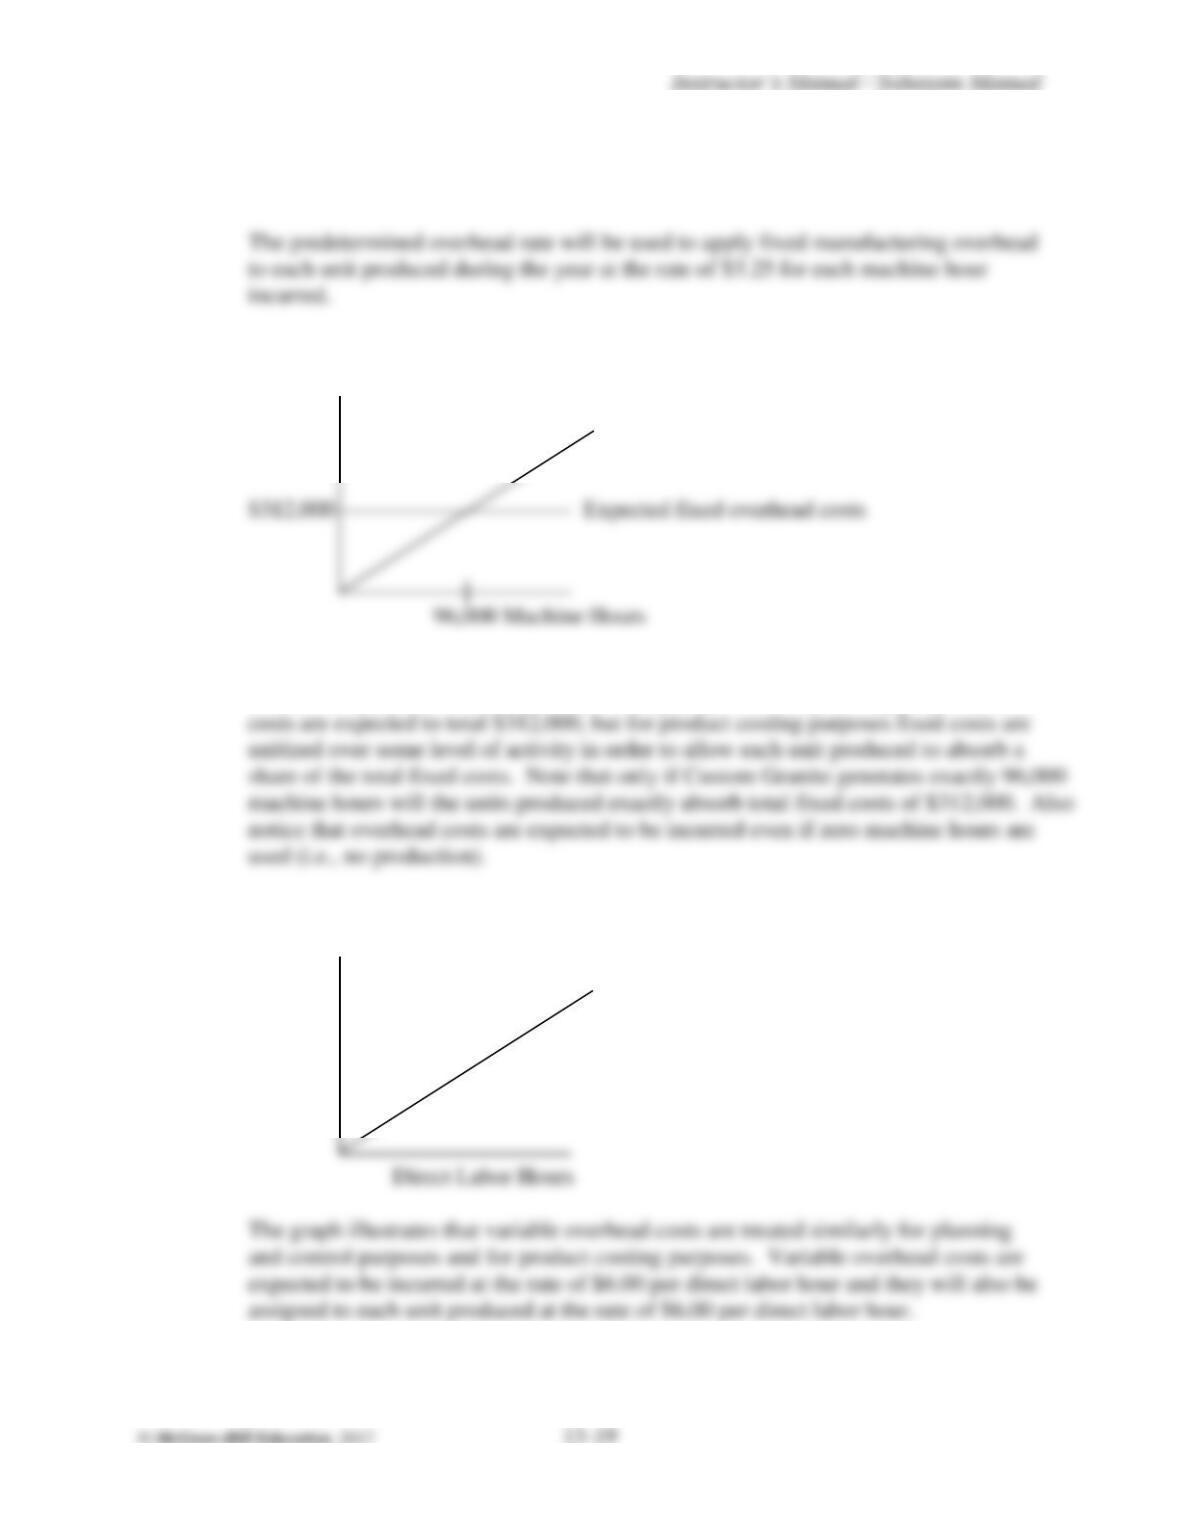
c.
Graph of variable manufacturing overhead relationships:
$’s
Variable overhead expected and assigned
to production at the rate of $6.00 per
direct labor hour