12–21
P12.25.
(continued)
c.
Break-even point in sales dollars = Fixed expenses / Contribution margin ratio
= $70,000 / 50% = $140,000
d.
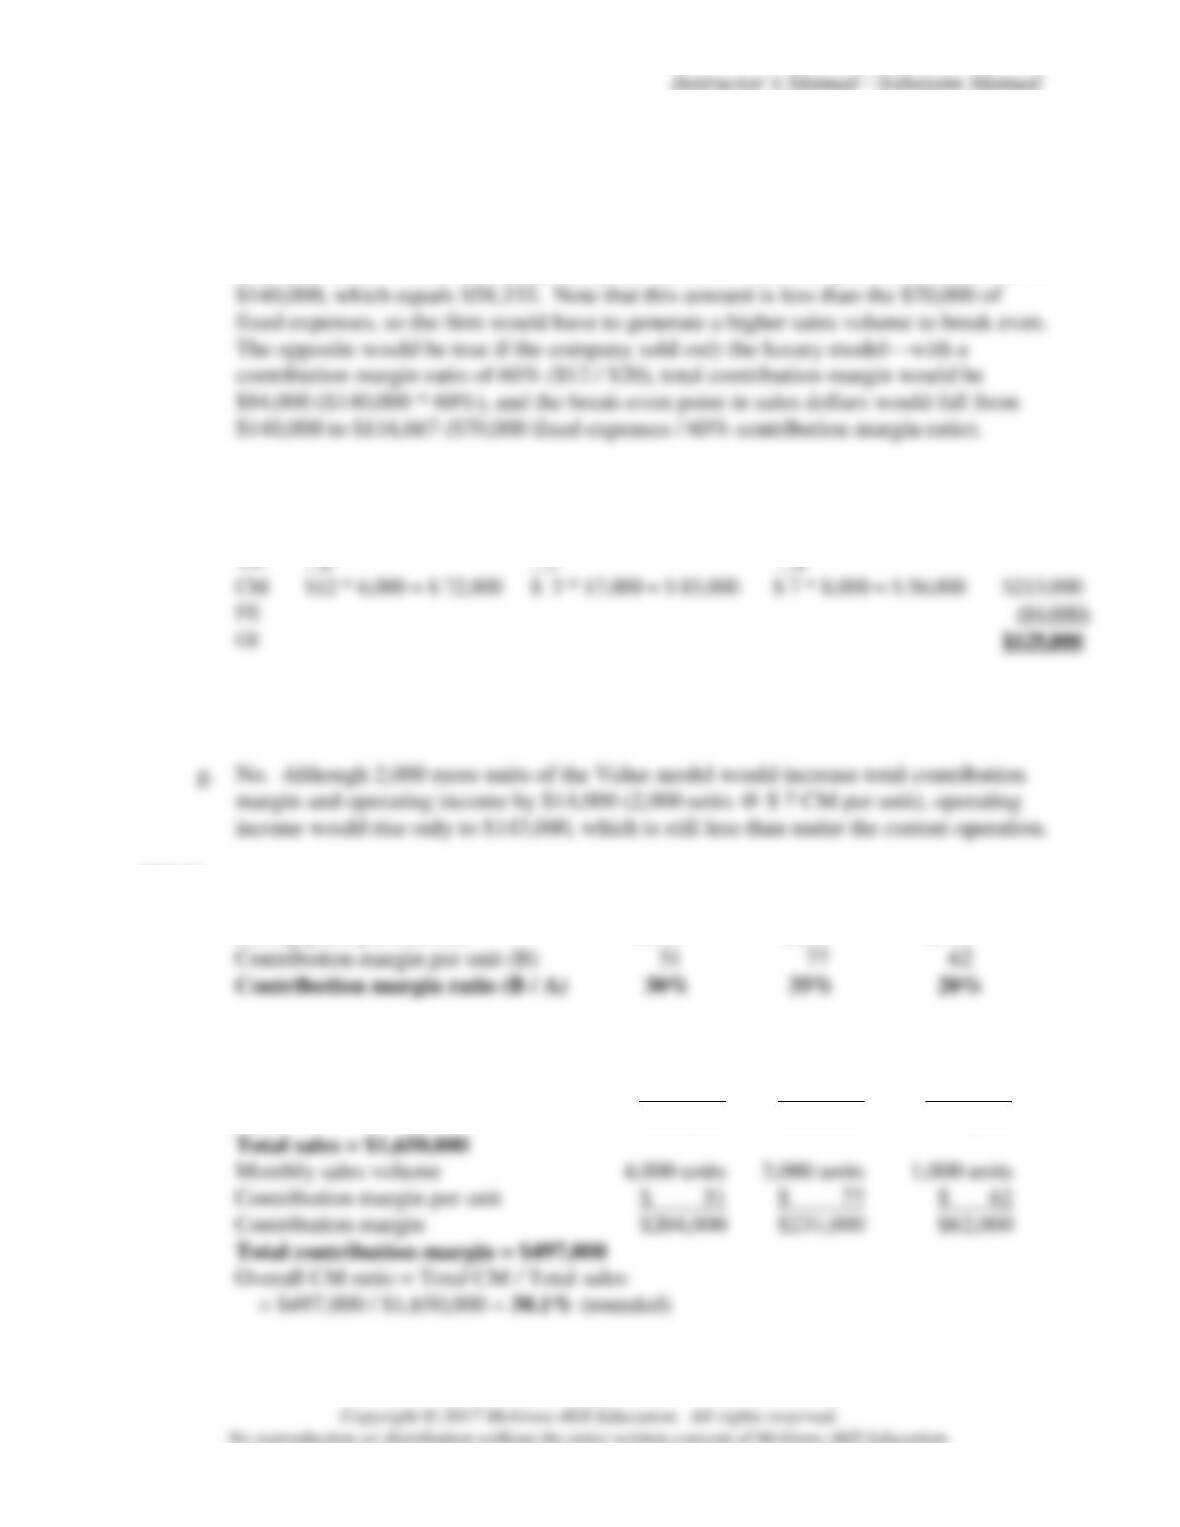
Because sales mix might change. For example, if the company sold only the economy
model, total contribution margin would equal the economy model contribution margin
ratio ($5 / $12 = 41.666%) multiplied by the current break-even point in sales dollars of
e.
Proposed Expansion:
Luxury
Economy
Value
Total
Rev.
$20 * 6,000 = $120,000
$12 * 17,000 = $204,000
$15 * 8,000 = $120,000
$444,000
8
7
8
$12 * 6,000 = $ 72,000
$ 5 * 17,000 = $ 85,000
$ 7 * 8,000 = $ 56,000
$213,000
f.
No. Based on this data analysis, adding the Value model would result in lower total
operating income by $21,000 ($150,000 current operation versus $129,000 proposed).
P12.26.
a.
MegaMuscle
PowerGym
ProForce
Selling price per unit (A)
$170
$220
$310
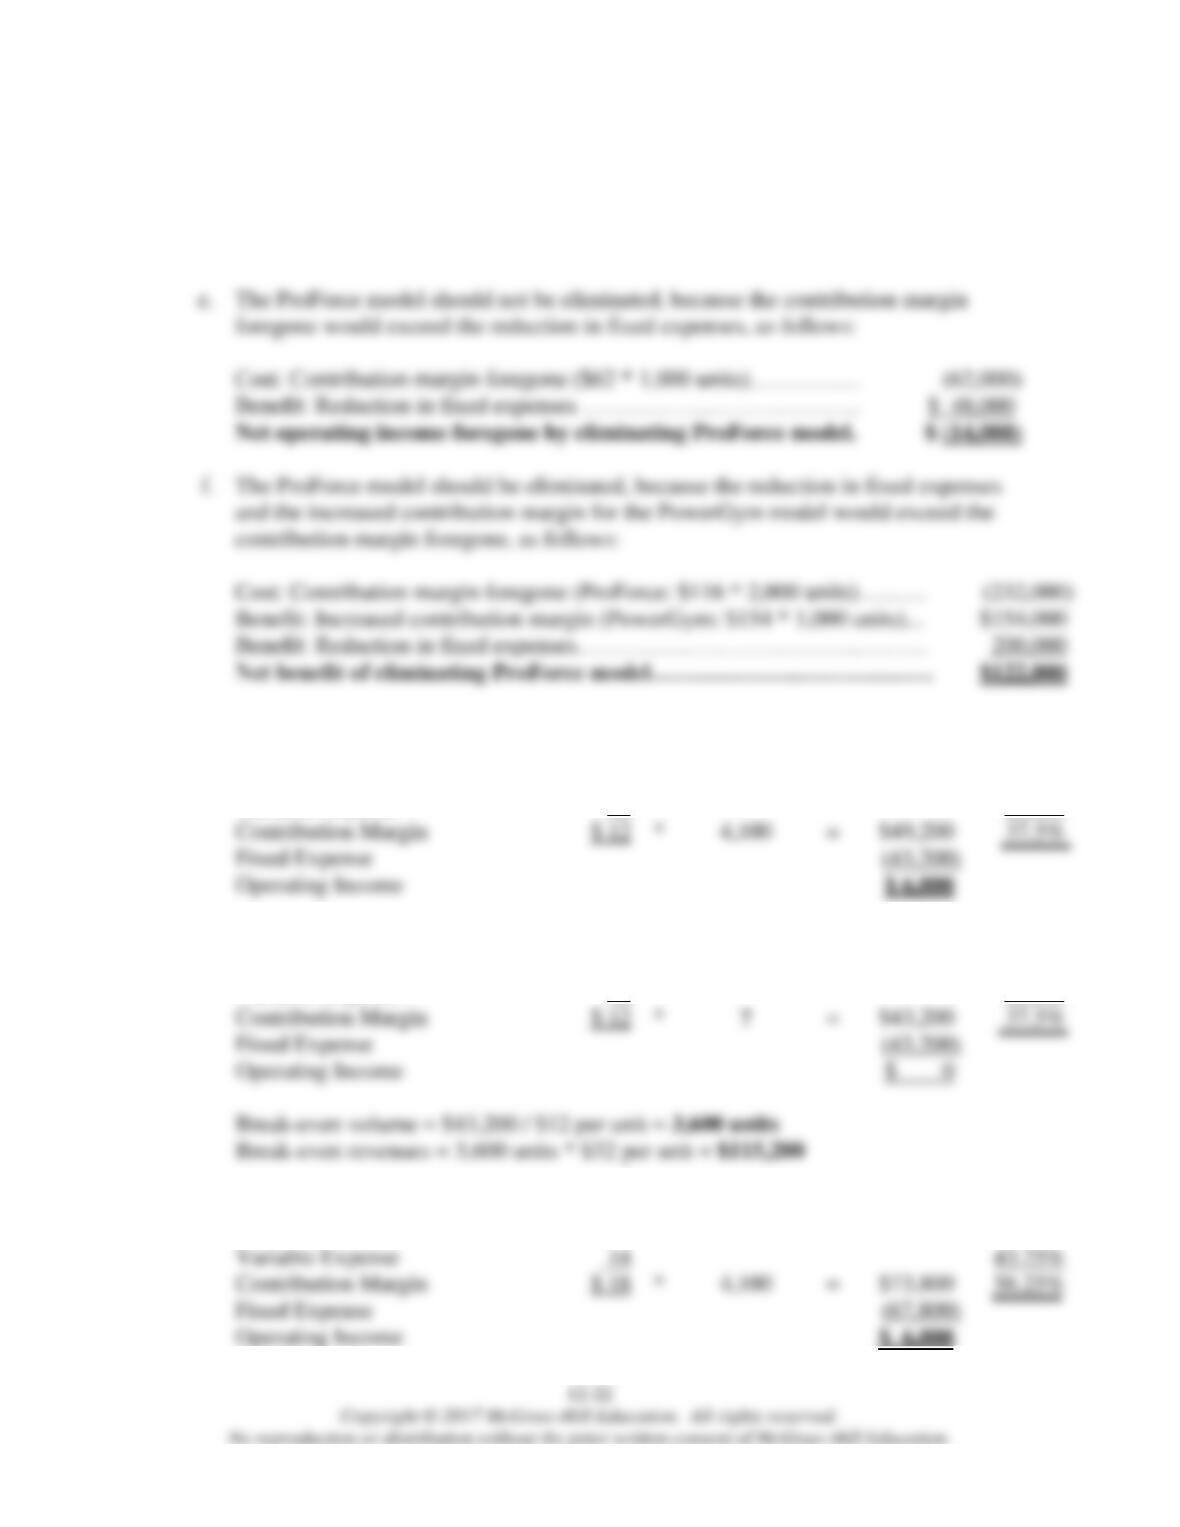
Contribution margin per unit (B)
62
b.
MegaMuscle
PowerGym
ProForce
Monthly sales volume
4,000 units
3,000 units
1,000 units
Selling price per unit
$ 170
$ 220
$ 310
Sales
$680,000
$660,000
$310,000
Monthly sales volume
4,000 units
1,000 units
Contribution margin per unit
$ 51
Contribution margin
$204,000
Chapter 12 Managerial Accounting and Cost-Volume-Profit Relationships
P12.26.
(continued)
c.
Break-even point = Fixed expenses / Overall CM ratio
= $468,000 / 30.1% = $1,554,817
d.
Operating income = Total CM – Fixed expenses
= $497,000 – $468,000 = $29,000
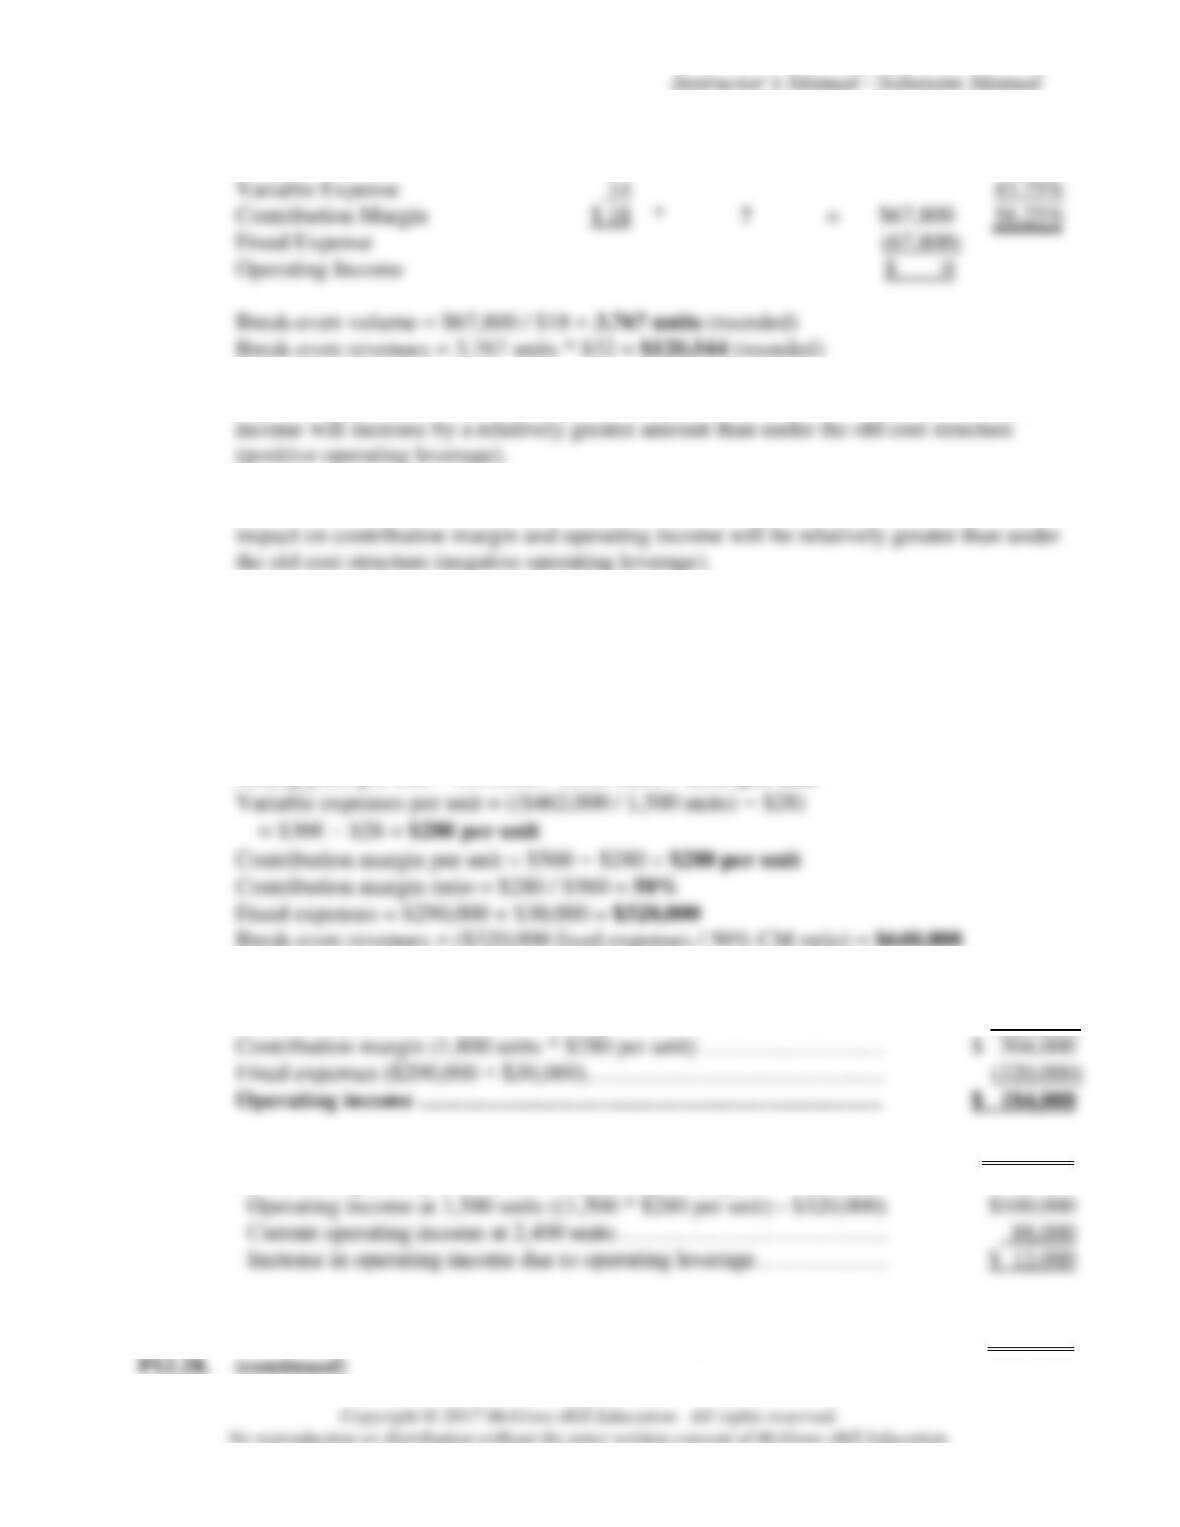
foregone would exceed the reduction in fixed expenses, as follows:
contribution margin foregone, as follows:
Cost: Contribution margin foregone (ProForce: $116 * 2,000 units)………
Benefit: Increased contribution margin (PowerGym: $154 * 1,000 units)…
P12.27.
a.
Per Unit
*
Volume
=
Total
%
Revenue
$ 32
100.0%
Variable Expense
20
62.5%
Contribution Margin
$ 12
=
37.5%
Fixed Expense
b.
Per Unit
*
Volume
=
Total
%
Revenue
$ 32
100.0%
Variable Expense
20
62.5%
Contribution Margin
$ 12
=
Fixed Expense
Operating Income
c.
1.
Per Unit
*
Volume
=
Total
%
Revenue
$ 32
100.00%
Variable Expense
43.75%
Contribution Margin
$ 18
=
56.25%
Fixed Expense
Operating Income
12–23
P12.27.
(continued)
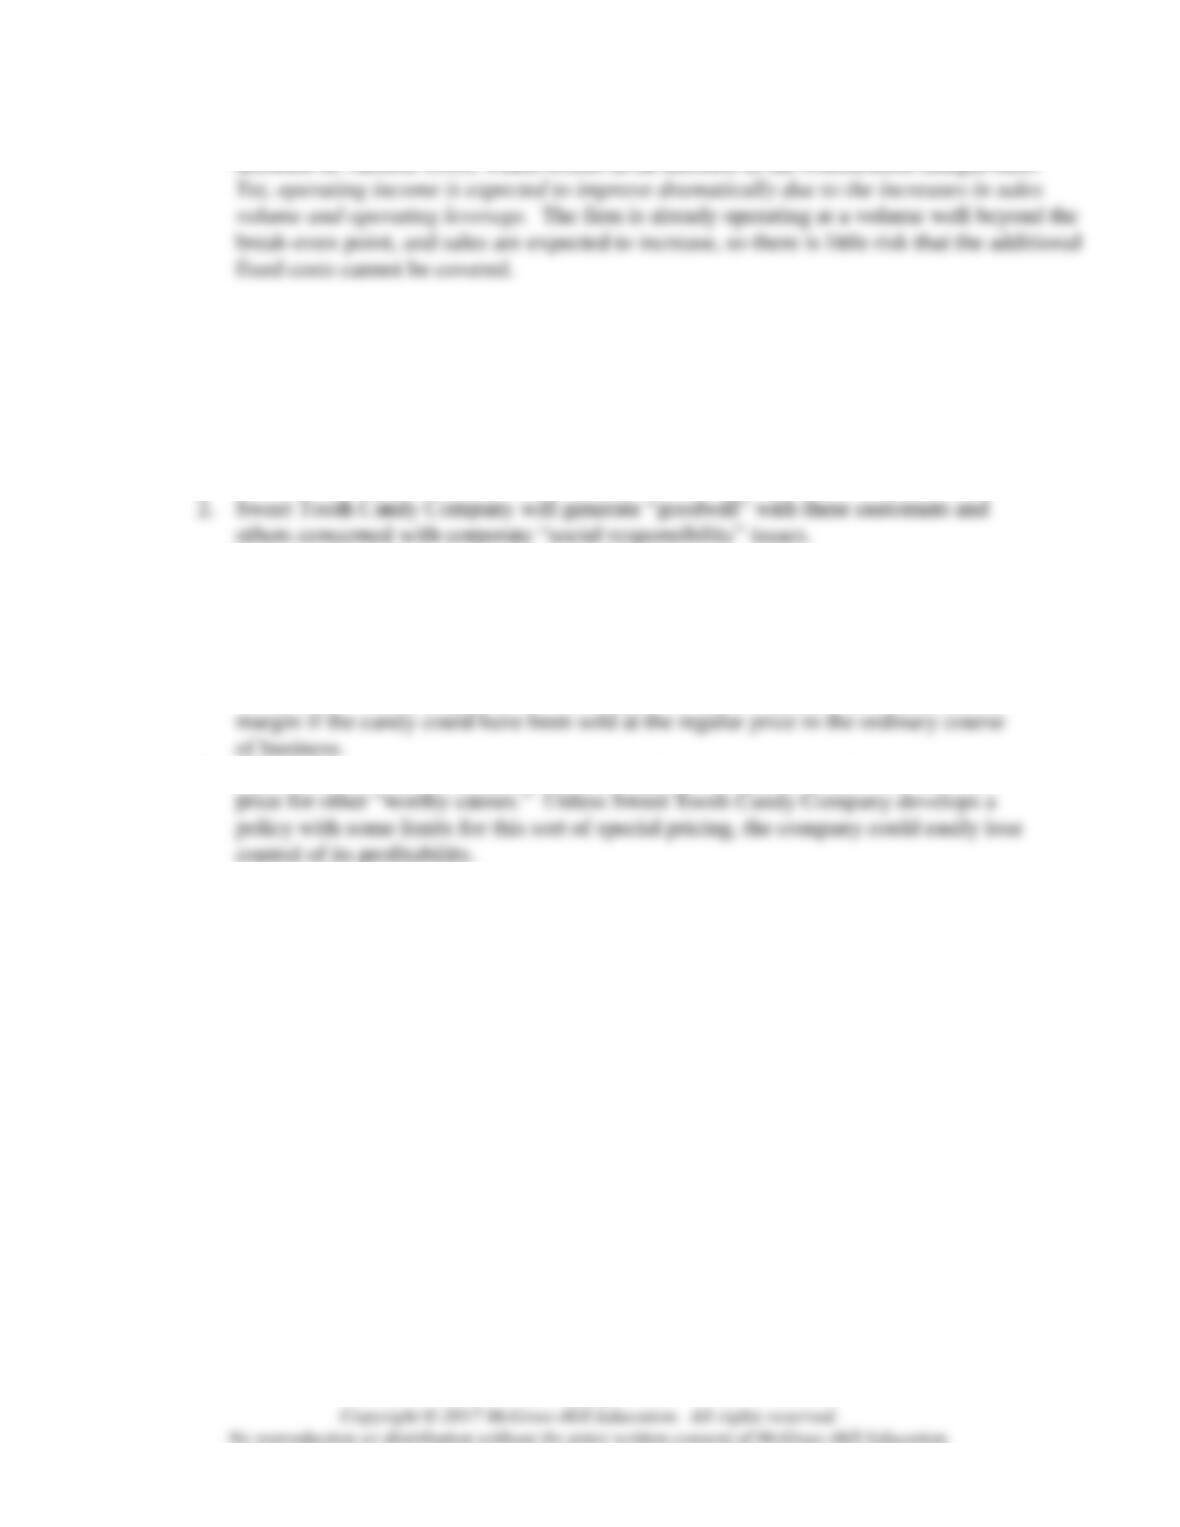
2.
Per Unit
*
Volume
=
Total
%
Revenue
$ 32
100.00%
Variable Expense
Contribution Margin
$ 18
=
Fixed Expense
Operating Income
Break-even volume = $67,800 / $18 = 3,767 units (rounded)
Break-even revenues = 3,767 units * $32 = $120,544 (rounded)
3.
(positive operating leverage).
As sales volume moves above the break-even point, contribution margin and operating
4.
the old cost structure (negative operating leverage).
The new cost structure has much more risk, because if sales volume declines, the
P12.28.
a.
Contribution margin ratio = $378,000 / $840,000 = 45%
Break-even revenues = ($290,000 fixed expenses / 45% CM ratio) = $644,444 (rounded)
b.
If the new machine is leased:
Sales volume = 1,500 units * 120% = 1,800 units
Selling price per unit = $840,000 / 1,500 units = $560 per unit
Break-even revenues = ($320,000 fixed expenses / 50% CM ratio) = $640,000
c.
Revenues (1,800 units * $560 per unit) ……………….………………
$1,008,000
Variable expenses (1,800 units * $280 per unit)………………………
(504,000)
Contribution margin (1,800 units * $280 per unit) ……………………
$ 504,000
Fixed expenses ($290,000 + $30,000)…………………………………
Note: Increase in operating income ($184,000 – $88,000)……………
$ 96,000
Increase in operating income due to operating leverage:
Operating income at 1,500 units ((1,500 * $280 per unit) – $320,000)
$100,000
Current operating income at 2,400 units………………………………
Increase in operating income due to operating leverage………………
$ 12,000
Increase in operating income due to additional sales:
(1,800 – 1,500) * $280 per unit contribution margin…………………
$ 84,000
Chapter 12 Managerial Accounting and Cost-Volume-Profit Relationships
12–24
d.
Yes, the new machine should be leased. The break-even point in sales dollars remains
nearly the same under both alternatives because the increase in fixed costs is offset by a
decrease in variable costs, which results in an increase in the contribution margin ratio.
C12.29.
Pros:
1.
The sale will still generate a positive contribution margin ratio of 14% (rounded).
To illustrate, assume that the normal selling price is $1.00 — which would mean that
the normal variable cost is $0.60 and the normal contribution margin is $0.40. If the
discount is given, the selling price will fall to $0.70 — which would mean that the
contribution margin will fall to $0.10, and the contribution margin ratio will fall to
14% ($0.10 / $0.70).
2.
Sweet Tooth Candy Company will generate “goodwill” with these customers and
3.
The candy given to the children will increase brand awareness and could lead to
greater sales volume in the future.
4.
The Substance Abuse Awareness Club is a positive moral force in the community.
Cons:
1.
margin if the candy could have been sold at the regular price in the ordinary course
of business.
Sweet Tooth Candy Company incurs an opportunity cost equal to the lost contribution
2.
When other customers learn of the discounted sale, they may ask for the same special
3.
Special pricing transactions that are not based on quantity discounts may be in
violation of federal price discrimination laws. Legal counsel should be consulted
before agreeing to the special price.
Recommendation: An appropriate corporate policy and other safeguards concerning
special order pricing arrangements should be developed, and the candy should be sold
at the special price.
Instructor’s Manual / Solutions Manual
C12.30.
To: Tommy
From: Your Idea Person
Subject: Attitude Adjustment Proposal
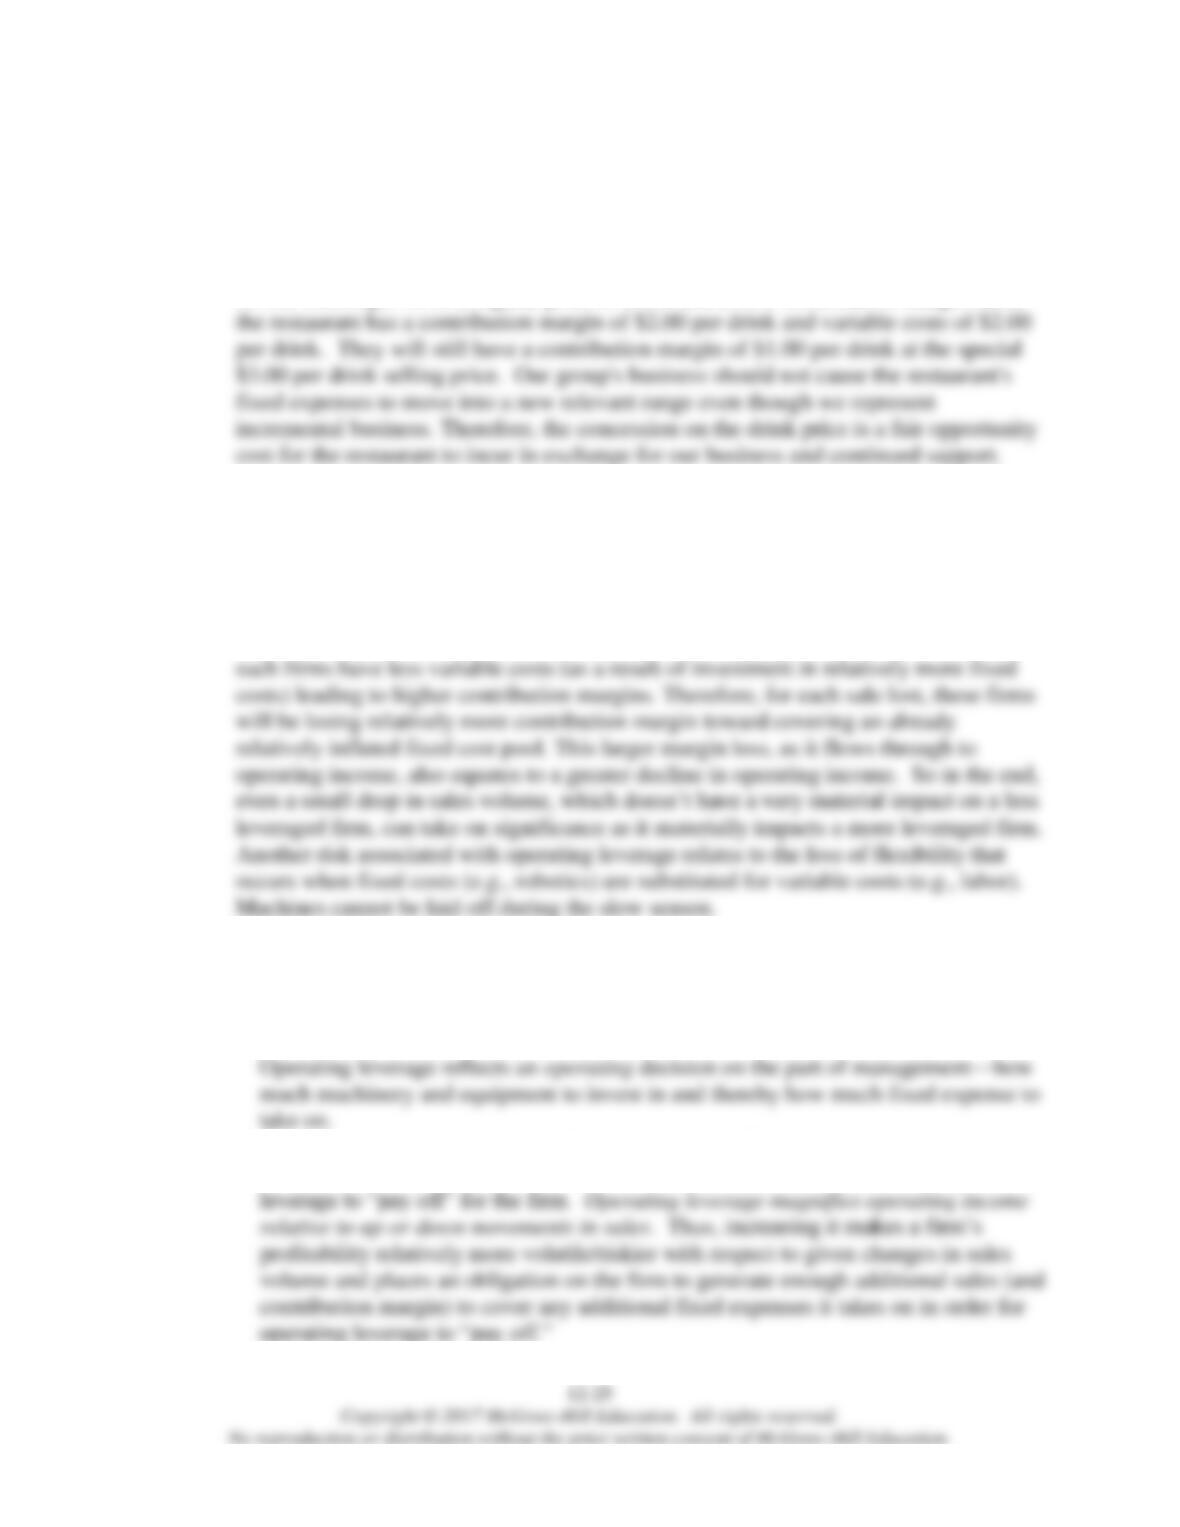
cost for the restaurant to incur in exchange for our business and continued support.
It is recommended that a proposal be made to the restaurant manager that drink prices
be set at $3.00 in exchange for our organization’s special promotion of the restaurant
for our meetings. With a regular price of $4.00 and a 50% contribution margin ratio,
C12.31.
a.
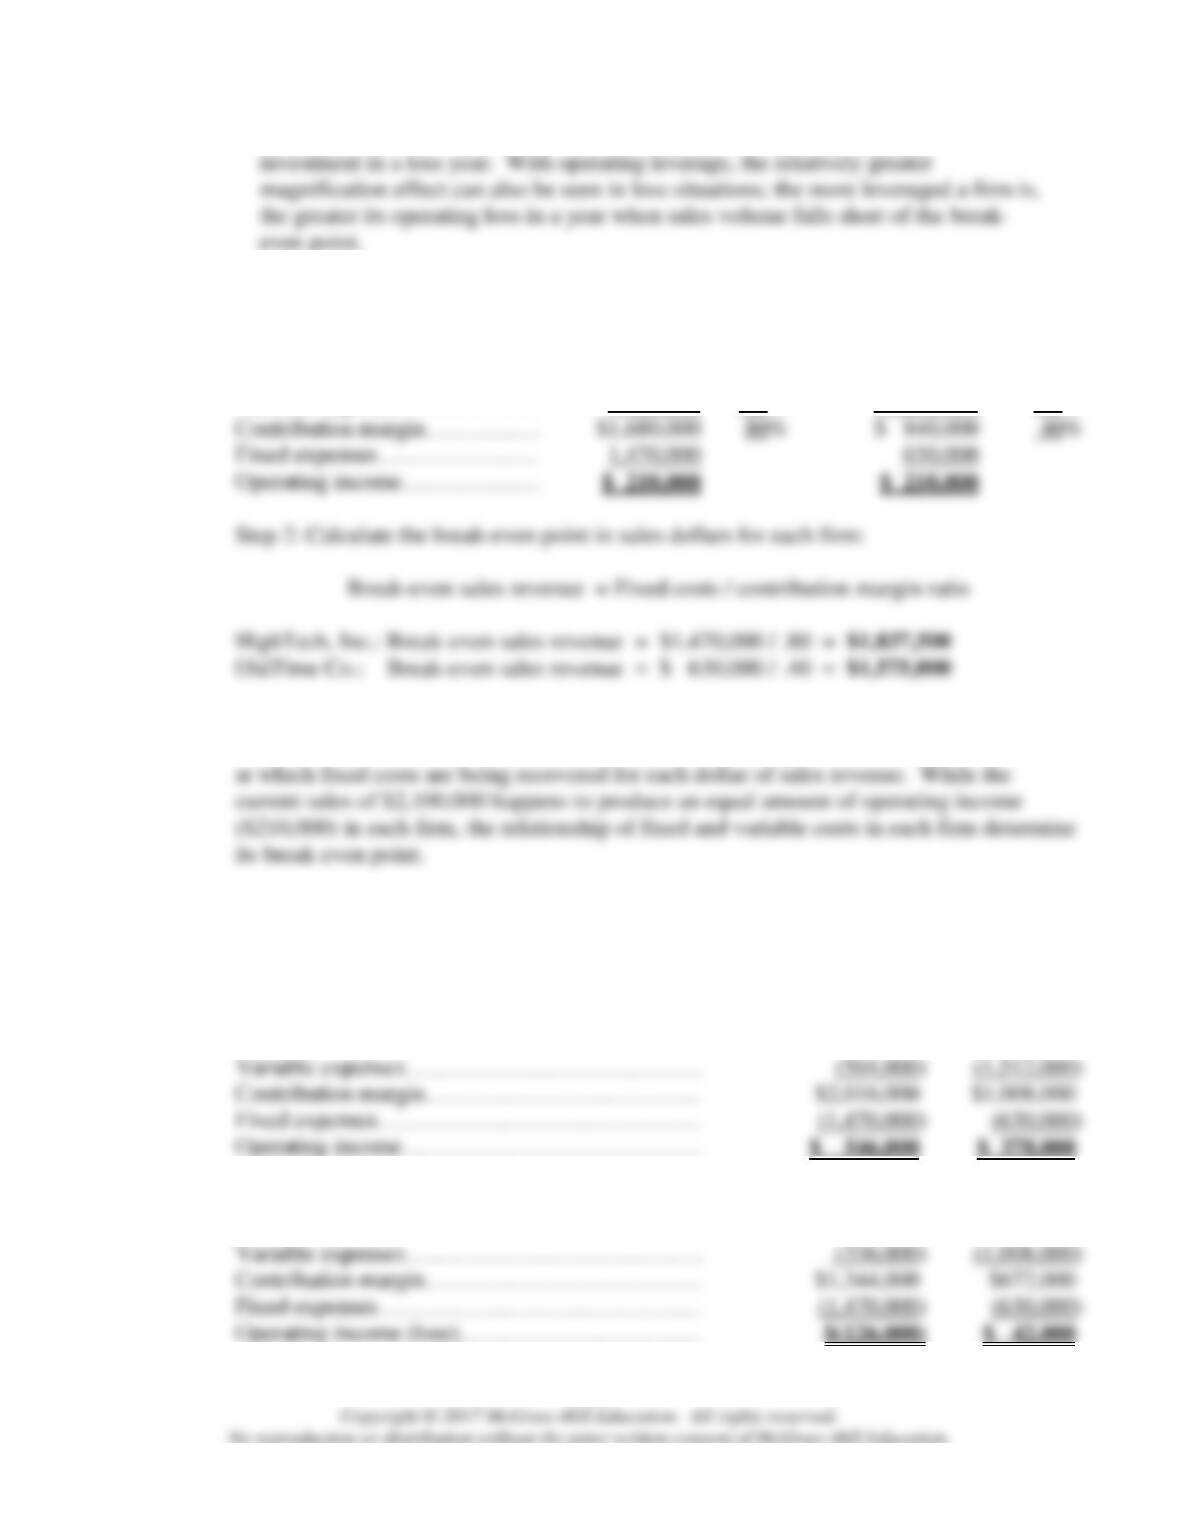
As a firm increases operating leverage by adding more fixed expenses to its cost
structure, the break-even point in terms of units and sales dollars also increases. Thus,
a principal risk associated with greater operating leverage is that a decrease in sales—
which leads to decreases in contribution margin, operating income, and cash flows—
may result in a relatively greater inability to cover fixed expenses. Why? Because
b.
1. Financial leverage relates to a firm’s use of long-term debt in its capital structure,
and operating leverage relates to a firm’s use of fixed costs in its cost structure.
2. Financial leverage reflects a financing decision on the part of management—how
much money to borrow and thereby how much interest expense to take on.
operating leverage to “pay off.”
3. Financial leverage magnifies ROE relative to ROI. This adds risk: ROI must exceed
the cost of debt (i.e., the interest rate on borrowed funds) in order for financial
C12.31.
(continued)
Chapter 12 Managerial Accounting and Cost-Volume-Profit Relationships
12–26
4. With financial leverage, the magnification on ROE works both ways; the more
leveraged the firm is, the more its stockholders lose as a percentage of their
C12.32.
a.
Step 1: Calculate the contribution margin ratio for each firm:
HighTech, Inc.
OldTime Co.
Sales……………………………
$2,100,000
100%
$2,100,000
100%
Variable expenses………………
420,000
20%
1,260,000
60%
Contribution margin……………
$1,680,000
$ 840,000
40%
Fixed expenses…………………
1,470,000
Operating income………………
b.
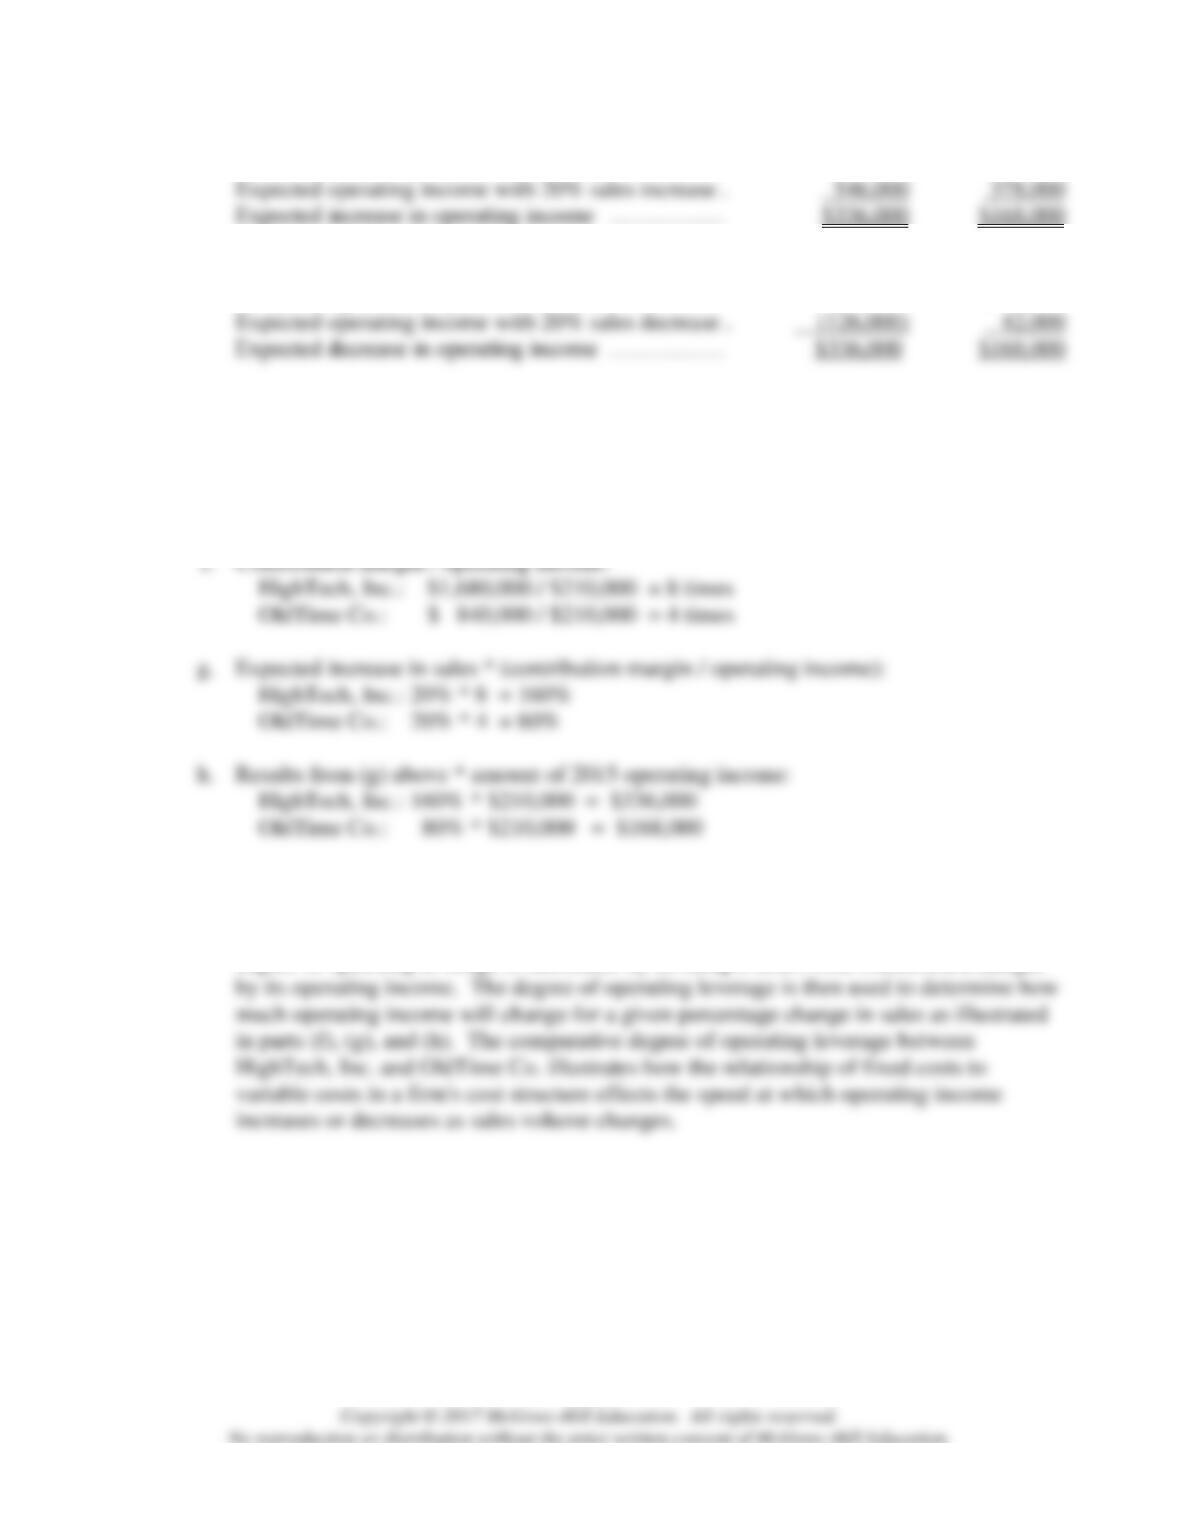
The break-even point for each firm is different because each firm has a different amount of
fixed costs to be recovered and a different contribution margin ratio that represents the rate
c.
Solution approach: Prepare all changes relative to each assumed change in sales volume.
Calculate the variable expense ratio for each firm using the income statement data
provided – 20% for HighTech, Inc. and 60% for OldTime Co.
1. Increase in Sales by 20%
HighTech, Inc.
OldTime Co.
Sales………………………………………………
$2,520,000
$2,520,000
Variable expenses…………………………………
Contribution margin………………………………
$2,016,000
$1,008,000
Operating income…………………………………
2. Decrease in Sales by 20%
HighTech, Inc.
OldTime Co.
Sales………………………………………………
$1,680,000
$1,680,000
Variable expenses…………………………………
Contribution margin………………………………
$1,344,000
$672,000
Fixed expenses……………………………………
Operating income (loss)..…………………………
Instructor’s Manual / Solutions Manual
12–27
C12.32.
(continued)
d.
HighTech, Inc.
OldTime Co.
1. Operating income reported in 2015 ………………
$210,000
$210,000
Expected operating income with 20% sales increase .
546,000
2. Operating income reported in 2015 ………………
$210,000
$210,000
Expected operating income with 20% sales decrease .
$336,000
$168,000
e.
HighTech, Inc. has significantly more operating leverage than does OldTime Co. because
HighTech’s fixed costs are much higher ($1,470,000 versus $630,000) and its
contribution margin ratio is also much higher (80% versus 40%). Thus, if sales
increase/decrease by 20% in 2016, HighTech, Inc. will benefit/suffer proportionately
more than OldTime Co. because OldTime’s cost structure is riskier.
Contribution margin / operating income:
HighTech, Inc.: $1,680,000 / $210,000 = 8 times
OldTime Co.: $ 840,000 / $210,000 = 4 times
Expected increase in sales * (contribution margin / operating income):
HighTech, Inc.: 20% * 8 = 160%
OldTime Co.: 20% * 4 = 80%
h.
Results from (g) above * amount of 2015 operating income:
HighTech, Inc.: 160% * $210,000 = $336,000
OldTime Co.: 80% * $210,000 = $168,000
i.
much operating income will change for a given percentage change in sales as illustrated
HighTech, Inc. and OldTime Co. illustrates how the relationship of fixed costs to
The answer calculated in part (h) is equal to the answer calculated in part (d). The
important point is that an expected change in operating income can be computed given a
percentage change in sales by knowing each firm‘s degree of operating leverage. The
degree of operating leverage is calculated by dividing a firm’s total contribution margin
Chapter 12 Managerial Accounting and Cost-Volume-Profit Relationships
12–28
C12.33.
Note to instructor: The purpose of this case is to illustrate some of the problem
solving tools available over the Internet for certain applications like break-even
analysis. At the time we were preparing this 11th Edition of What the Numbers
Step 1: Calculate the contribution margin for Dominic’s Italian Cafe:
Per Unit
Percentage
Sales ………………………………………………
$ 18
100%
Variable expenses …………………………………
6
33%
Contribution margin ………………………………
$ 12
67%
Step 2: Calculate the break-even point:
Break-even point = Fixed costs / contribution margin
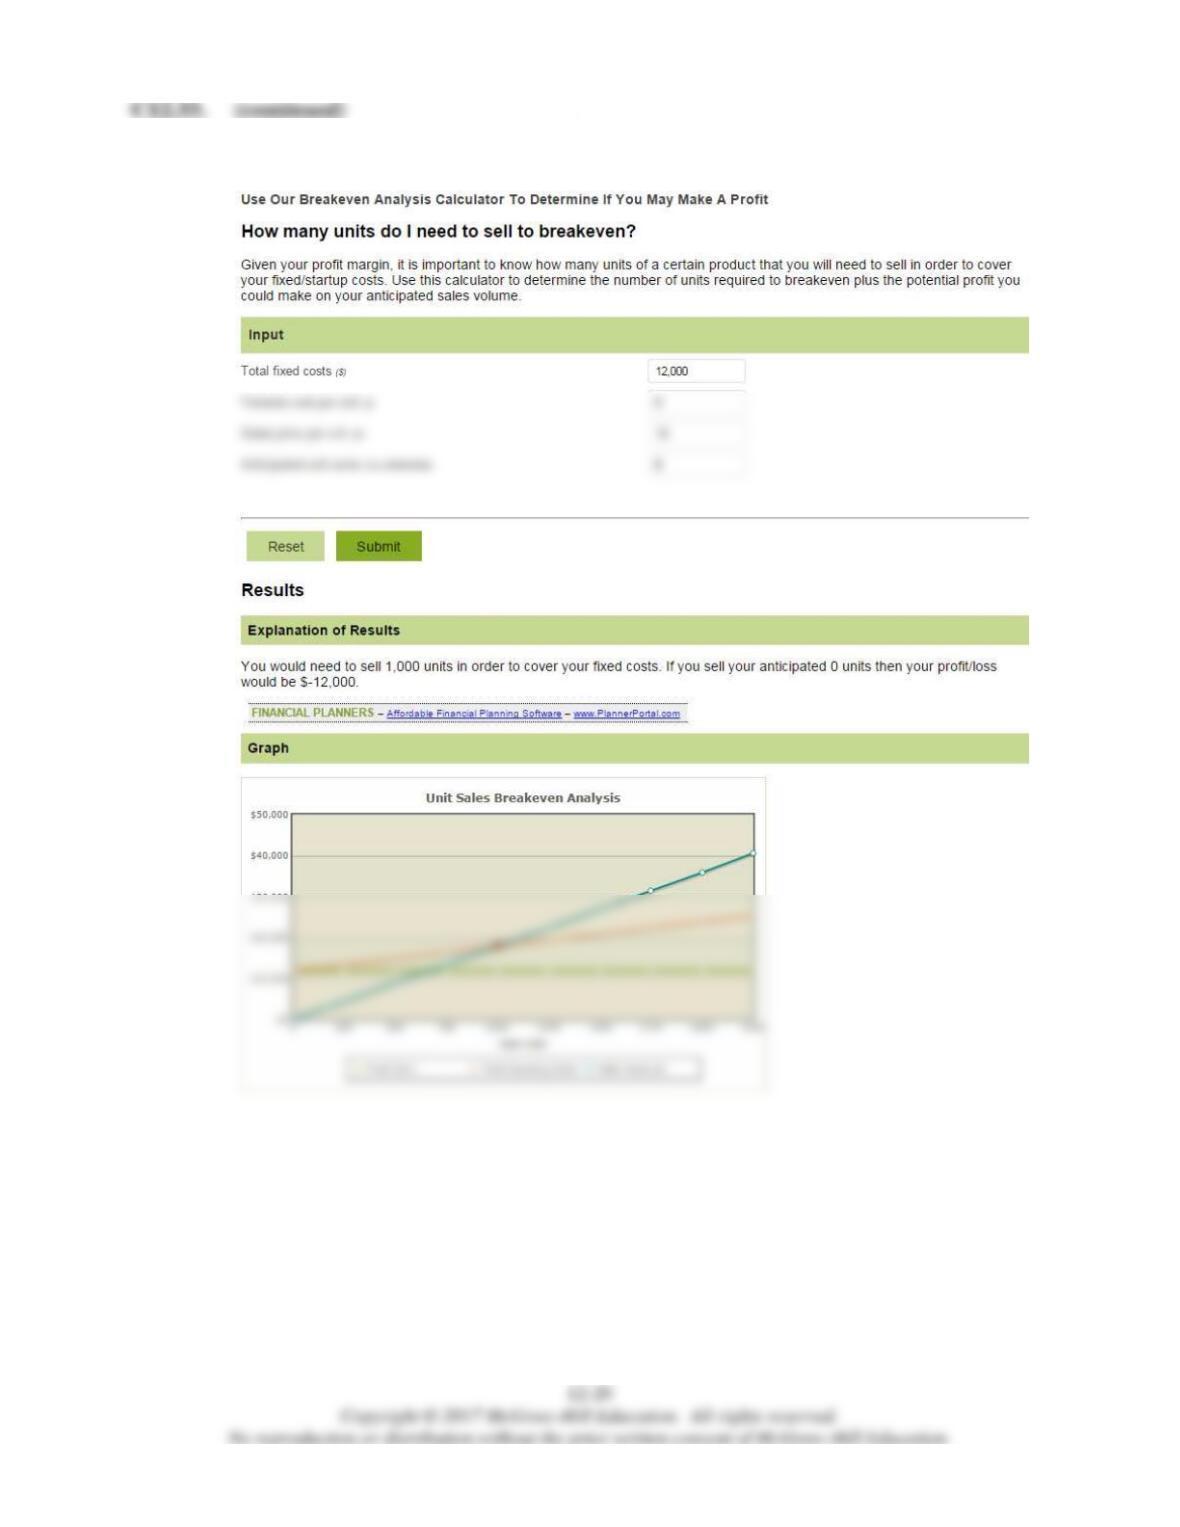
Break-even point = $12,000 / 12 = 1,000 units
a.
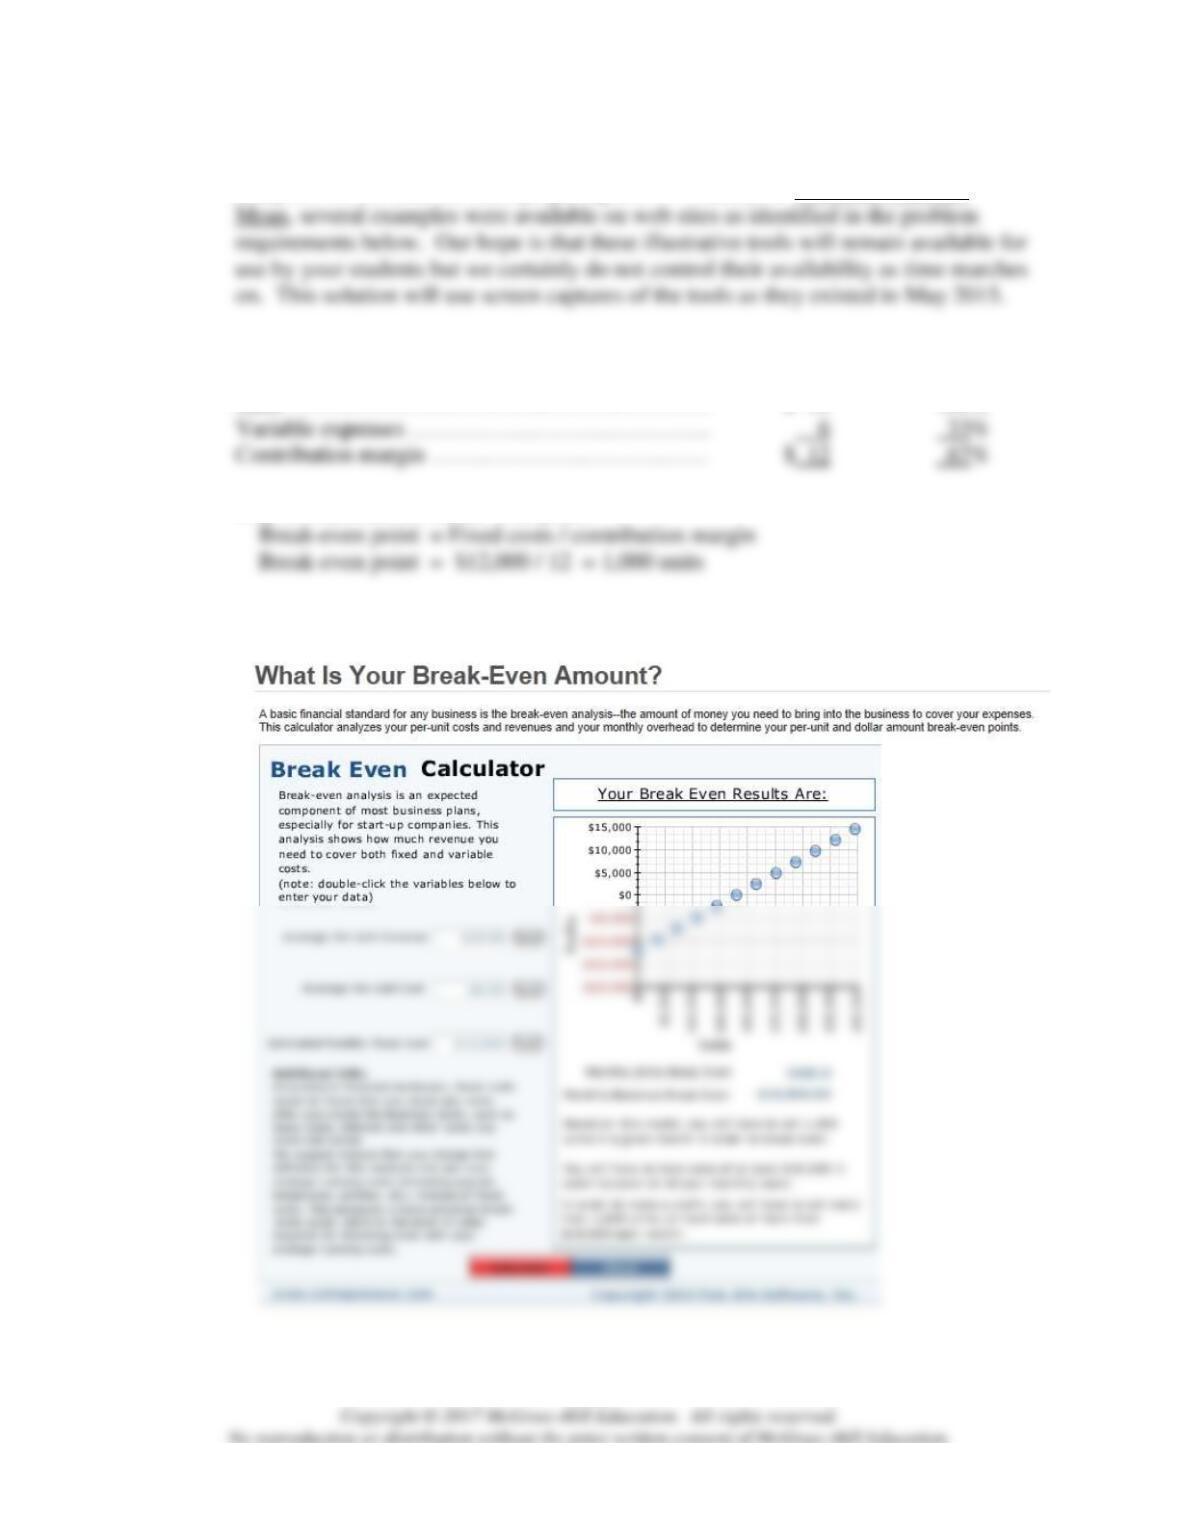
1. The following solution screen is from the entrepreneur.com site:
Instructor’s Manual / Solutions Manual
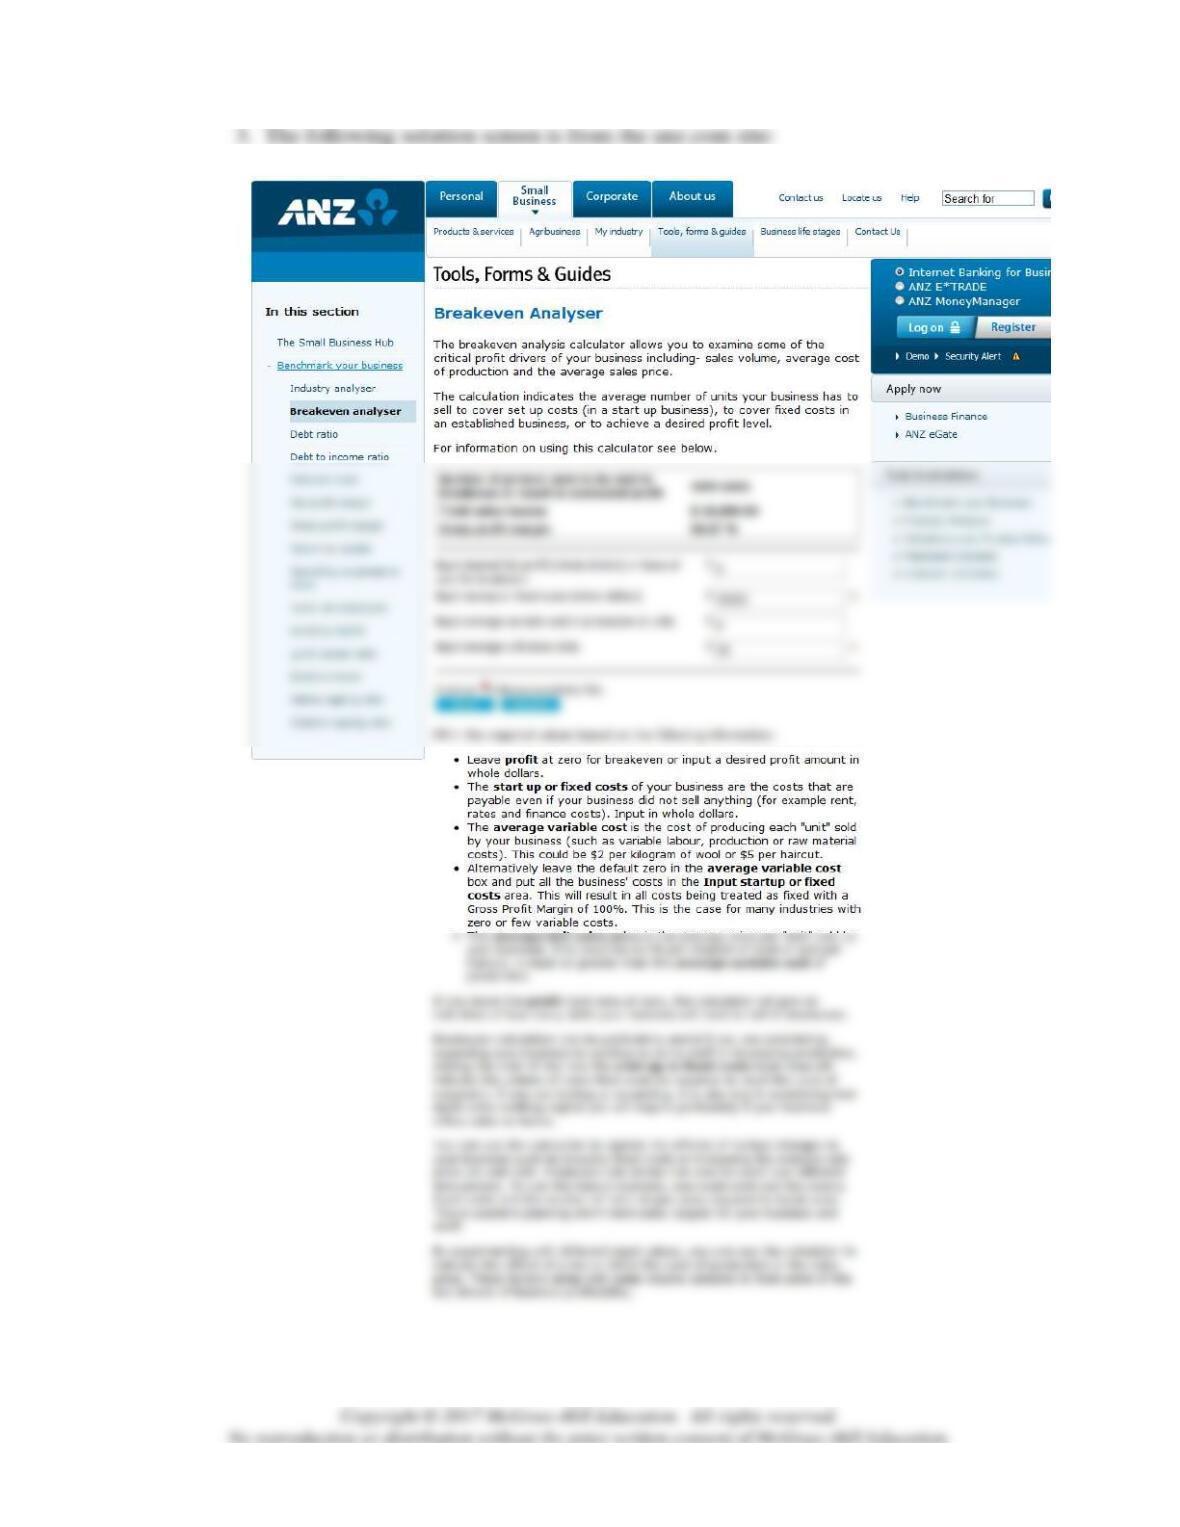
2. The following solution screen is from the calcxml.com site:
Chapter 12 Managerial Accounting and Cost-Volume-Profit Relationships
12–30
C12.33.
(continued)