Unlock document.
This document is partially blurred.
Unlock all pages and 1 million more documents.
Get Access
12-1
CHAPTER
12
Managerial Accounting and
Cost-Volume-Profit Relationships
CHAPTER OUTLINE:
I. Managerial Accounting Contrasted to Financial Accounting
A. The Management Process
2. Planning and Control
B. Differences Between Financial and Managerial Accounting
2. Breadth of focus
3. Application of Generally Accepted Accounting Principles
II. Cost Classifications
A. Relationship of Cost to Volume of Activity
1. Cost behavior patterns
2. Variable costs as activity changes
3. Fixed costs as activity changes
a. Fixed in total as activity changes
b. Fixed per unit - never unitize fixed costs!
III. Applications of Cost-Volume-Profit Analysis
A. Cost Behavior Pattern: The Key
1. Assumptions
a. Relevant range
b. Linearity
B. Estimating Cost Behavior Patterns
2. High-low method
Chapter 12 Managerial Accounting and Cost-Volume-Profit Relationships
12-2
CHAPTER OUTLINE (continued)
IV. Contribution Margin
A. Contribution Margin Format Income Statement
1. Functional cost categories reclassified to cost behavior categories
2. Analyzing impact of volume changes on net income
B. Expanded Contribution Margin Model
1. Use of model to answer "what if" questions
C. Contribution Margin Ratio
2. Determine the revenue increase needed to cover an increase in fixed expenses
3. Used when per unit revenue and variable expense data are not available
D. Sales Mix
1. Average contribution margin ratio
E. Break-Even Point Analysis
2. Graphical presentation
F. Operating Leverage
1. Indifference point
TEACHING/LEARNING OBJECTIVES:
Primary: To have the student understand:
2. Some of the terminology of managerial accounting, and to emphasize that there are different
costs for different purposes.
4. To have the student understand that a cost formula for total cost recognizes variable costs per
unit of activity and fixed costs in total.
5. To have the student understand and be able to use the expanded contribution margin model to
determine the impact of cost, selling price, and volume changes on operating income.
Supporting: To have the student understand:
7. The assumptions related to cost behavior pattern classification.
Instructor’s Manual / Solutions Manual
12-3
TEACHING/LEARNING OBJECTIVES (continued)
9. The simplifying assumptions of linearity and relevant range.
11. How to use the contribution margin ratio to make cost-volume-profit calculations.
13. Break-even point analysis.
14. The concept of operating leverage.
TEACHING OBSERVATIONS:
1. This material marks a "new beginning," and this point should be emphasized to students. In
2. This is the cornerstone chapter in the managerial accounting section of the text. The "big
picture" perspectives of the Planning and Control Cycle and the Cost Classification models
3. To emphasize the significance of cost behavior pattern knowledge, describe a nonsense
decision that did not recognize cost behavior. For example, a university established a check-
cashing fee by dividing business office expenses for a week (almost all fixed) by the number
of students' checks cashed in a week. If students had been aware of this study, what would
they have done? They would have organized a check-cashing marathon to increase the
4. Another effective approach to emphasizing cost behavior knowledge is to compare the
intuitive impact of a 10% change in sales volume on operating income using the traditional
5. Use the expanded contribution margin model and exercise E12.14 and problems P12.24 and
Chapter 12 Managerial Accounting and Cost-Volume-Profit Relationships
12-4
ASSIGNMENT OVERVIEW:
NO.
LEARNING
OBJECTIVES
DIFFICULTY &
TIME ESTIMATE
OTHER COMMENTS
M12.1
3,5
Easy, 5-8 min.
Introduction to cost behavior and use of cost formula.
M12.2
6
Med., 10-15 min.
Uses sales compensation to illustrate high-low method and
M12.4
8
Med., 10-15 min.
Good working example of using CVP Analysis model to solve
for unknown amounts by understanding CVP relationships.
M12.6
12
Med., 10-15 min.
This exercise emphasizes the indifference point and the
comparative cost structure relationships of two companies.
E12.8
3
Easy, 3-5 min.
Good in-class exercise.
E12.10
3
Easy, 7-10 min.
See 12.9.
E12.11
7,9
Hard, 7-10 min.
Tell students to focus on the CVP relationships represented in
this problem to solve for ‘missing pieces of the puzzle.’ Many
E12.13
8,9
Med., 5-8 min.
Emphasize the managerial benefits of using the CVP analysis in
terms of cost planning and control.
E12.14
8,9,10,11
Med., 10-15 min.
Emphasize the importance of understanding sales mix
E12.16
8,9
Easy, 5-8 min.
See 12.15. Concentrate on the qualitative factors that are so
often overlooked in CVP decisions.
P12.18
6
Easy, 5-8 min.
Good in-class exercise.
P12.20
7,8,9,12
Med., 10-15 min.
Excel problem. See 12.19. Good homework assignment.
P12.22
7,8,9,11
Med., 10-12 min.
See 12.21. Good in-class demonstration problem.
P12.23
7,8,9,10
Med., 15-20 min.
Potpourri of CVP applications. Use the expanded contribution
P12.25
7,8,9,10,11
Med., 15-20 min.
Emphasize the importance of gathering appropriate information
in making CVP estimates. After reviewing the answers, ask
students, “How do companies estimate their selling price per
unit, variable cost per unit, fixed costs, and sales volume?”
P12.26
8,9,10,11
Med., 15-20 min.
Good homework assignment.
P12.28
8,9,11,12
Med., 12-18 min.
See 12.27. Group learning problem.
Instructor’s Manual / Solutions Manual
12-5
C12.31
12
Hard, 10-15 min.
Can be used as an in-class writing assignment.
C12.33
11
Med., 60-90 min.
Internet case. Introduces students to CVP tools available on
the Internet for use in breakeven analysis and CVP decisions.
SOLUTIONS:
M12.1.
Cost formula:
Total cost
= Fixed cost + Variable cost
M12.2.
Monthly sales compensation:
Total compensation
=
Sales salary + Sales commission
=
Sales salary + (Commission rate * Volume)
Commission rate
=
(High $ - Low $) / (High units - Low units)
=
($16,000 - $12,000) / (2,400 - 1,600)
=
$4,000 / 800 = $5.00 per unit
Total compensation
=
Sales salary + Sales commission
=
$4,000 + $5.00 per unit
Units sold for the year:
$158,000
=
($4,000 * 12 months) + ($5.00 per unit sold)
$158,000
=
$4,000 + ($5.00 * ?)
$158,000
=
$48,000 + ($5.00 * ?)
$110,000
=
$5.00 * ?
M12.3.
Chapter 12 Managerial Accounting and Cost-Volume-Profit Relationships
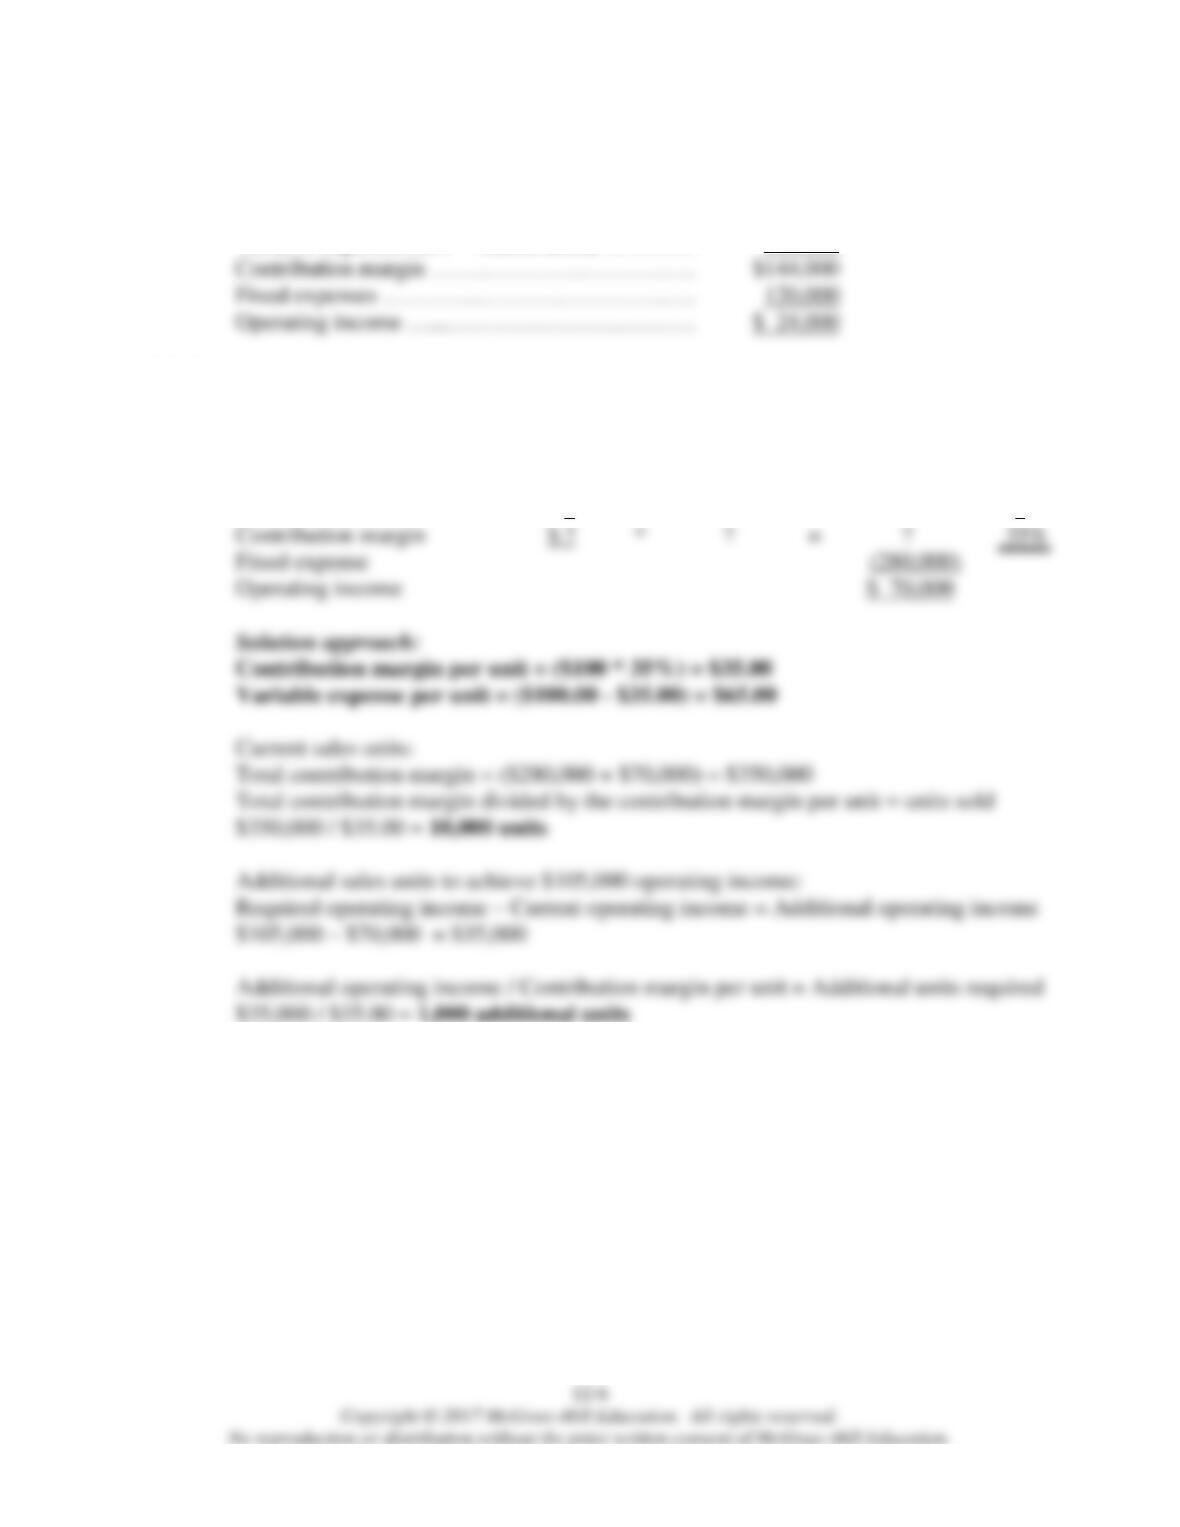
CHINA IMPORTS, INC.
May Income Statement
Contribution Margin Format
Revenues ($25 * 18,000 units) ………………..…
$450,000
Variable expenses ($17 * 18,000 units) …………
306,000
M12.4.
Use the model, enter the known data, and solve for the unknown.
Per Unit
*
Volume
=
Total
%
Revenue
$100.00
100%
Variable expense
?
?
12-7
M12.5.
Break-even units
=
Fixed expenses / Contribution margin per unit
=
$280,000 / $35
=
8,000 units
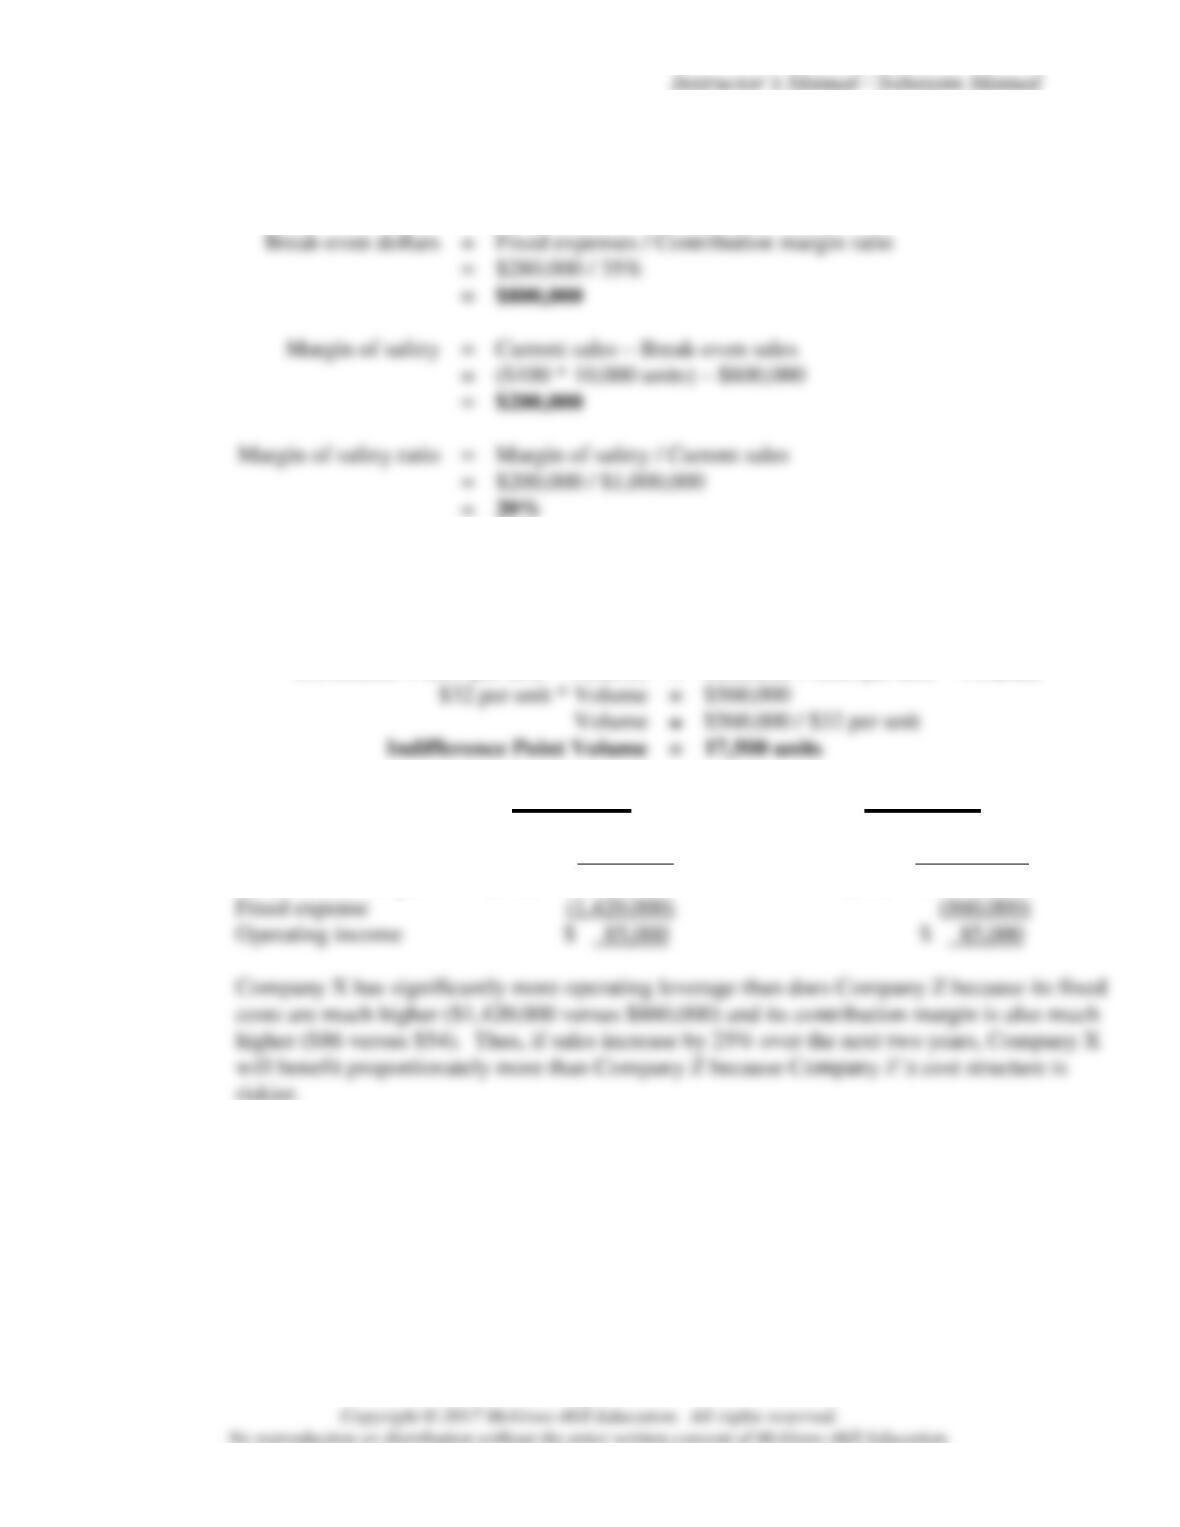
M12.6.
Cost Structure – Company X
=
Cost Structure – Company Z
Fixed costs + (Variable cost/unit * Volume)
=
Fixed costs + (Variable cost/unit * Volume)
$1,420,000 + ($34 per unit * Volume)
=
$860,000 + ($66 per unit * Volume)
Proof @ 17,500 units:
Company X
Company Z
Revenue
($120)
$2,100,000
($120)
$2,100,000
Variable Expense
($34)
(595,000)
($66)
(1,155,000)
Contribution margin
($86)
$1,505,000
($54)
$ 945,000
riskier.
Chapter 12 Managerial Accounting and Cost-Volume-Profit Relationships
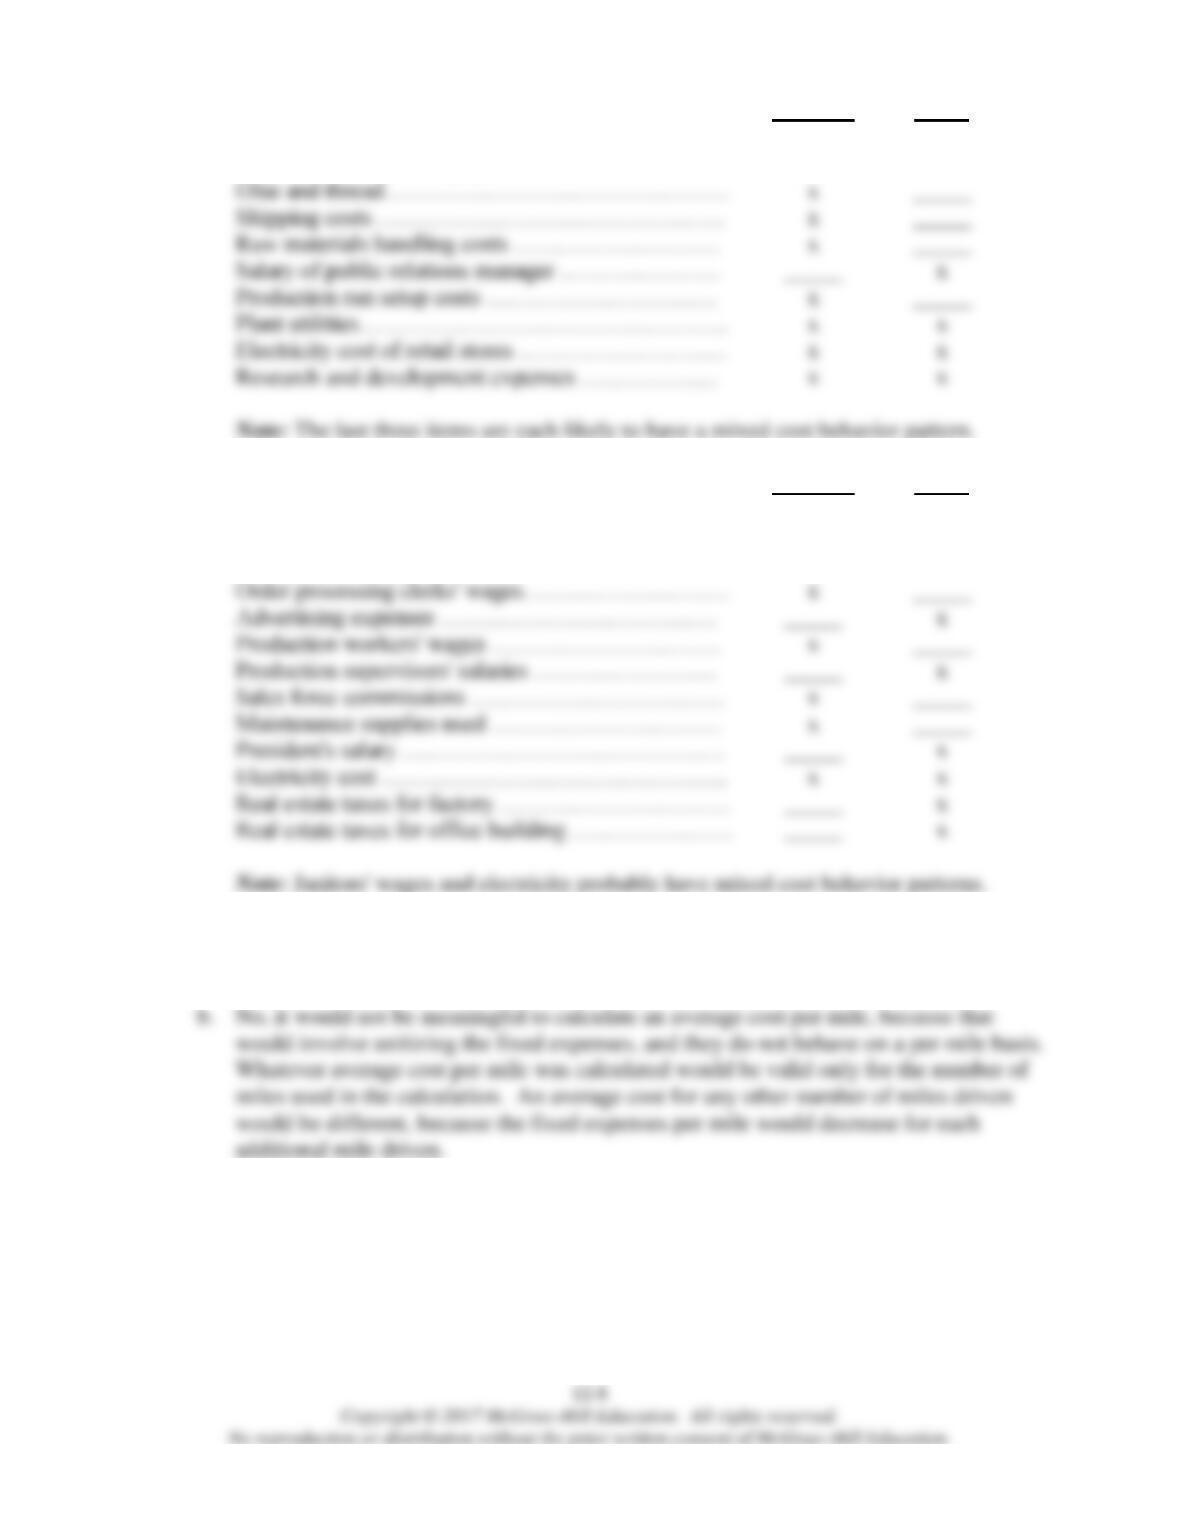
E12.7.
Variable
Fixed
Wages of assembly-line workers ……………………
x
_____
Depreciation--plant equipment ……………………
_____
x
E12.8.
Variable
Fixed
Raw materials ………………………………………
x
_____
Staples used to secure packed boxes of product ……
x
_____
Plant janitors' wages…………………………………
x
x
E12.9.
a.
Total cost = ($320 fixed cost + ($0.14 variable cost per mile * 1,529 miles)) = $534.06
12-9
E12.10.
a.
Cost Element
Probable
Cost Behavior
Pattern
August
8,000 units
(Actual)
September
9,600 units
(Estimated)
Raw materials ($41,600 / 8,000 = $5.20 per unit)……
Variable
$ 41,600
$ 49,920
Factory depreciation expense ……………
Fixed
40,500
40,500
b.
Average total cost per unit produced in August = $192,400 / 8,000 = $24.05 per unit.
It would not be meaningful to use this average total cost figure to predict the cost in
subsequent months; that would involve unitizing the fixed expenses—and they do not
behave on a per unit basis. Average total cost per unit calculations are only valid for the
E12.11.
Note to Student: The purpose of this assignment is to help you to build an
understanding of cost-volume-profit relationships by solving for the ‘missing pieces of
the puzzles.’ In this regard, it may be helpful to insert a Contribution Margin column or
to rearrange the data using the expanded contribution margin model.
Answer:
Sales
Variable
Costs
Contribution
Margin Ratio
Fixed
Costs
Operating
Income (Loss)
Firm A
$320,000
$217,600
32%
$64,100
$38,300
Calculations:
Firm A
VC = Sales * (1 - CM%) = $320,000 * 68% = $217,600
CM = Sales - VC = $320,000 - $217,600 = $102,400
Chapter 12 Managerial Accounting and Cost-Volume-Profit Relationships
E12.11.
(continued)
Firm B
CM = FC + Operating Income = $118,000 + $71,950 = $189,950
Sales = CM + VC = $189,950 + $465,050 = $655,000
CM% = CM / Sales = $189,950 / $655,000 = 29%
Firm C
VC = Sales * (1 - CM%) = $134,000 * 74% = $99,160
CM = Sales - VC = $134,000 - $99,160 = $34,840
E12.12.
Answer:
Units
Sold
Selling
Price
Variable
Costs
Per Unit
Contribution
Margin
Fixed
Costs
Operating
Income
(Loss)
Firm A
11,200
$24.00
$15.00
$100,800
$41,300
$59,500
Firm B
8,400
29.80
18.20
97,440
64,500
32,940
Firm C
3,500
7.30
4.20
10,850
17,600
(6,750)
Firm D
4,720
59.95
51.25
41,064
48,210
(7,146)
Calculations:
Firm A
Operating Income = CM - FC = $100,800 - $41,300 = $59,500
CM/unit = CM / Units Sold = $100,800 / 11,200 = $9.00
VC/unit = Selling Price - CM/unit = $24.00 - $9.00 = $15.00


