Chapter 8 – Segment and Interim Reporting – Hoyle, Schaefer, Doupnik, 13e
39. (20 minutes) (Allocate costs incurred in one quarter that benefit the entire year
and determine income tax expense
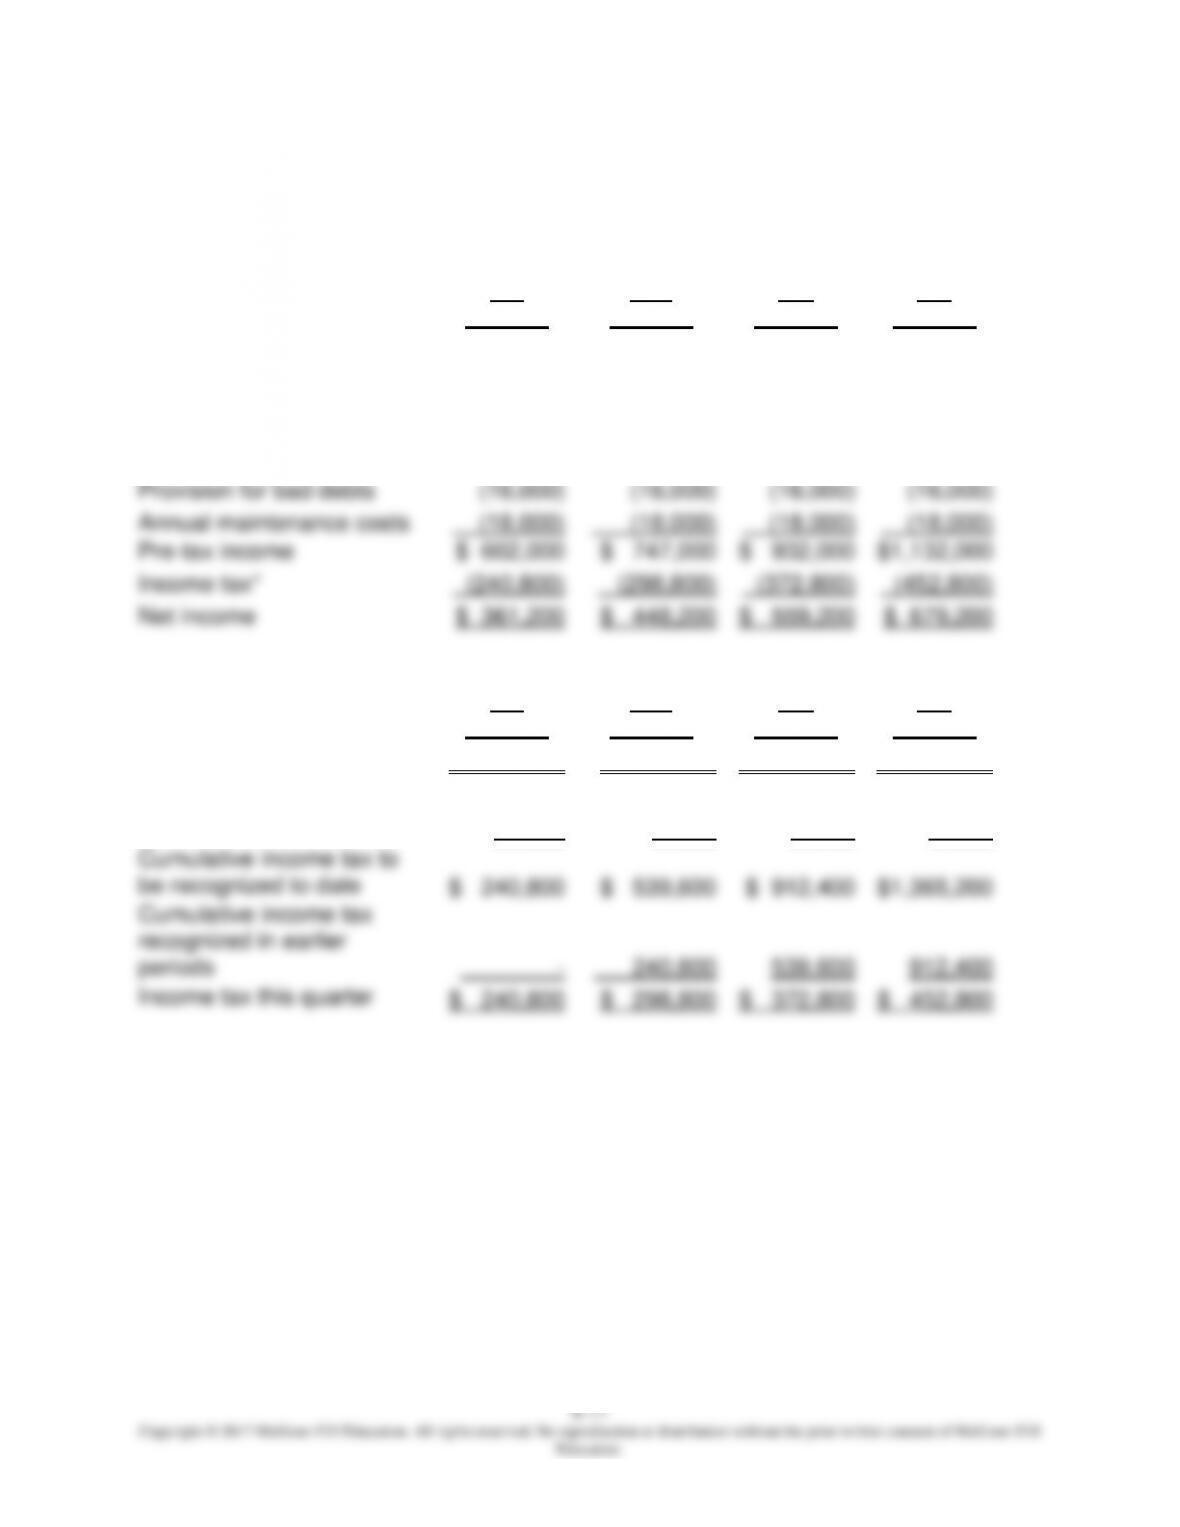
a. Determination of Income by Quarter — Estimated Annual Tax Rate 40%
1st
Quarter
2nd
Quarter
3rd
Quarter
4th
Quarter
Sales
$1,300,000
$1,560,000
$1,820,000
$2,080,000
Cost of goods sold
(430,000)
(510,000)
(580,000)
(630,000)
Administrative costs
(190,000)
(225,000)
(230,000)
(240,000)
Advertising costs
(25,000)
(25,000)
(25,000)
(25,000)
Executive bonuses
(19,000)
(19,000)
(19,000)
(19,000)
Provision for bad debts
(16,000)
(16,000)
(16,000)
(16,000)
Annual maintenance costs
(18,000)
(18,000)
(18,000)
(18,000)
Pre-tax income
$ 602,000
$ 747,000
$ 932,000
$1,132,000
Income tax*
(240,800)
(298,800)
(372,800)
(452,800)
Net income
$ 361,200
$ 448,200
$ 559,200
$ 679,200
* Calculation of income tax by quarter:
1st
Quarter
2nd
Quarter
3rd
Quarter
4th
Quarter
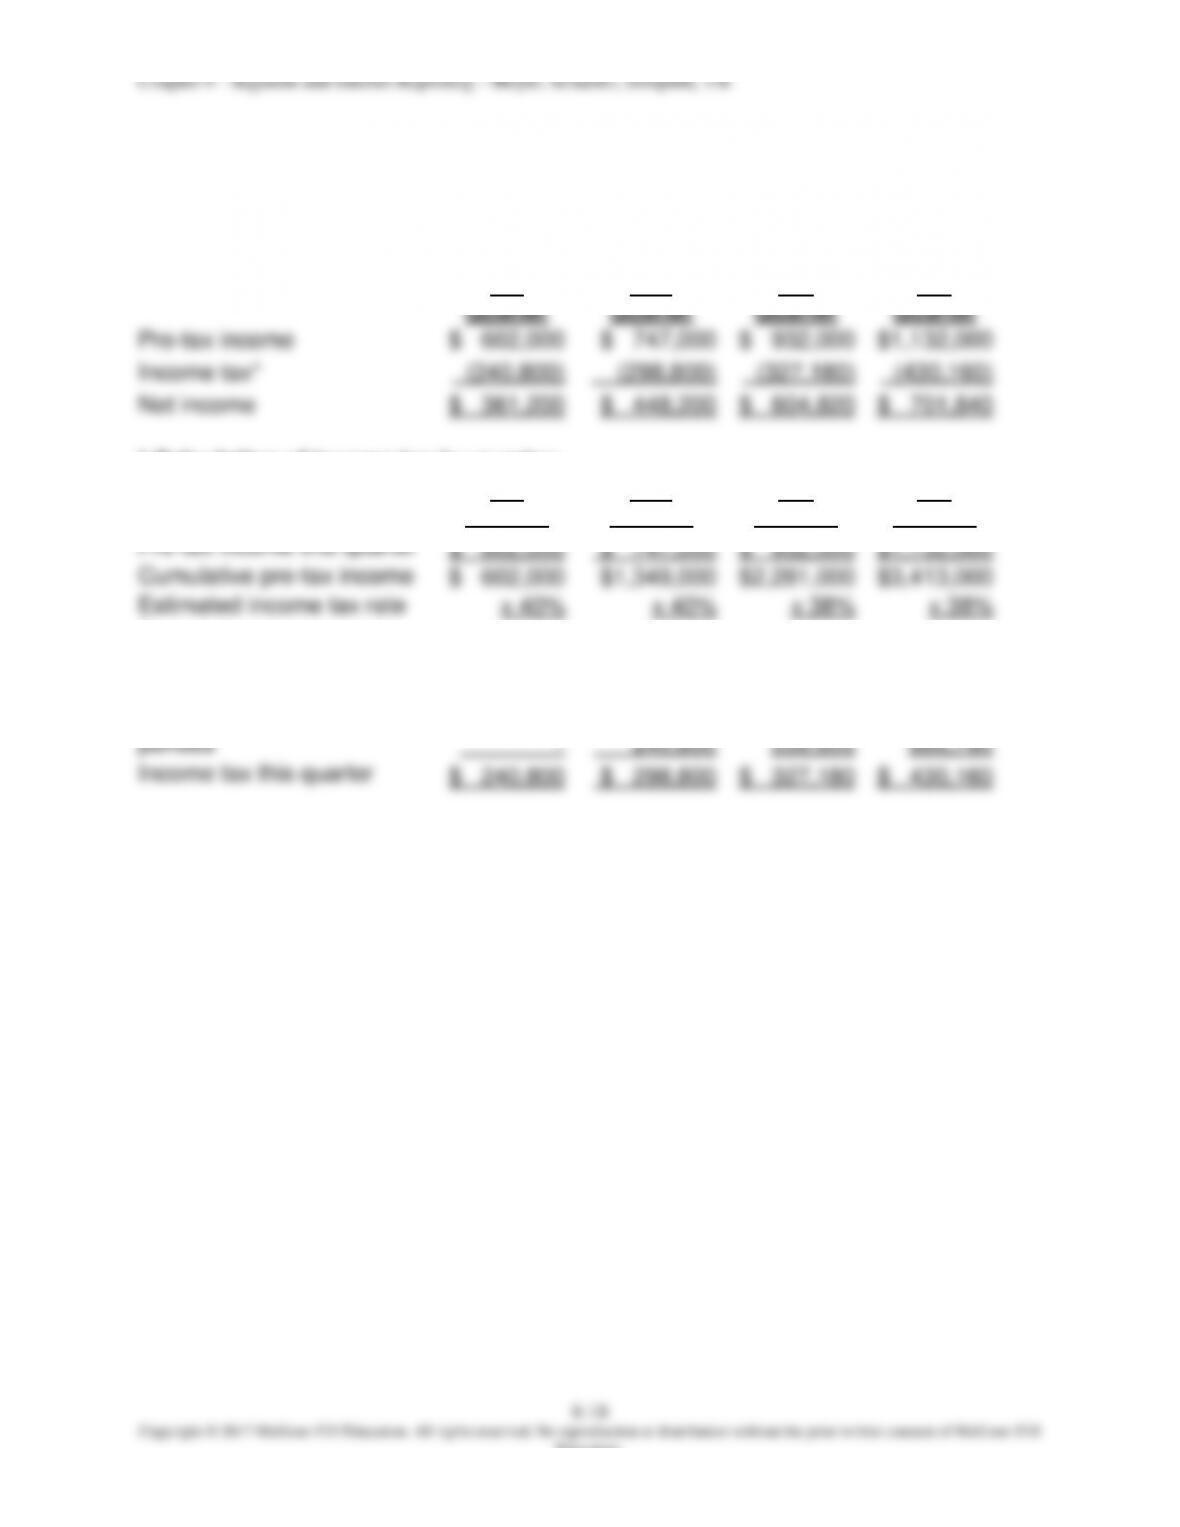
Pre-tax income this quarter
$ 602,000
$ 747,000
$ 932,000
$1,132,000
Cumulative pre-tax income
$ 602,000
$1,349,000
$2,281,000
$3,413,000
Estimated income tax rate
x 40%
x 40%
x 40%
x 40%
Cumulative income tax to
be recognized to date
$ 240,800
$ 539,600
$ 912,400
$1,365,200
Cumulative income tax
recognized in earlier
periods
–
240,800
539,600
912,400
Income tax this quarter
$ 240,800
$ 298,800
$ 372,800
$ 452,800
Education.
Chapter 8 – Segment and Interim Reporting – Hoyle, Schaefer, Doupnik, 13e
8-19
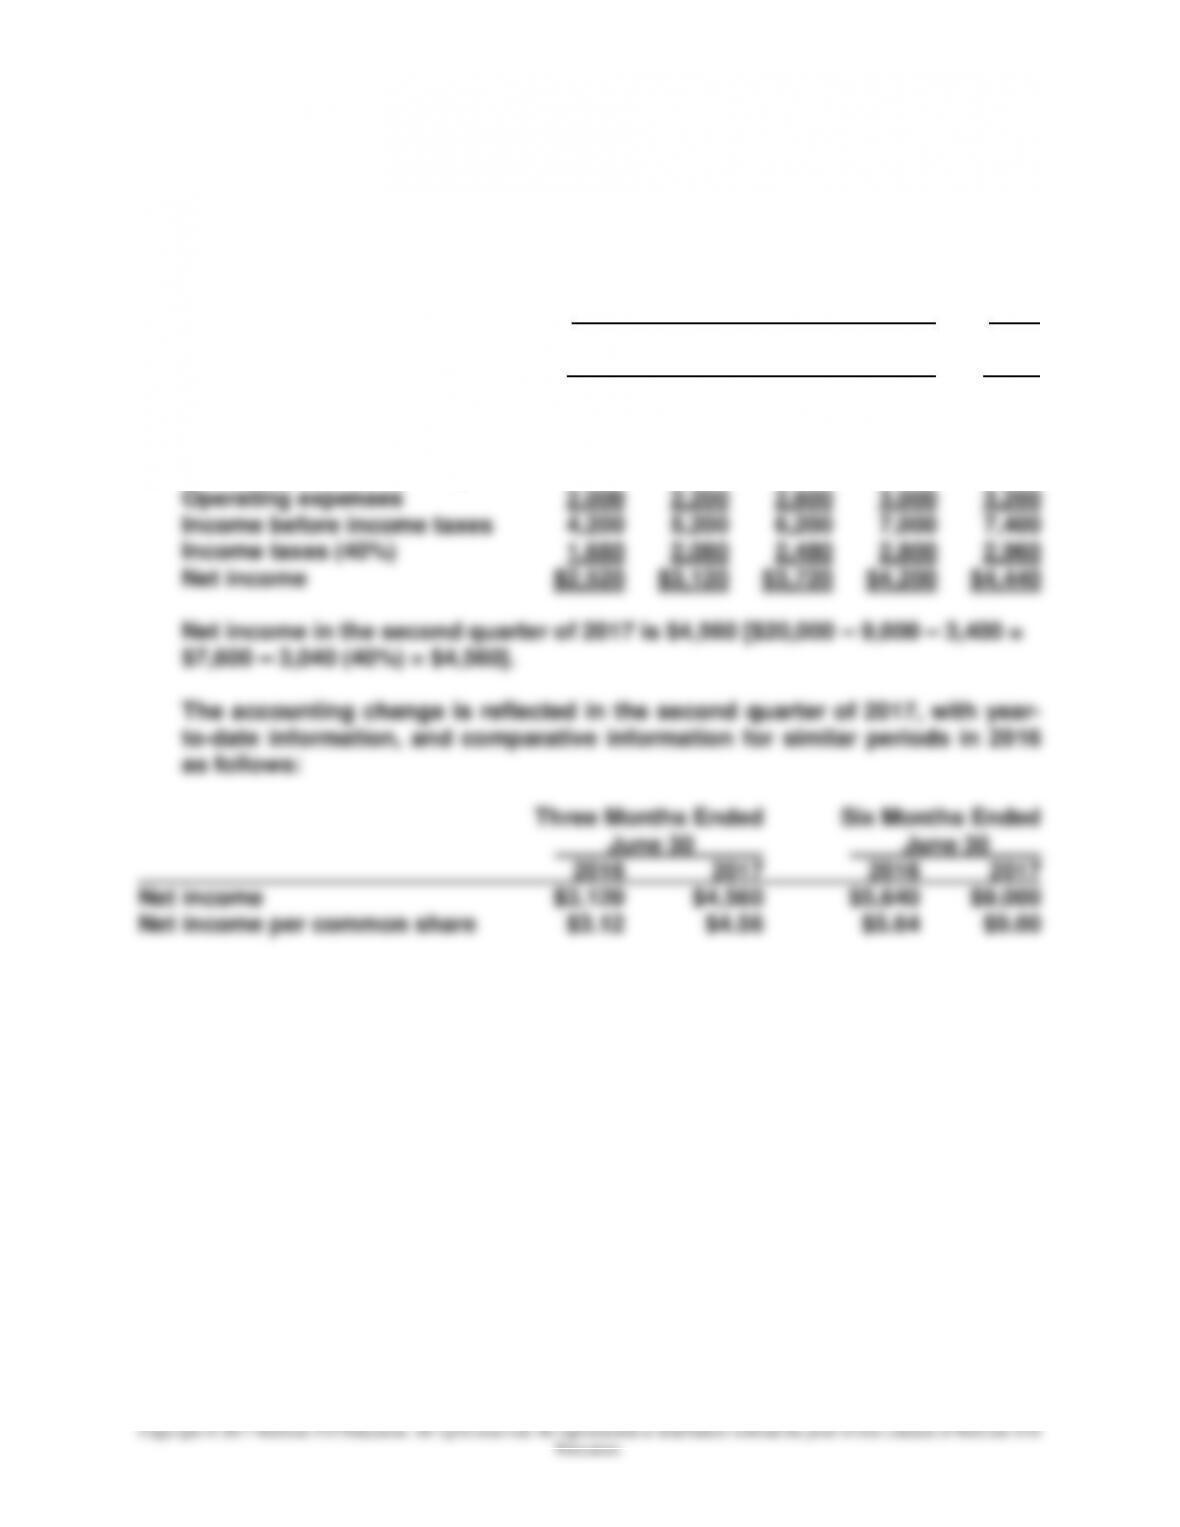
40. (15 minutes) (Treatment of accounting change made in other than first interim
period)
Retrospective application of the FIFO method results in the following
restatements of income for 2016 and the first quarter of 2017:
2016 2017
1st Q. 2nd Q. 3rd Q. 4th Q. 1st Q.
Sales $10,000 $12,000 $14,000 $16,000 $18,000
Cost of goods sold (FIFO) 3,800 4,600 5,200 6,000 7,400
8-20
Education.
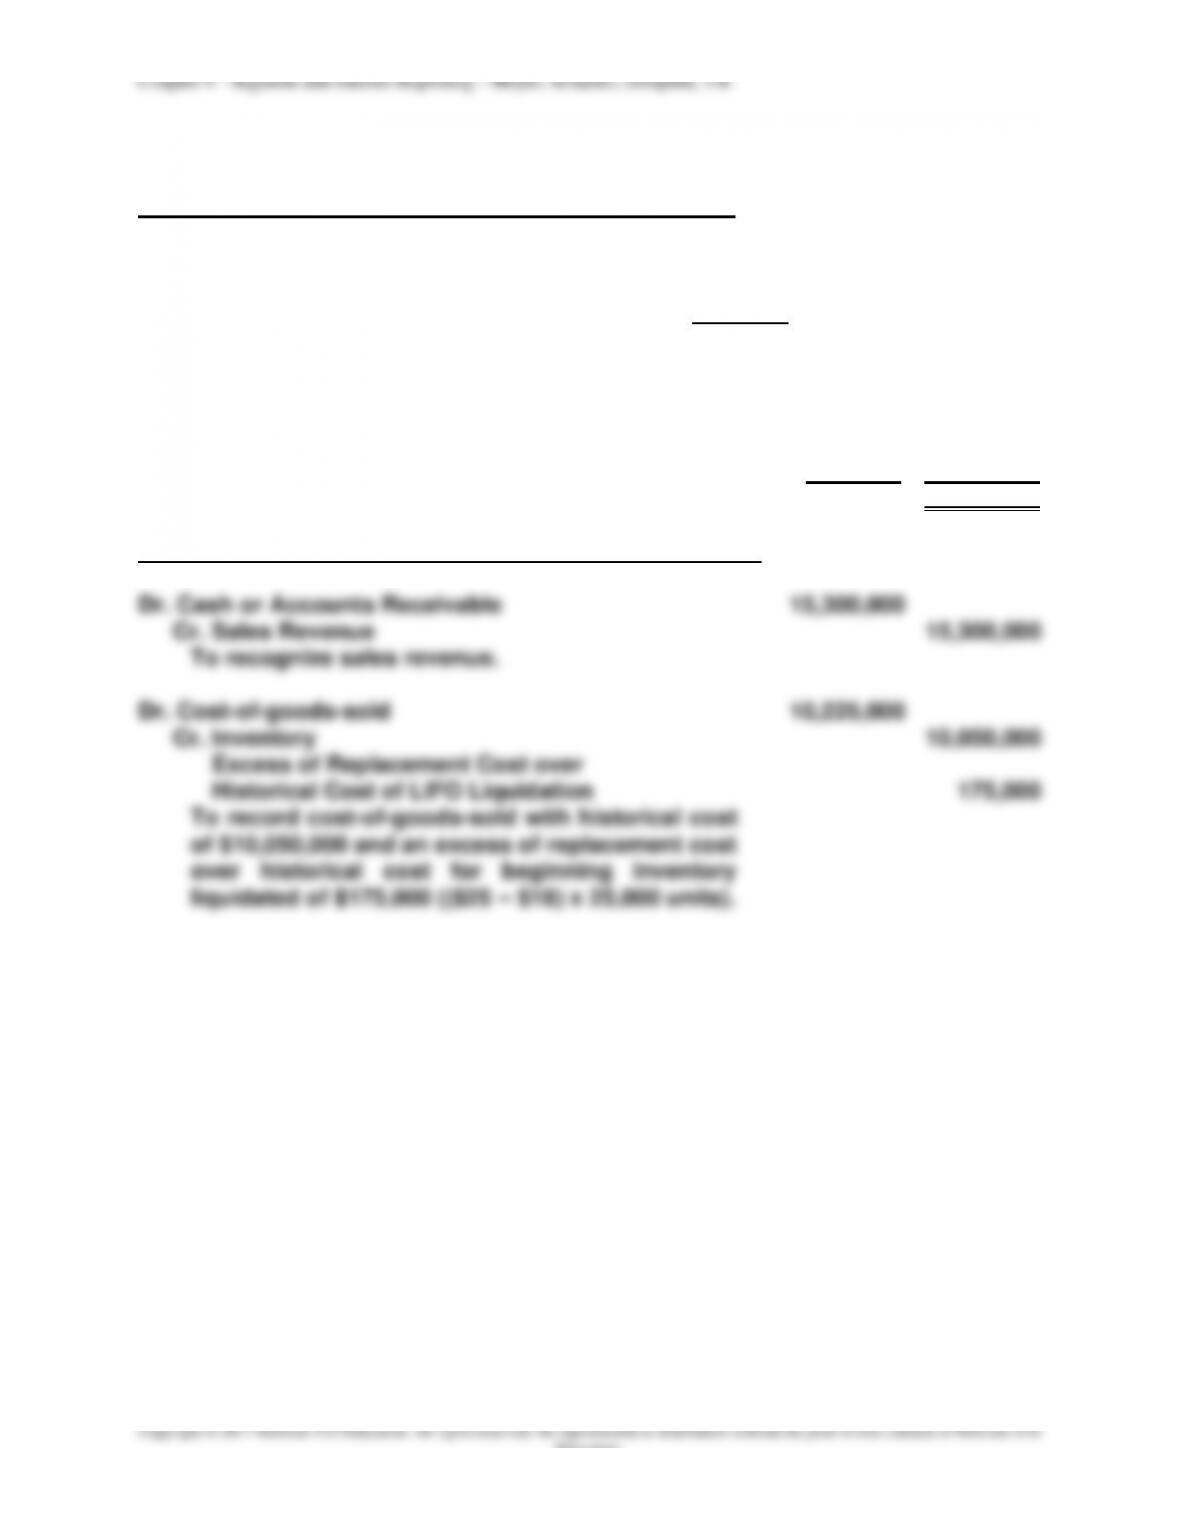
41. (10 minutes) (LIFO liquidation in interim report)
Determination of Cost-of-Goods-Sold and Gross Profit
The actual cost of the goods sold is:
400,000 units @ $24 $9,600,000
25,000 units @ $18 450,000
$10,050,000
Sales (425,000 units @ $36) $15,300,000
Cost-of-goods-sold
400,000 units @ $24 $9,600,000
25,000 units @ $25 (replacement cost) 625,000 10,225,000
Gross profit $5,075,000
Journal Entries to Record Sales and Cost–of-Goods-Sold
Chapter 8 – Segment and Interim Reporting – Hoyle, Schaefer, Doupnik, 13e
8-21
Education.
Develop Your Skills
Research Case 1—Segment Reporting (60 minutes)
This assignment requires the student to select a company and find the note
on operating segments in that company’s annual report. The responses to
this assignment will depend upon the company selected by the student for
analysis.
Research Case 2—Interim Reporting (60 minutes)
This assignment requires students to select a company, find the most recent
Research Case 3—Operating Segments (60 minutes)
This assignment requires students to find the note on operating segments in
each company’s annual report, determine three items of information (answer
three questions) from those notes, and prepare a written summary of their
findings. The primary objective of this requirement is to help students
develop their ability to present such findings in a written format. In
1. The two most important operating segments in terms of percentage of
total revenues.
The answer to this question is determined by calculating the ratio
“segment revenues/total segment revenues” for each segment of each
company. Companies might use different terms to describe revenues
including net sales and net sales to external customers. Companies are
8-22
Education.
2. The two operating segments with the largest growth in revenues.
3. The two most profitable operating segments in terms of profit margin.
This question is answered by calculating the ratio “segment
profit/segment revenues” for each segment of each company (again
using revenues from sales to external customers if separately reported).
Segment profit goes under a variety of names including operating
earnings, income from continuing operations, standard margin, and
and Analysis.
Chapter 8 – Segment and Interim Reporting – Hoyle, Schaefer, Doupnik, 13e
8-23
Education.
Research Case 4—Comparability of Geographic Area Information (60 minutes)
This assignment requires students to find the note on geographic areas in
each company‘s annual report and then prepare a report describing the
comparability of this information. In preparing this assignment, students will
U.S. U.S. U.S. U.S.
Europe Europe – –
– – E/ME/A –
– – – Developed Europe
– – – Developed Rest of the World
– – Asia/Pacific –
– Japan Japan –
– – Latin America –
– – – Emerging Markets
Rest of the World – –
Other Other Other –
The only geographic area that can be directly compared across these four
pharmaceutical companies is the United States. Bristol–Myers Squibb
provides the least detailed information of the four companies. Only Eli Lilly
and Merck report an individual country (Japan) other than the U.S. Issues
Chapter 8 – Segment and Interim Reporting – Hoyle, Schaefer, Doupnik, 13e
Education.
Evaluation Case—Operating Segment Disclosures (60 minutes)
1. Two questions must be considered in evaluating CHIC’s operating segment
disclosures: (a) have reportable operating segments been appropriately
determined, e.g., is it appropriate to combine the Helicopters and Ships
divisions into one segment designated as Other, and (b) are the disclosures
provided for each segment in compliance with FASB ASC Topic 280, Segment
Reporting?
With respect to question (a), ASC 280 allows (but does not require) segments
to be combined if they have essentially the same business activities in
essentially the same economic environments. In determining whether
business activities and environments are similar, management must consider
these aggregation criteria:
1. The nature of the products and services provided by each operating
Segments must be similar in each and every one of these areas to be
combined.
The facts of this case indicate that the types of customers and method used to
distribute products differ across the four divisions, and each division must
Other category if neither division meets any of the quantitative thresholds for
disclosure as a separate segment.
Revenue test: Total segment revenues are $11,171,005; thus, any segment
with more than $1,117,100 in sales is separately reportable.
• Automobiles, Trucks, and Helicopters meet this threshold.
Chapter 8 – Segment and Interim Reporting – Hoyle, Schaefer, Doupnik, 13e
8-25
Education.
As a result of applying these tests, each division must be reported as a
separate segment; combining Helicopters and Ships into one segment does
not comply with ASC 280.
With respect to question (b), Note X. Operating Segments prepared by CHIC’s
accountant fails to disclose information for the Helicopters and Ships
Chapter 8 – Segment and Interim Reporting – Hoyle, Schaefer, Doupnik, 13e
8-26
2. The disclosures required under ASC 280 could be provided in the following
manner:
Operating Segments
Automobiles
Trucks
Helicopters
Ships
Segment profit (loss)*
$ 881,292
$ 456,530
$ 348,878
$ (58,879)
Sales to outside parties
4,007,304
3,796,432
1,411,235
1,003,809
Intersegment sales
644,243
307,982
-0-
-0-
Depreciation and amortization
180,345
170,976
97,638
58,617
Segment assets
3,987,776
3,209,078
1,587,006
1,209,970
Expenditures for long-lived assets
349,776
365,543
276,655
23,695
Reconciliation of Segment Results to Consolidated Totals
Revenues:
Total segment revenues
$11,171,005
Elimination of intersegment revenues
952,225
Total consolidated revenues
$10,218,780
Profit or loss:
Total segment operating profit before depreciation and amortization
$ 1,627,821
Unallocated amounts:
Depreciation and amortization
(507,576)
Interest expense
(130,655)
Total consolidated income before income taxes
$ 989,590
Assets:
Total segment assets
$ 9,993,830
Unallocated corporate headquarters assets
1,008,988
Total consolidated asses
$11,002,818
Chapter 8 – Segment and Interim Reporting – Hoyle, Schaefer, Doupnik, 13e
8-27
Education.
Accounting Standards Case 1 —Segment Reporting (15 minutes)
Source of guidance: FASB ASC 280-10–55-2: Segment Reporting; Overall;
Implementation Guidance and Illustrations; Operating Segments – Equity
Method Investees
ASC 280–10–55–2 states “An equity method investee could be considered an
operating segment, if, under the specific facts and circumstances being
considered, it meets the definition of an operating segment, even though the
investor has no control over the performance of the investee.”
Thus, in response to the questions asked in the case:
(a) an equity method investment can be treated as an operating segment for
resource allocation decision, and (3) its discrete financial information is
available.
Accounting Standards Case 2—Interim Reporting (15 minutes)
Source of guidance: FASB ASC 270–10–50-6: Interim Reporting; Overall;
Disclosure; Contingencies
FASB ASC 270–10–50-6 states: “Contingencies and other uncertainties that
8-28
Education.
Analysis Case—Walmart Interim and Segment Reporting (60 minutes)
1. Assess the seasonal nature of Walmart’s sales and income for the company
as a whole and by operating segment.
The excerpt from Note 16 Quarterly Financial Data shows that Walmart
experienced a significant increase in net sales and income in the quarter
2. Assess Walmart’s profitability by quarter and by segment.
Note 16 can be used to assess profitability in terms of profit margin (Income
from continuing operations/Net sales) by quarter.
Fiscal Year Ended January 31, 2015
Amounts in millions
Q1
Q2
Q3
Q4
Income from continuing
operations
$ 3,711
$ 4,089
$ 3,826
$ 5,188
Net sales
114,167
119,336
118,076
130,650
Income from continuing
operations/Net sales
3.25%
3.43%
3.24%
3.97%
These results indicate that profit margins are highest in the fourth quarter of
the year, the quarter with the largest percentage of total sales.
Chapter 8 – Segment and Interim Reporting – Hoyle, Schaefer, Doupnik, 13e
Education.
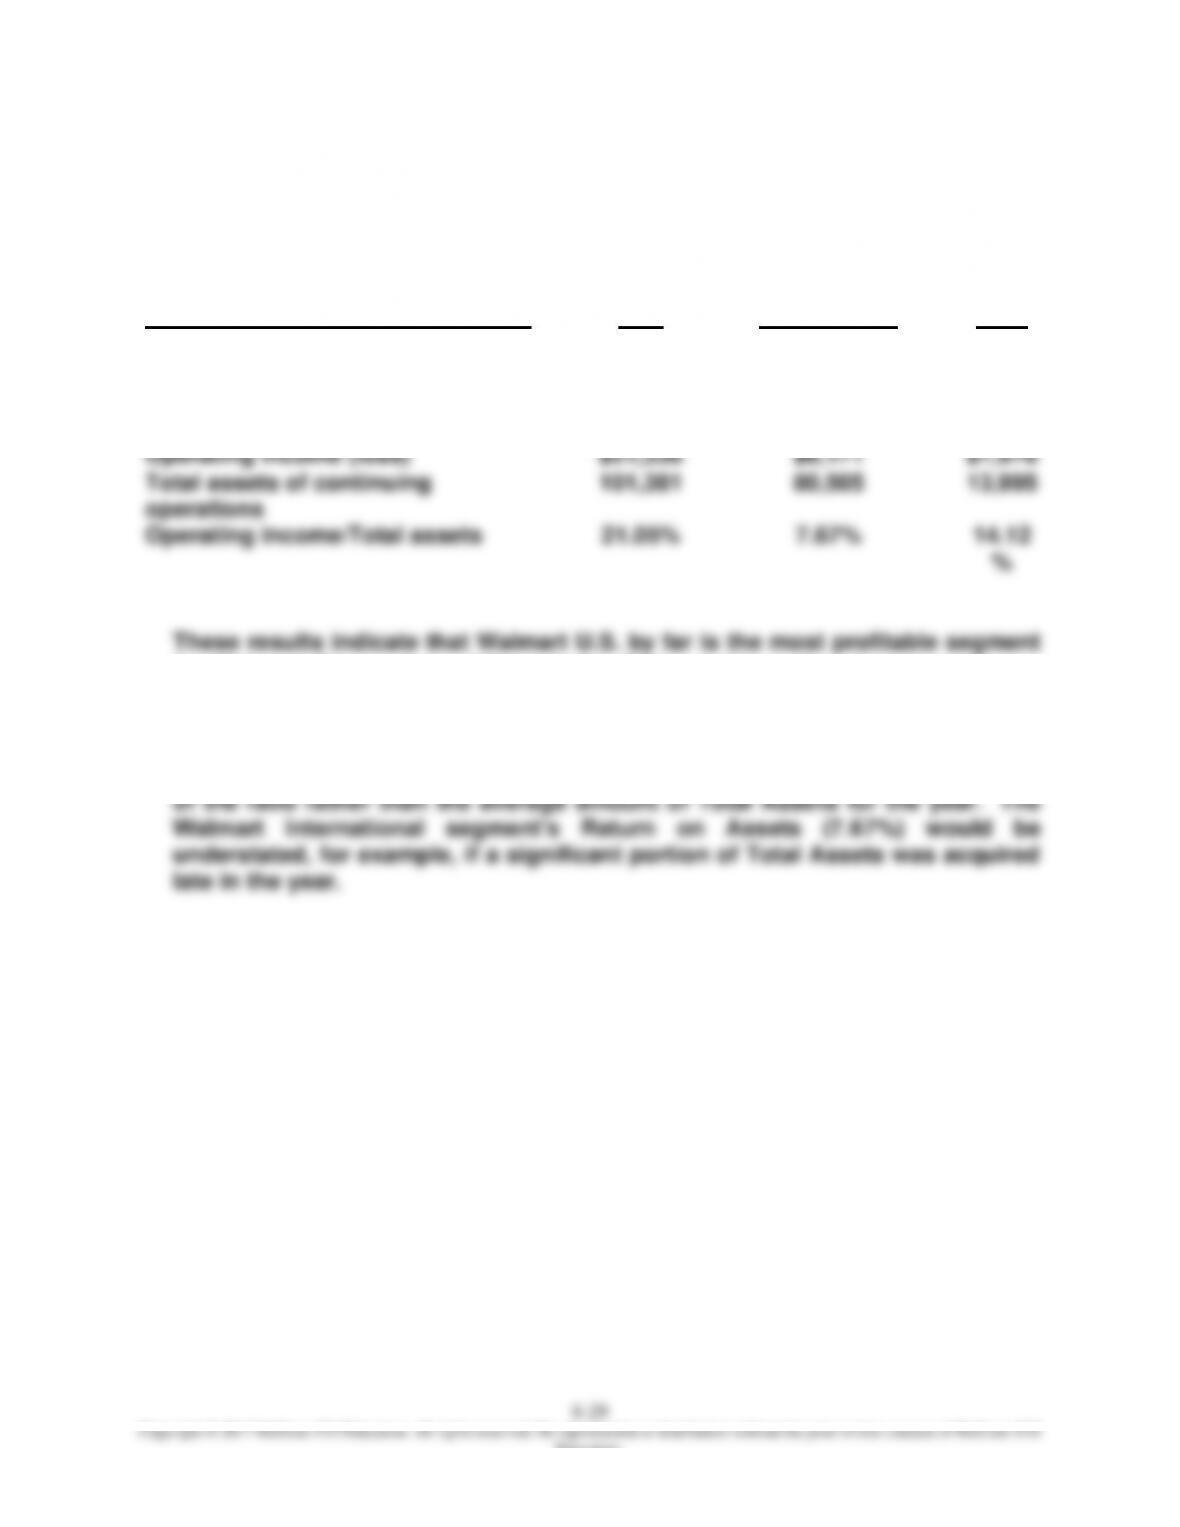
Note 14 can be used to assess profitability in terms of operating profit margin
(Operating income/Net sales) and return on assets (Operating income/Total
assets of continuing operations) by segment.
Fiscal year ended January 31, 2015
Walmart
U.S.
Walmart
International
Sam’s
Club
Operating income (loss)
$21,336
$6,171
$1,976
Net sales
288,049
136,160
58,020
Operating income/Net sales
7.41%
4.53%
3.41%
Operating income (loss)
$21,336
$6,171
$1,976
Total assets of continuing
operations
101,381
80,505
13,995
Operating income/Total assets
21.05%
7.67%
14.12
%
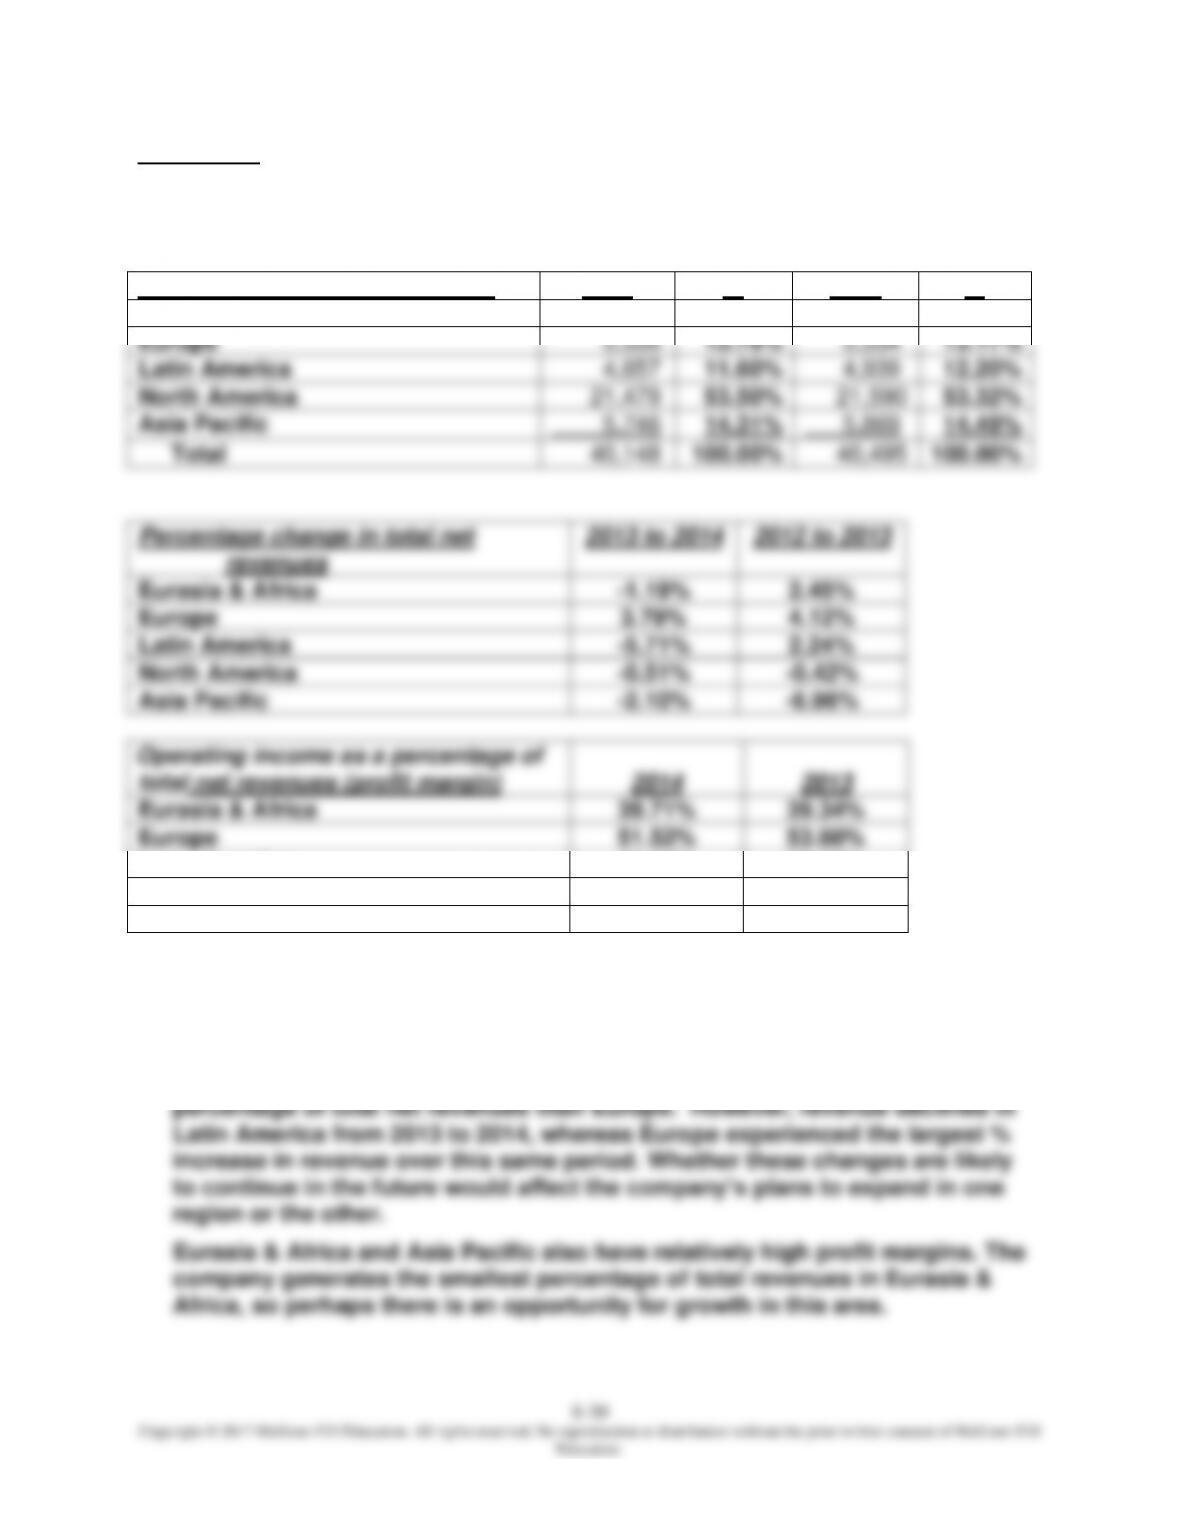
These results indicate that Walmart U.S. by far is the most profitable segment
for Walmart Stores, Inc. Although the Walmart International segment has a
reasonable Operating Profit Margin (4.53%), that segment’s Return on Assets
is very low (7.67%) compared to the other segments of Walmart. Return on
Assets must be interpreted with caution, however, because the ending
balance in Total Assets of Continuing Operations is used in the denominator
Chapter 8 – Segment and Interim Reporting – Hoyle, Schaefer, Doupnik, 13e
Excel Case—Coca-Cola Geographic Segment Information (60 minutes)
1. The ratios required to be calculated for the Coca-Cola Company are as
follows:
Percentage of total net revenues
2014
%
2013
%
Eurasia & Africa
2,730
6.80%
2,763
6.82%
Europe
5,536
13.79%
5,334
13.17%
Latin America
4,657
11.60%
4,939
12.20%
North America
21,479
53.50%
21,590
53.32%
Asia Pacific
5,746
14.31%
5,869
14.49%
Total
40,148
100.00%
40,495
100.00%
Eurasia & Africa
Europe
Latin America
North America
Asia Pacific
Eurasia & Africa
39.34%
Europe
Latin America
North America
11.26%
Asia Pacific
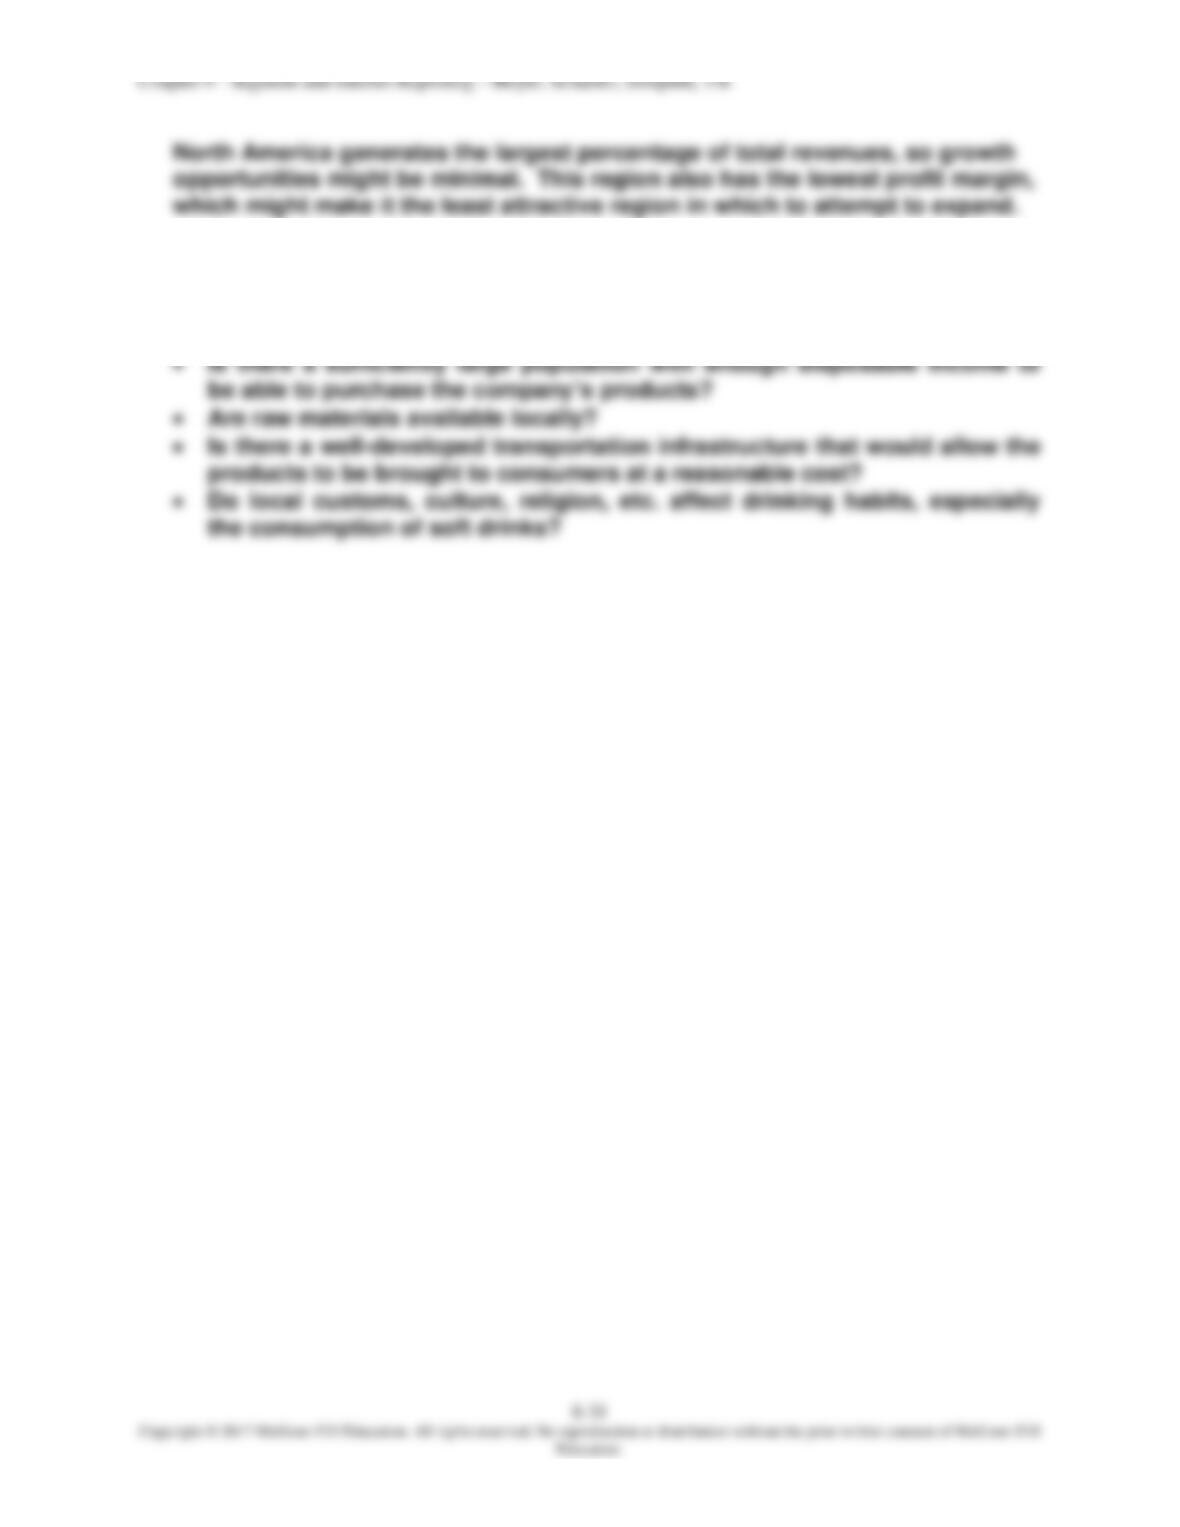
8-31
Copyright © 2017 McGraw-Hill Education. All rights reserved. No reproduction or distribution without the prior written consent of McGraw-Hill
Education.
3. There is a great deal of non-accounting information that one would need to
determine a specific region of the world in which to focus expansion. For
example, one might need to gather information to answer the following
questions: