Unlock document.
This document is partially blurred.
Unlock all pages and 1 million more documents.
Get Access
Chapter 9: Competitive Markets
Solutions Manual
Learning Objectives for Chapter 9
After reading this chapter, you should know
LO 09-01. The market characteristics of perfect competition.
LO 09-02. How prices are established in competitive markets.
LO 09-03. Why long-run economic profits approach zero in competitive markets.
LO 09-04. How society benefits from market competition.
Questions for Discussion
1. Why would anyone want to enter a profitable industry knowing that profits would
eventually be eliminated by competition? (LO 09-03)
2. Why wouldn’t producers necessarily want to produce output at the lowest average
cost? Under what conditions would they end up doing so? (LO 09-01)
3. What industries do you regard as being highly competitive? Can you identify any
barriers to entry in those industries? (LO 09-01)
1
© 2016 by McGraw-Hill Education. This is proprietary material solely for authorized instructor use. Not authorized for sale or
distribution in any manner. This document may not be copied, scanned, duplicated, forwarded, distributed, or posted on a website, in
whole or part.
4. Why have flat-panel TV prices fallen so much? (See the World View, p. 193.)
(LO 09-02)
5. What does the “bleeding” highlighted in the News on page 191 refer to? What
causes it? What cures it? (LO 09-03)
6. As the price of computers fell, what happened to their quality? How is this
possible? (LO 09-04)
7. Can phone rates keep falling in India? What will cause them to rise? (See World
View, p. 204.) (LO 09-04)
2
© 2016 by McGraw-Hill Education. This is proprietary material solely for authorized instructor use. Not authorized for sale or
distribution in any manner. This document may not be copied, scanned, duplicated, forwarded, distributed, or posted on a website, in
whole or part.
8. Is “long-run” equilibrium permanent? What forces might dislodge it? (LO 09-03)
9. What would happen to iPad sales and profits if Apple kept price and profit margins
high? (LO 09-01)
10. Identify two products that have either (a) fallen sharply in price or (b) gotten
significantly better without price increases. How did these changes come about?
(LO 09-04)
11. What will drive the price of an iPad down to $99? How long will it take?
(LO 09-02)
Problems
1. According to the News on page 204, between 2000 and 2011 in India,
(a) By what percentage did the price of a phone minute decline after competition
emerged?
(b) By what percentage did the quantity demanded increase?
3
© 2016 by McGraw-Hill Education. This is proprietary material solely for authorized instructor use. Not authorized for sale or
distribution in any manner. This document may not be copied, scanned, duplicated, forwarded, distributed, or posted on a website, in
whole or part.
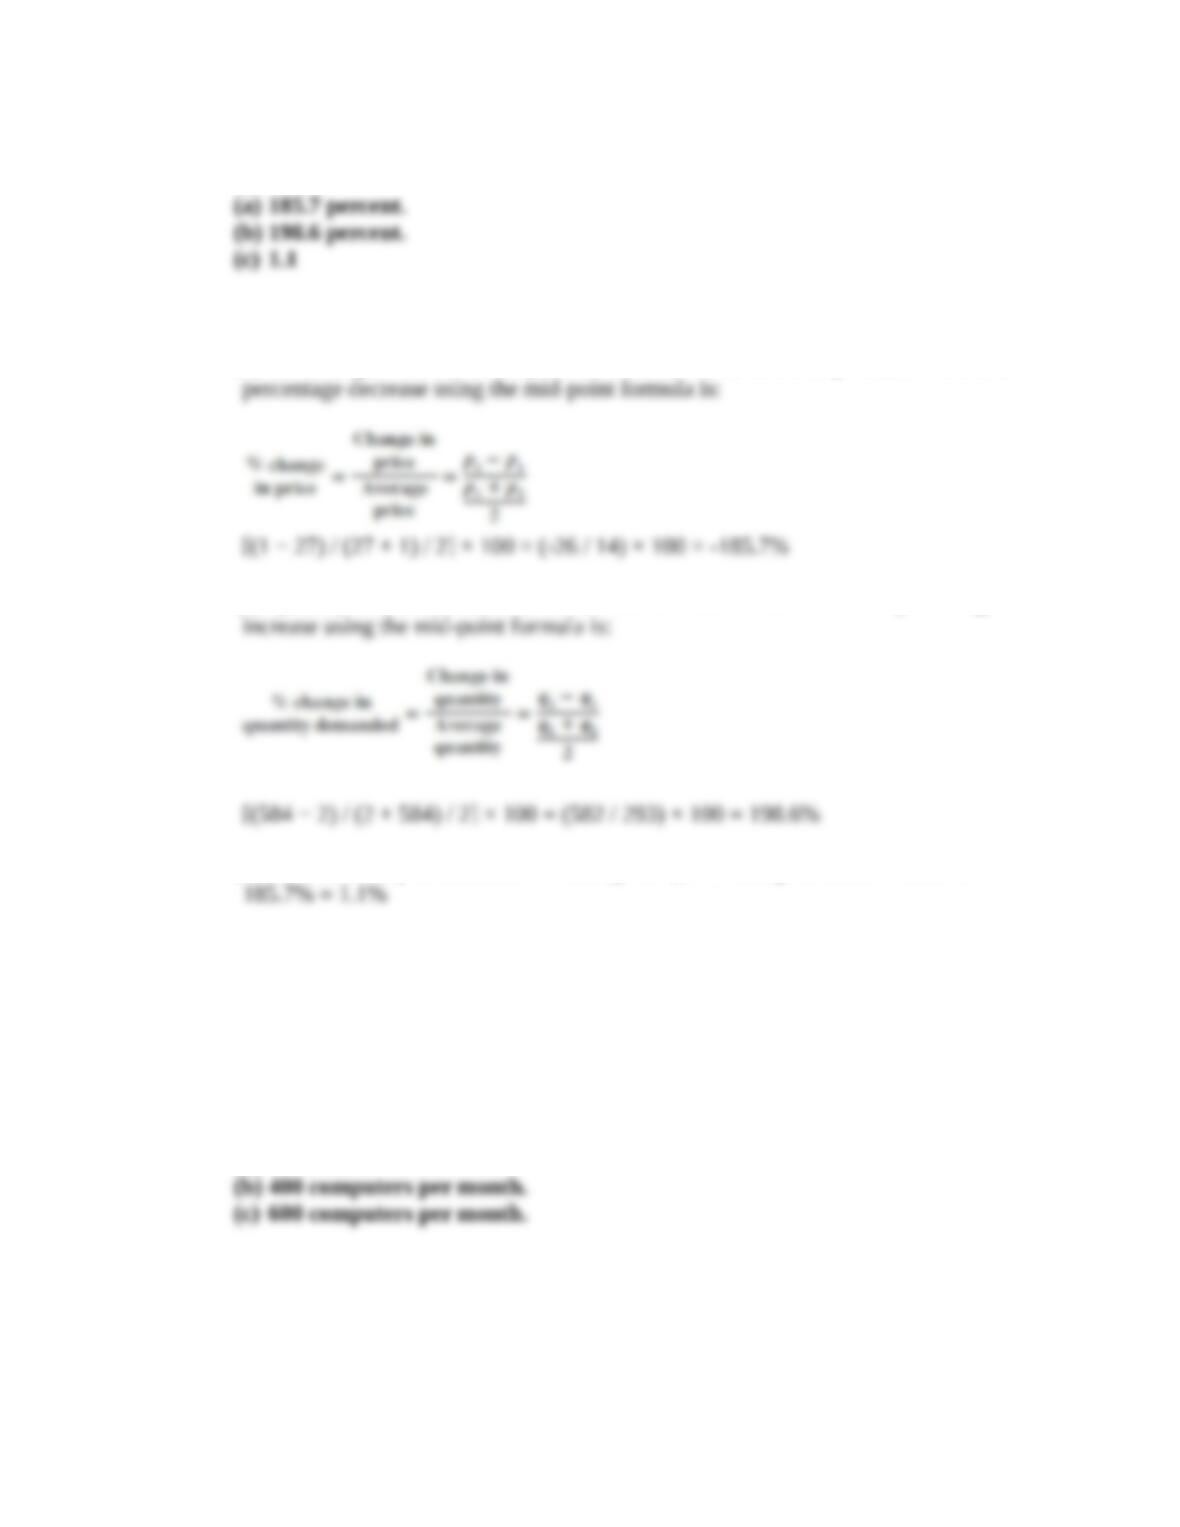
(c) What was the apparent price elasticity of demand? (LO 09-03)
Answers:
Feedback:
(a) According to the article the price fell from 27 cents to 1 cent per minute. So the
(b) Quantity demanded increased to 584 million from 2 million. So the percentage
(c) Price Elasticity of Demand = % change in Qd / % change in Price = 198.6% /
2. According to Table 9.1,
(a) What were the fixed costs of production for the firm?
(b) At what rate of output was profit per computer maximized? (Choose the highest
output level.)
(c) At what output rate was total profit maximized? (LO 09-02)
Answers:
(a) $60,000.
Feedback:
(a) Total costs associated with an output of zero represent the fixed costs of a firm.
In this case the total cost associated with an output of zero is $60,000.
4
© 2016 by McGraw-Hill Education. This is proprietary material solely for authorized instructor use. Not authorized for sale or
distribution in any manner. This document may not be copied, scanned, duplicated, forwarded, distributed, or posted on a website, in
whole or part.
(b) Profit per computer is determined by dividing total profit by the number of
(c) Producers seek the rate of output at which total profit is maximized. This is at
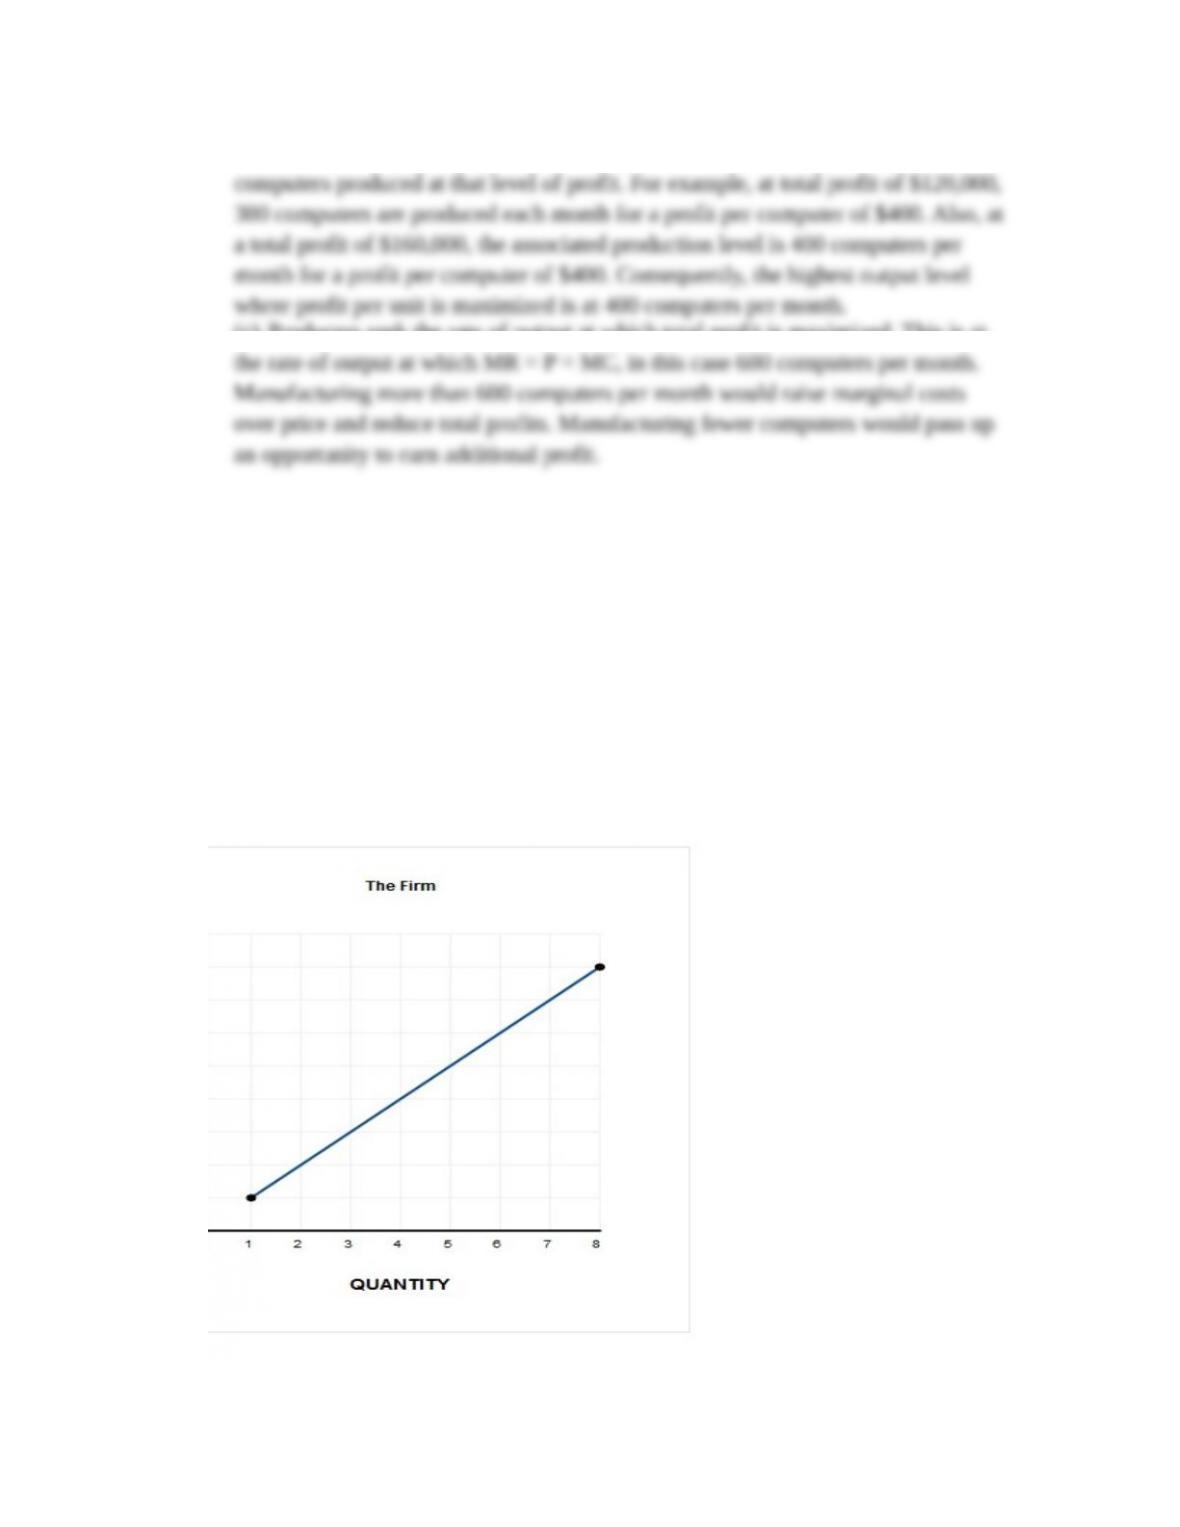
3. Suppose the following data summarize the costs of a perfectly competitive firm:
Quantity 0 1 2 3 4 5 6 7 8
Total cost $100 101 103 106 110 115 121 128 136
(a) Draw the firm’s MC curve on the graph on the left here.
(b) Draw the market supply curve on the right graph, assuming 8 firms identical to
the one just described.
(c) What is the equilibrium price in this market? (LO 09-01)
Answers:
(a) Marginal cost curve:
5
© 2016 by McGraw-Hill Education. This is proprietary material solely for authorized instructor use. Not authorized for sale or
distribution in any manner. This document may not be copied, scanned, duplicated, forwarded, distributed, or posted on a website, in
whole or part.
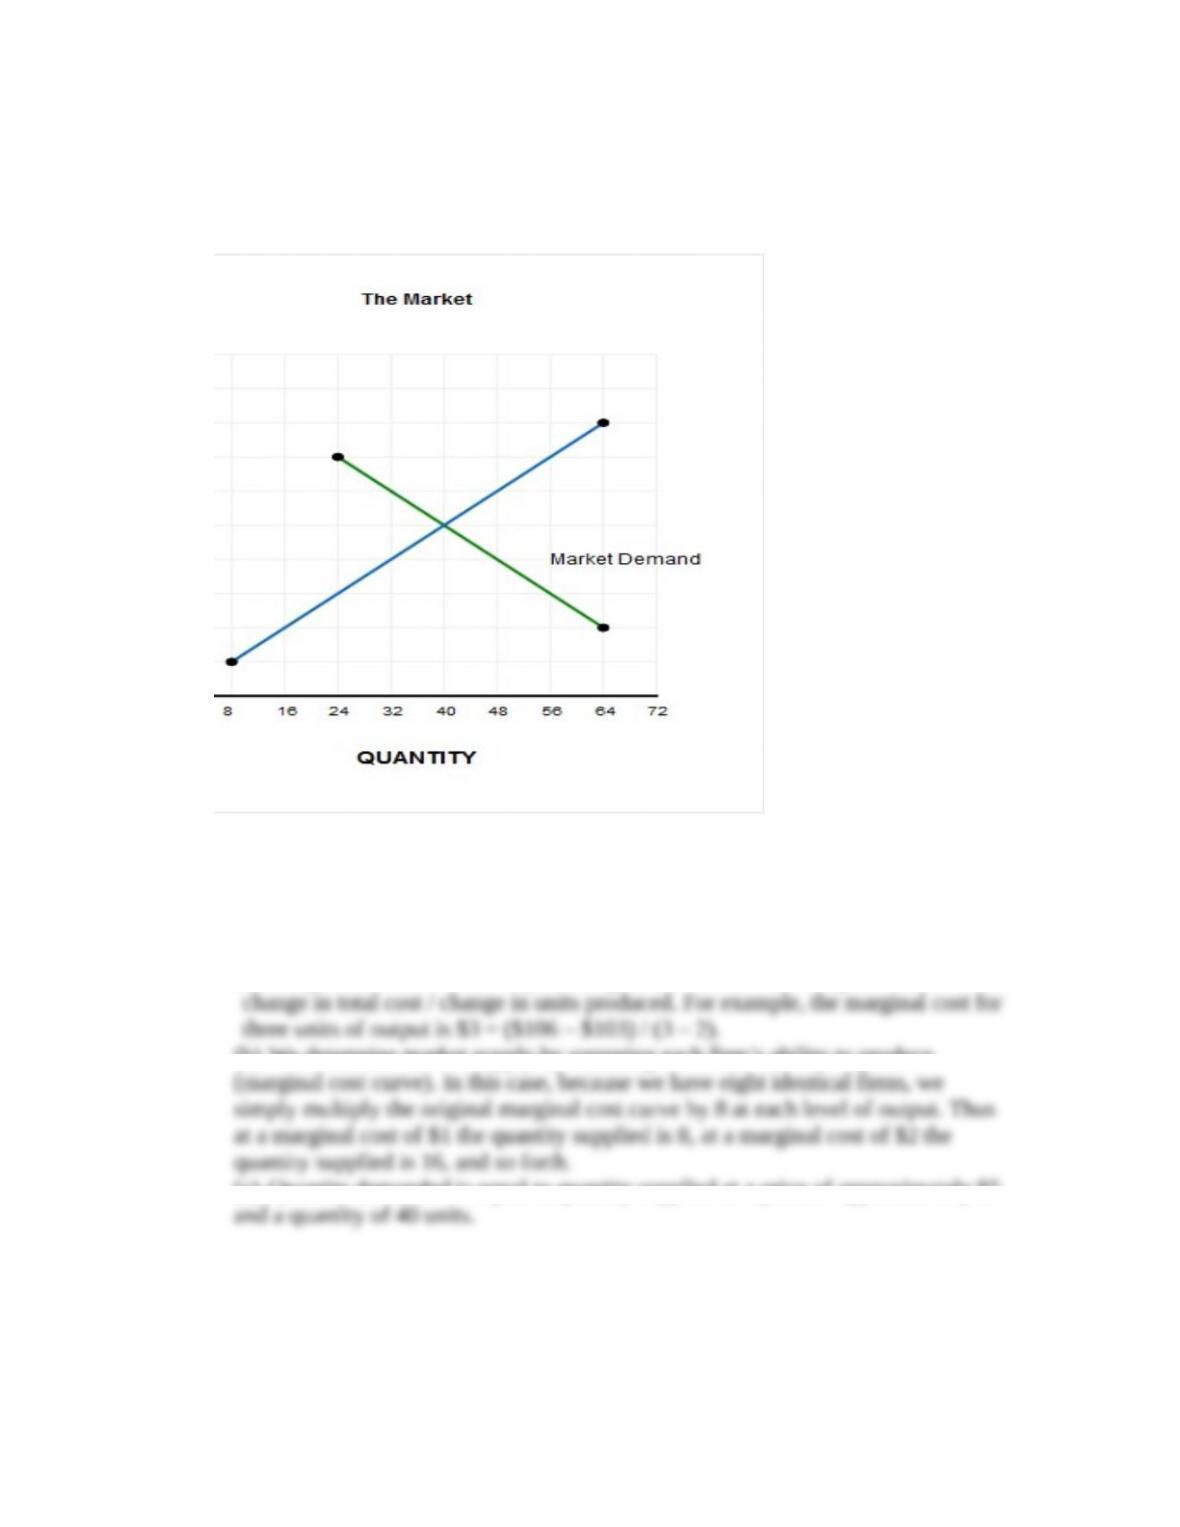
(b) Supply and demand curve:
(c) $5.00.
Feedback:
(a) Marginal cost is the cost of producing an additional unit. Marginal cost =
(b) We determine market supply by summing each firm’s ability to produce
(c) Quantity demanded is equal to quantity supplied at a price of approximately $5
6
© 2016 by McGraw-Hill Education. This is proprietary material solely for authorized instructor use. Not authorized for sale or
distribution in any manner. This document may not be copied, scanned, duplicated, forwarded, distributed, or posted on a website, in
whole or part.


