Chapter 4: The Role of Government
Solutions Manual
Learning Objectives for Chapter 4
After reading this chapter, you should know
LO 04-01. The nature and causes of market failure.
LO 04-02. How the public sector has grown.
LO 04-03. Which taxes finance state, local, and federal governments.
LO 04-04. The meaning of government failure.
Questions for Discussion
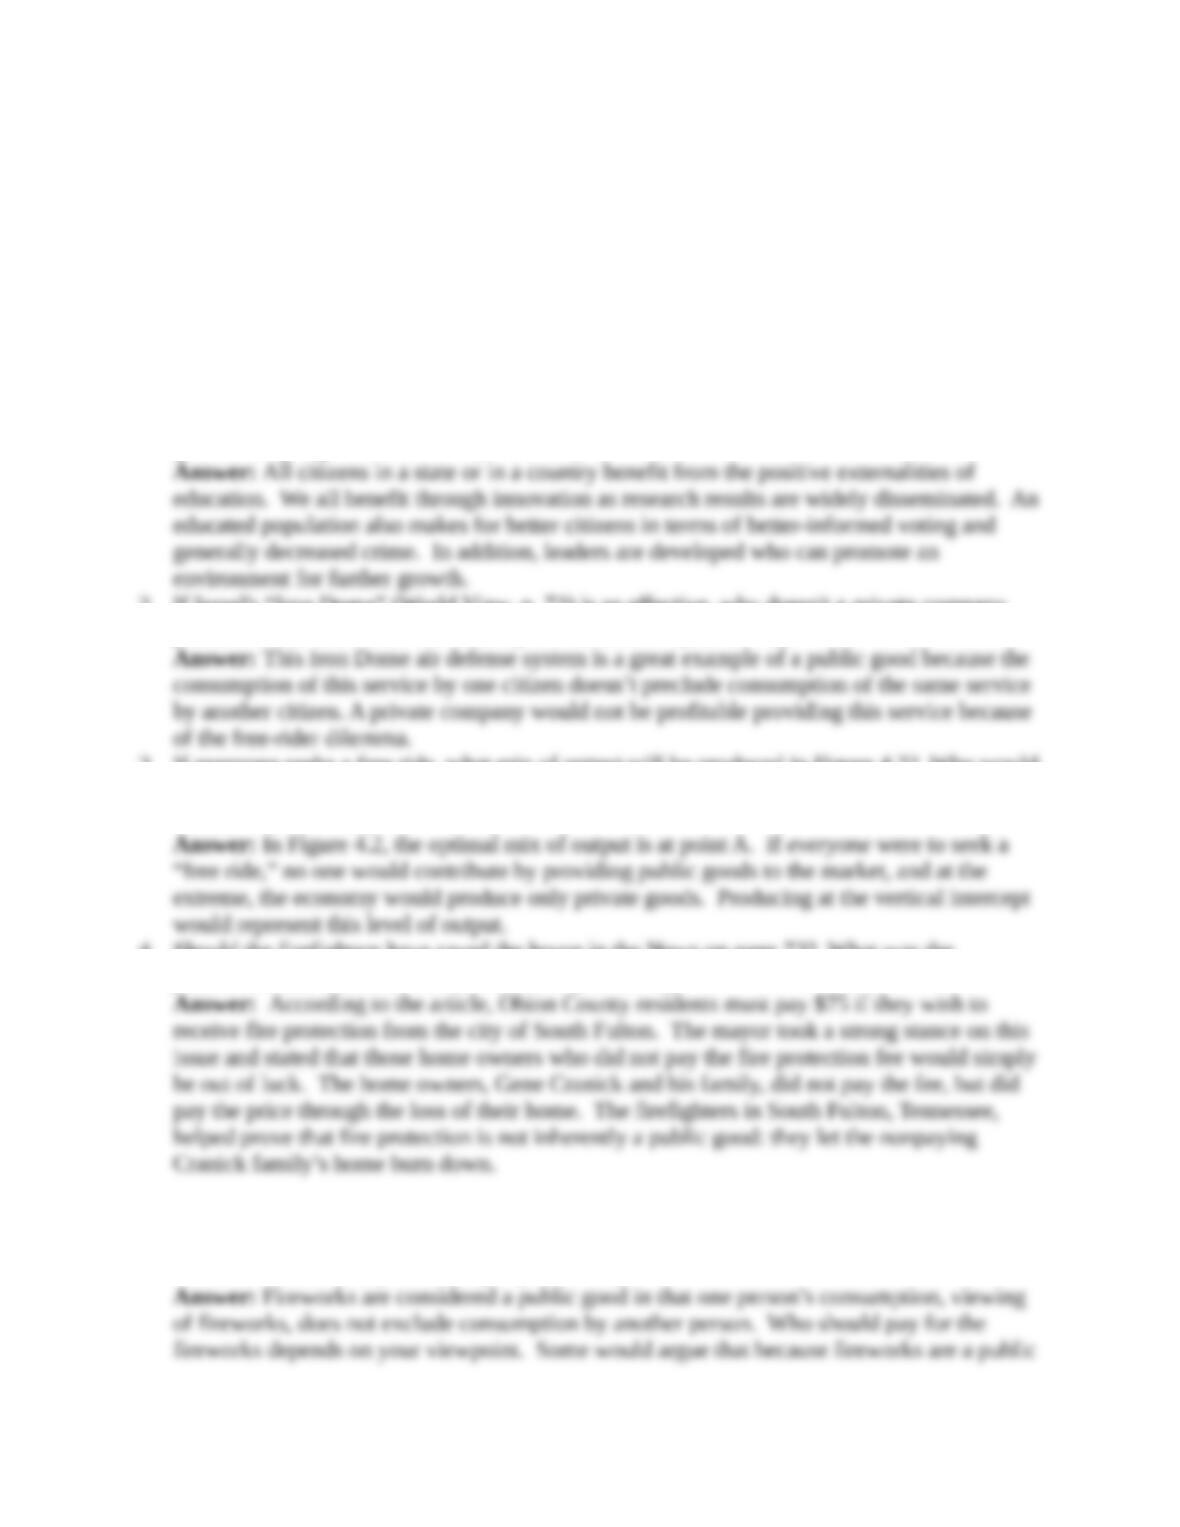
1. Why should taxpayers subsidize public colleges and universities? What external benefits are
generated by higher education? (LO 04-01)
2. If Israel’s “Iron Dome” (World View, p. 72) is so effective, why doesn’t a private company
produce it and sell its services directly to consumers? (LO 04-01)
3. If everyone seeks a free ride, what mix of output will be produced in Figure 4.2? Why would
anyone voluntarily contribute to the purchase of public goods like flood control or snow
removal? (LO 04-01)
4. Should the firefighters have saved the house in the News on page 73? What was the
justification for their belated intervention? (LO 04-01)
5. Why might Fourth of July fireworks be considered a public good? Who should pay for
them? What about airport security? (LO 04-01)
1
© 2016 by McGraw-Hill Education. This is proprietary material solely for authorized instructor use. Not authorized for sale or distribution in any
manner. This document may not be copied, scanned, duplicated, forwarded, distributed, or posted on a website, in whole or part.
6. What is the specific market failure justification for government spending on (a) public
universities, (b) health care, (c) trash pickup, (d) highways, (e) police, and (f) solar energy?
Would a purely private economy produce any of these services? (LO 04-01)
Answers:
(a) Government spending on public universities can be justified based on the external benefit
(b) Government spending on health care can be justified based on equity considerations. In
(c) Trash pickup can be justified based on externalities. When trash pickup is not provided,
(d) Highways are a good for which, in most instances, one person’s consumption does not
preclude another’s consumption. Although theoretically we could restrict the use of streets to
(e) Police services, including the administration of justice, are another example of a public
good. One person’s consumption of police protection does not reduce the level of police
(f) Solar energy has positive externalities associated with it. More precisely, solar energy
has fewer negative externalities associated with it compared to other energy sources. Solar
7. If smoking generates external costs, should smoking simply be outlawed? How about cars
that pollute? (LO 04-01)
Answer: Our society must balance external cost issues with personal choice. Consequently,
governmental bodies have taken action to discourage smoking (via taxes) and protect the
rights of nonsmokers (by limiting smoking in public places.) Such action acts as a
2
© 2016 by McGraw-Hill Education. This is proprietary material solely for authorized instructor use. Not authorized for sale or distribution in any
manner. This document may not be copied, scanned, duplicated, forwarded, distributed, or posted on a website, in whole or part.
8. The government now spends over $700 billion a year on Social Security benefits. Why don’t
we leave it to individuals to save for their own retirement? (LO 04-01)
Answer: We are not willing to have individuals rely entirely on their own marginal utilities
concerning future versus present income because of two important factors: (1) society holds
9. What government actions might cause failures like points G1, G2, and G3 in Figure 4.6? Can
you give examples? (LO 04-01)
Answer: The issue of government failure encompasses two distinct concepts: (1) efficiency
10. How does XM Satellite deter nonsubscribers from listening to its transmissions? Does this
make radio programming a private good or a public good? (LO 04-01)
11. Should the government be downsized? Which functions should be cut back? Which ones
should be expanded? (LO 04-02)
Answer: Most people agree that downsizing should occur, but can’t agree to what extent.
12. Which taxes hit the poor hardest—those of local, state, or federal governments? (LO 04-03)
Problems
1. In Figure 4.2 (p. 74), by how much is the market
(a) Overproducing private goods?
(b) Underproducing public goods? (LO 04-01)
3
© 2016 by McGraw-Hill Education. This is proprietary material solely for authorized instructor use. Not authorized for sale or distribution in any
manner. This document may not be copied, scanned, duplicated, forwarded, distributed, or posted on a website, in whole or part.
Answers:
Feedback:
(a) According to the figure, the optimal mix of output is point A. The market is producing
(b) Once again, according to the figure, the optimal mix of output is point A. The market is
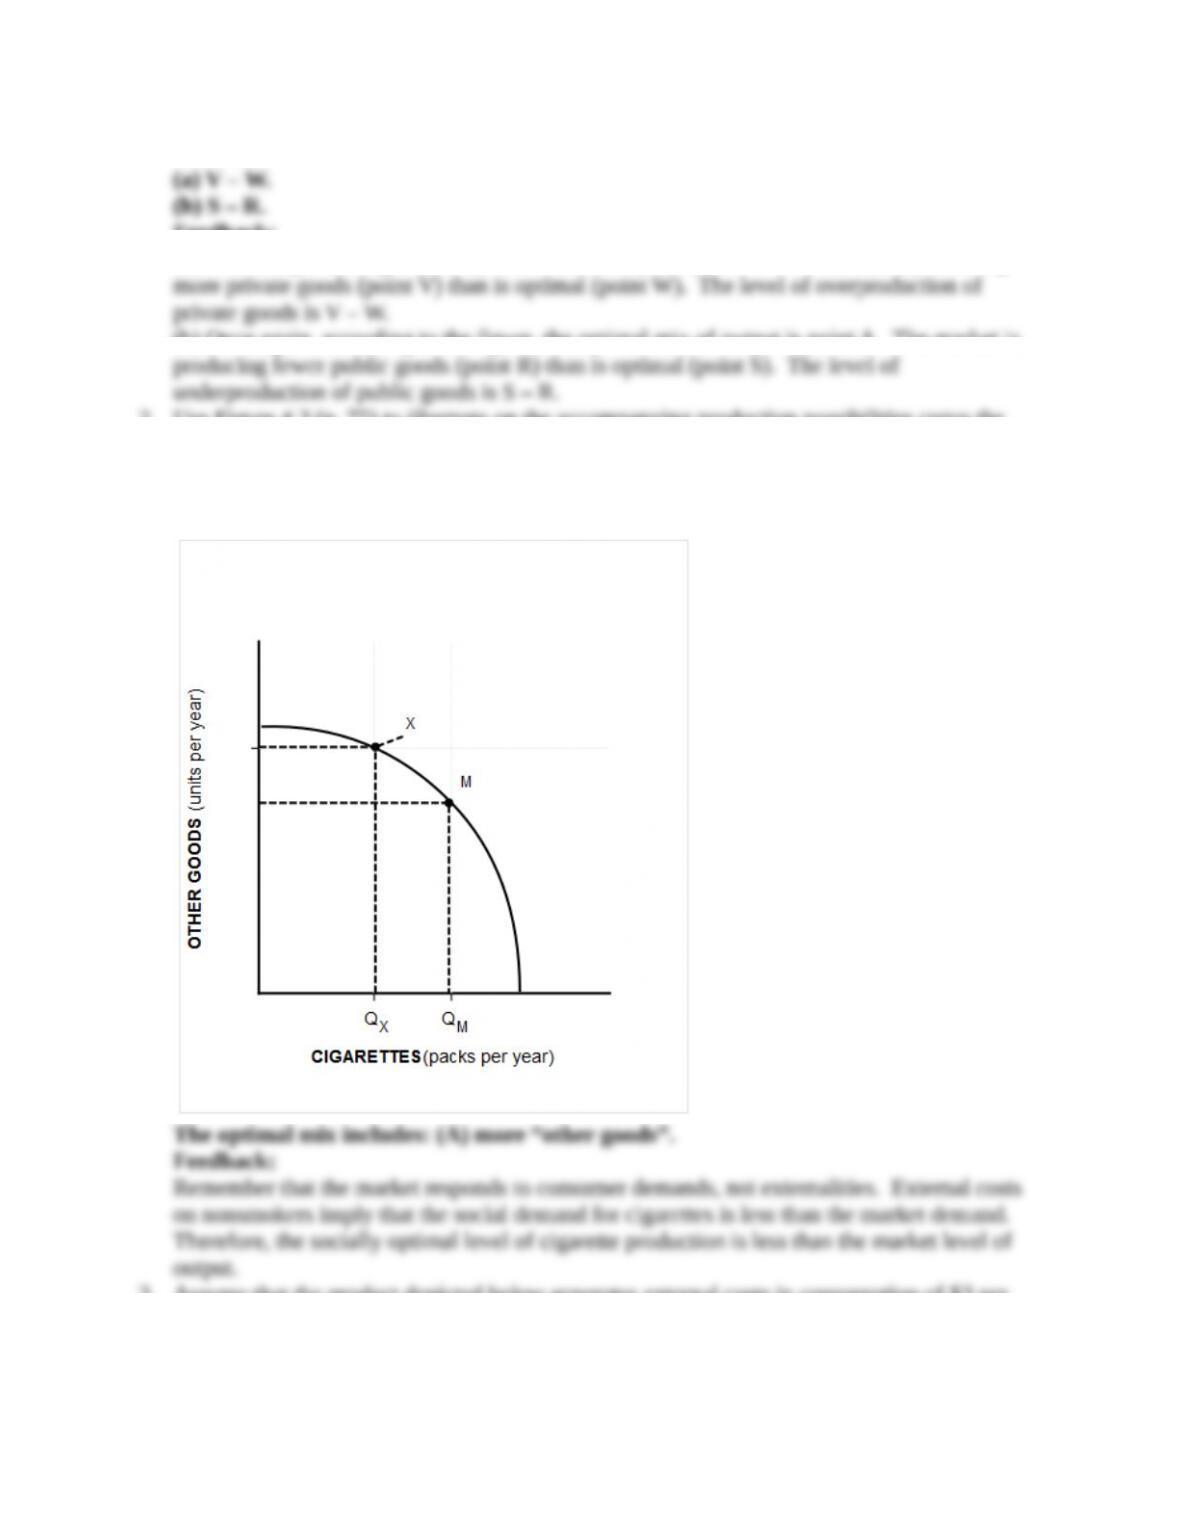
2. Use Figure 4.3 (p. 75) to illustrate on the accompanying production possibilities curve the
optimal mix of output (X).
(a) Does the optimal mix include (A) more or (B) fewer “other goods”? (LO 04-01)
Answer:
3. Assume that the product depicted below generates external costs in consumption of $3 per
unit.
(a) What is the market price (market value) of the product?
(b) Draw the social demand curve.
4
© 2016 by McGraw-Hill Education. This is proprietary material solely for authorized instructor use. Not authorized for sale or distribution in any
manner. This document may not be copied, scanned, duplicated, forwarded, distributed, or posted on a website, in whole or part.
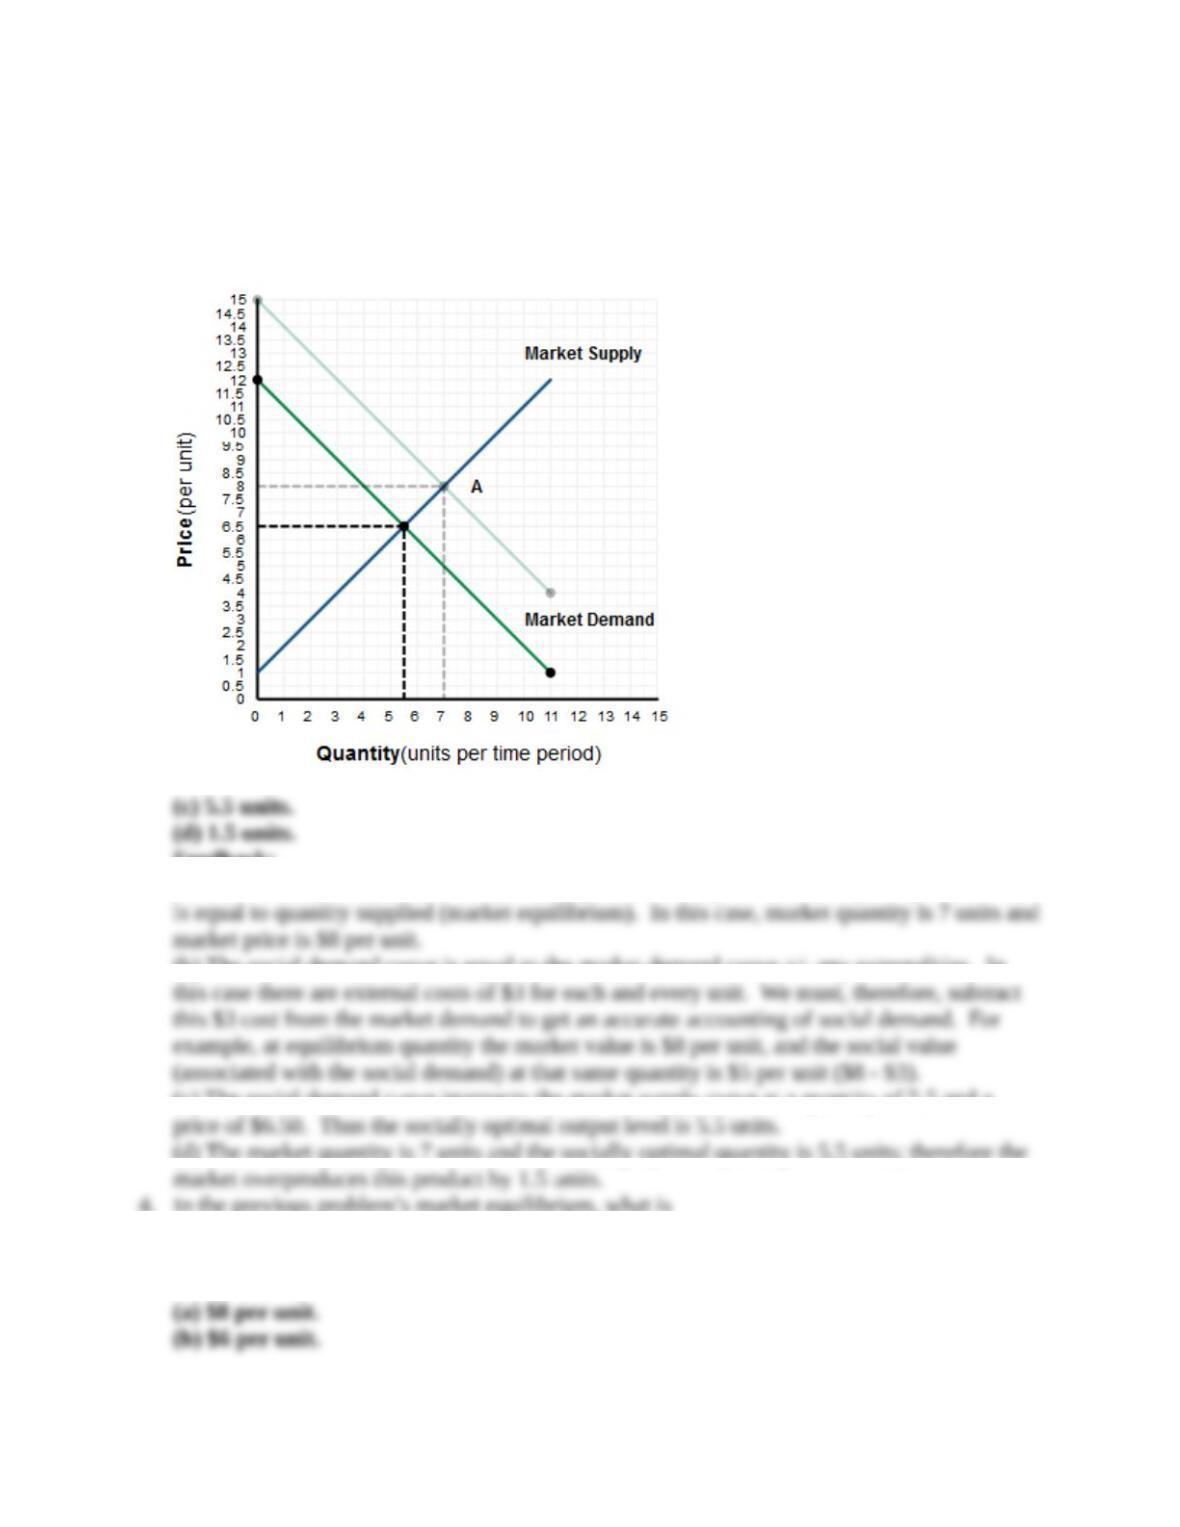
(c) What is the socially optimal output?
(d) By how much does the market overproduce this good? (LO 04-01)
Answers:
(a) $8 per unit.
(b)
Feedback:
(a) The market price (market value) for any product is the price at which quantity demanded
(b) The social demand curve is equal to the market demand curve +/- any externalities. In
(c) The social demand curve intersects the market supply curve at a quantity of 5.5 and a
(d) The market quantity is 7 units and the socially optimal quantity is 5.5 units; therefore the
4. In the previous problem’s market equilibrium, what is
(a) The market value of the good?
(b) The social value of the good? (LO 04-01)
Answers:
5
© 2016 by McGraw-Hill Education. This is proprietary material solely for authorized instructor use. Not authorized for sale or distribution in any
manner. This document may not be copied, scanned, duplicated, forwarded, distributed, or posted on a website, in whole or part.
Feedback:
(a) The market price (market value) for any product is the price at which quantity demanded
(b) The social demand curve intersects the market supply curve at a quantity of 5 and a price
5. If the average adult produces $20,000 of output per year, how much global output is lost as a
result of adult deaths from secondhand smoke, according to the News on page 75?
(LO 04-01)
Answer: $8,746,000,000.
Feedback: According to the article, each year secondhand smoke causes 379,000 deaths
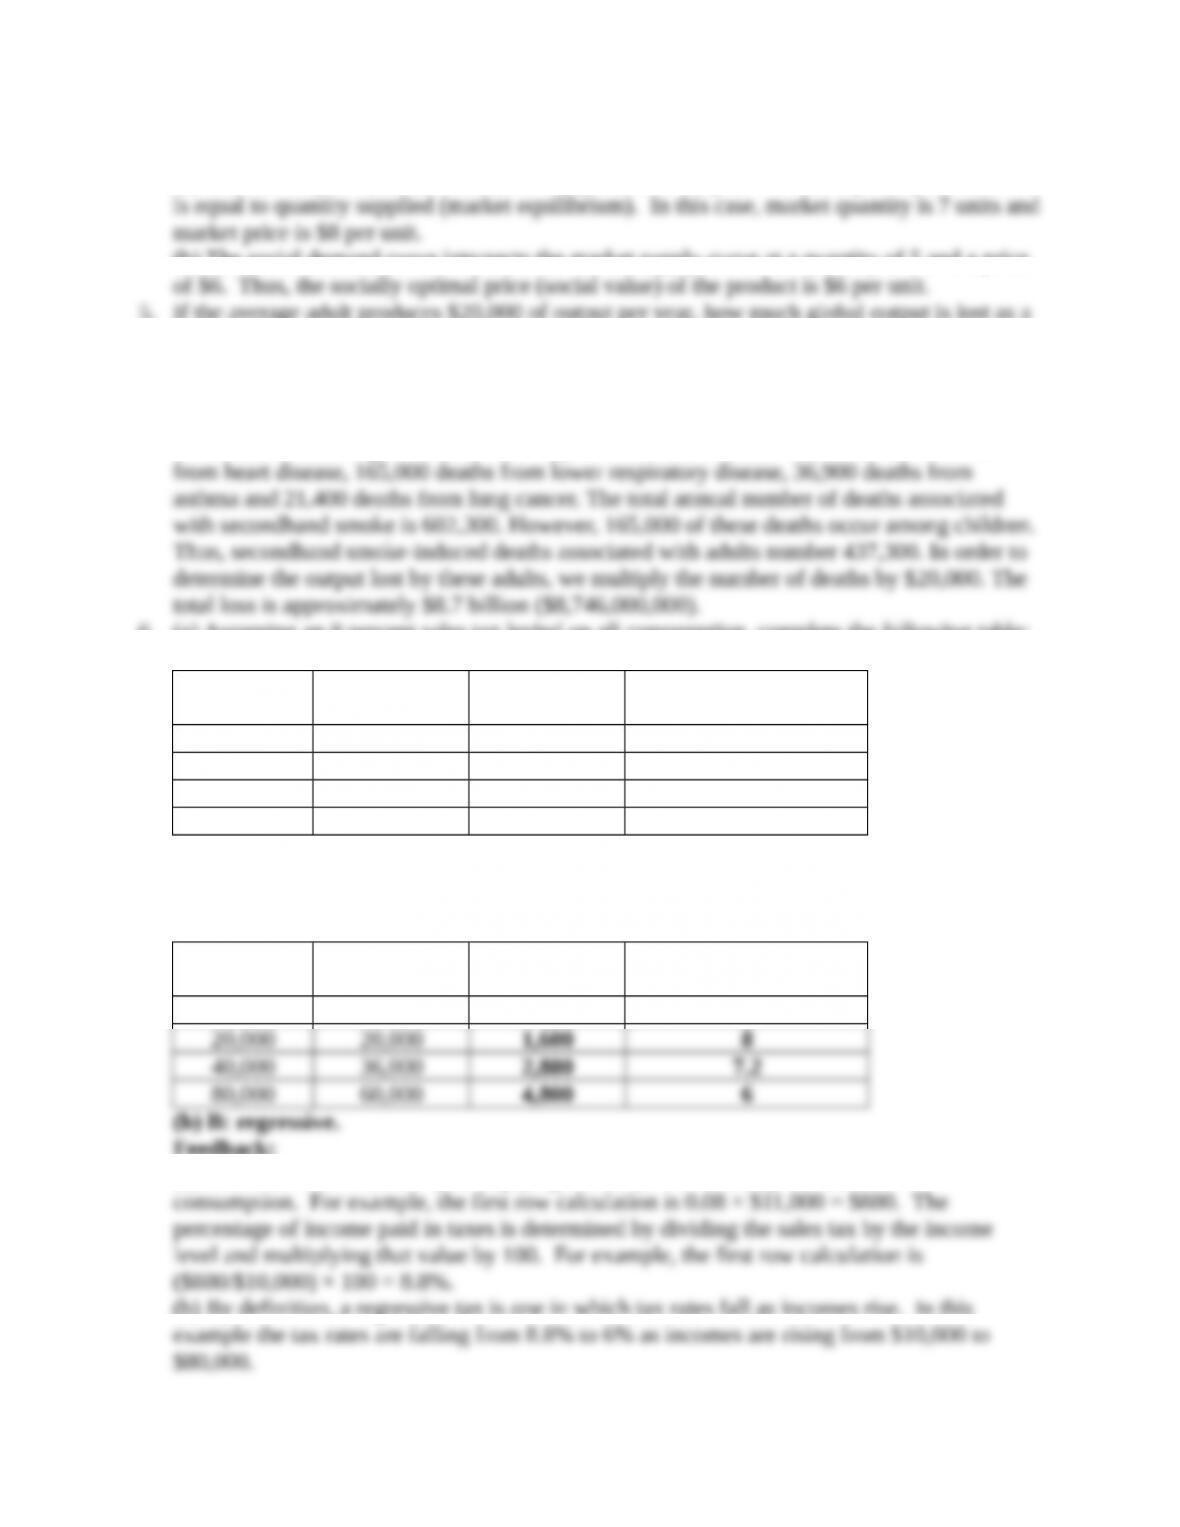
6. (a) Assuming an 8 percent sales tax levied on all consumption, complete the following table:
Income Consumption Sales Tax
Percentage of Income
Paid in Taxes
$10,000 $11,000
20,000 20,000
40,000 36,000
80,000 60,000
(b) Is the sales tax (A) progressive or (B) regressive? (LO 04-03)
Answers:
(a)
Income Consumption Sales Tax
Percentage of Income
Paid in Taxes
$10,000 $11,000 $880 8.8%
Feedback:
(a) Sales tax is determined by multiplying the tax (8% or 0.08) by the amount of
(b) By definition, a regressive tax is one in which tax rates fall as incomes rise. In this
6
© 2016 by McGraw-Hill Education. This is proprietary material solely for authorized instructor use. Not authorized for sale or distribution in any
manner. This document may not be copied, scanned, duplicated, forwarded, distributed, or posted on a website, in whole or part.
7. If a new home can be constructed for $150,000, what is the opportunity cost of federal
defense spending, measured in terms of private housing? (Assume a defense budget of $700
billion.) (LO 04-04)
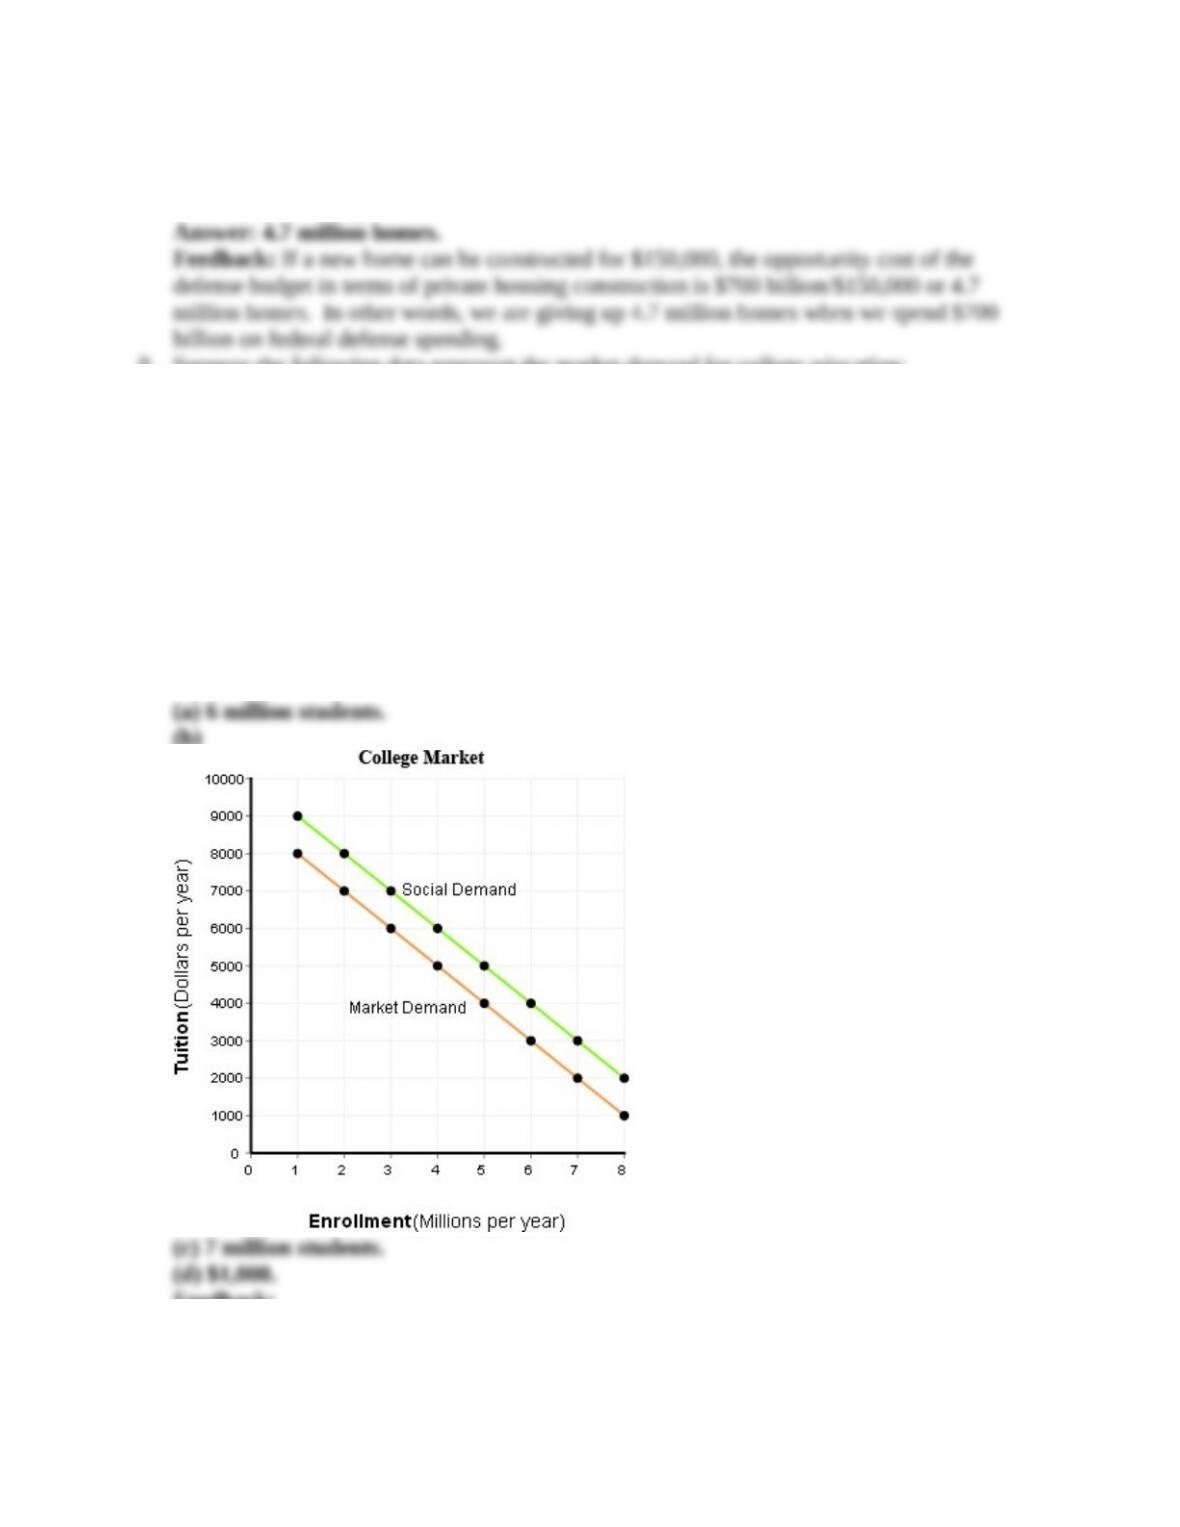
8. Suppose the following data represent the market demand for college education:
Tuition (per year) $1,000 $2,000 $3,000 $4,000 $5,000 $6,000 $7,000 $8,000
Enrollment demanded 8 7 6 5 4 3 2 1
(in millions per year)
(a) If tuition is set at $3,000, how many students will enroll?
Now suppose that society gets an external benefit of $1,000 for every enrolled student.
(b) Draw the social and market demand curves for this situation on the graph below.
(c) What is the socially optimal level of enrollment at the same tuition price of $3,000?
(d) How large of a subsidy is needed to achieve this optimal outcome? (LO 04-01
Answers:
(b)
Feedback:
(a) According to the table provided, the enrollment demanded at a tuition rate of $3,000 is 6
million students.
7
© 2016 by McGraw-Hill Education. This is proprietary material solely for authorized instructor use. Not authorized for sale or distribution in any
manner. This document may not be copied, scanned, duplicated, forwarded, distributed, or posted on a website, in whole or part.
(b) According to the law of demand, quantity demanded decreases as price increases, ceteris
(c) Because society gains an external benefit of $1,000 for each student enrolled, the social
(d) In order to achieve the socially optimal level of enrollment (7 million students enrolled),
9. Assume the market demand for cigarettes is
Price per pack $10 $9 $8 $7 $6 $5 $4 $3
Quantity demanded 2 4 6 8 10 12 14 16
(million packs per year)
(a) If cigarettes are priced at $6 a pack, how many packs will smokers buy?
(b) If secondhand smoke creates $2 of harm per pack, what is the optimal rate of smoking?
(c) How large a tax is needed to achieve this outcome? (LO 04-01)
Answers:
(a) 10 million packs per year.
Feedback:
(a) According to the table provided, at a price of $6 per pack, the quantity demanded for
(b) Social demand is equal to market demand plus/minus any externalities associated with the
(c) In order to achieve the socially optimal rate of smoking determined in (b), the government
10. According to the News on page 82, what percentage of income is spent on lottery tickets by
(a) A poor family with income of $16,000 per year?
(b) An affluent family with income of $35,000 per year? (LO 04-03)
Answers:
Feedback:
(a) According to the article, people who played the lottery with an income of less than
(b) A family with an income ranging between $30,000 and $50,000 spends $24 per month, or
8
© 2016 by McGraw-Hill Education. This is proprietary material solely for authorized instructor use. Not authorized for sale or distribution in any
manner. This document may not be copied, scanned, duplicated, forwarded, distributed, or posted on a website, in whole or part.
11. (a) Between 2000 and 2013, by what percentage did federal spending increase in
(i) in nominal terms?
(ii) in real (inflation-adjusted terms)?
(b) What percentage of nominal total output (GDP) came from federal purchases in
(i) 2000?
(ii) 2013?
(use tables on pp. T-1 – T-4 or www.bea.gov for data) (LO 04-02)
Answers:
Feedback:
(a) (i) In nominal terms, federal spending increased from $578 billion in 2000 to $2,548
This is an increase of 340.8%, or more specifically ($2,548 – $578)/$578 × 100 = 340.8%.
(a) (ii) In real terms, federal spending increased from $698.1 billion in 2000 to $2,099 billion
(b) (i) In 2000 nominal total federal spending was $578 billion, 5.9% ($578/$9,817) of the
(b) (ii) In 2013 nominal total federal spending was $2,548 billion, 14.9% ($2,548/$17,080) of
9
© 2016 by McGraw-Hill Education. This is proprietary material solely for authorized instructor use. Not authorized for sale or distribution in any
manner. This document may not be copied, scanned, duplicated, forwarded, distributed, or posted on a website, in whole or part.