Chapter 3: Supply and Demand
Solutions Manual
Learning Objectives for Chapter
After reading this chapter, you should know
LO 03-01. The nature and determinants of market demand.
LO 03-02. The nature and determinants of market supply.
LO 03-03. How market prices and quantities are established.
LO 03-04. What causes market prices to change.
LO 03-05. How government price controls affect market outcomes.
Questions for Discussion
1. In our story of Tom, the student confronted with a web design assignment, we emphasized
the great urgency of his desire for web tutoring. Many people would say that Tom had an
“absolute need” for web help and therefore was ready to “pay anything” to get it. If this were
true, what shape would his demand curve have? Why isn’t this realistic? (LO 03-01)
2. How did Samsung’s unveiling of the Galaxy S5 affect the demand for the S4 (News, p. 51)?
What determinant(s) of demand changed? How did Walmart’s price cut compensate?
(LO 03-01)
3. With respect to the demand for college enrollment, which of the following would cause (1) a
movement along the demand curve or (2) a shift of the demand curve? (LO 03-04)
a. An increase in incomes.
b. Lower tuition.
c. More student loans.
d. An increase in textbook prices.
Answer:
a. College enrollment is considered to be a normal good—more specifically, a good for
b. Tuition is the price of a college education. As tuition decreases, the price of a college
1
© 2016 by McGraw-Hill Education. This is proprietary material solely for authorized instructor use. Not authorized for sale or distribution in any
manner. This document may not be copied, scanned, duplicated, forwarded, distributed, or posted on a website, in whole or part.
c. When more student loans become available, more people can afford to purchase a college
d. Textbooks are considered to be a complement in consumption for a college education. In
4. What would have happened to shrimp prices and consumption if the government had
prohibited price increases after the BP oil spill (see News, p. 58)? (LO 03-05)
5. Why are scalpers able to resell tickets to the NCAA finals at such high prices (News, p. 61)?
(LO 03-02)
6. In Figure 3.8, why is the organ demand curve downward-sloping rather than vertical?
(LO 03-01)
2
© 2016 by McGraw-Hill Education. This is proprietary material solely for authorized instructor use. Not authorized for sale or distribution in any
manner. This document may not be copied, scanned, duplicated, forwarded, distributed, or posted on a website, in whole or part.
7. The shortage in the organ market (Figure 3.8) requires a nonmarket rationing scheme. Who
should get the available (qa) organs? Is this fairer than the market-driven distribution?
(LO 03-05)
8. What would happen in the apple market if the government set a minimum price of $5.00 per
apple? What might motivate such a policy? (LO 03-05)
9. The World View on page 63 explains why oil prices rose after the attack on Malaysia
Airlines. What caused prices to rise and what will bring prices down? (LO 03-04)
10. Is there a shortage of on-campus parking at your school? How might the shortage be
resolved? (LO 03-03)
3
© 2016 by McGraw-Hill Education. This is proprietary material solely for authorized instructor use. Not authorized for sale or distribution in any
manner. This document may not be copied, scanned, duplicated, forwarded, distributed, or posted on a website, in whole or part.
Problems
1. According to Figure 3.3, at what price would Tom buy 12 hours of web tutoring?
(a) Without a lottery win.
(b) With a lottery win. (LO 03-01)
Answers:
Feedback:
(a) According to Figure 3.3, the “initial demand” curve (D1) is Tom’s demand for web
(b) If Tom’s income increased due to a lottery win, his new demand curve would be
2. According to Figures 3.5 and 3.6, what would the new equilibrium price of tutoring services
be if Carlos decided to stop tutoring? (LO 03-03)
Feedback: According to Figure 3.6, when Carlos was in the market, the equilibrium price
was $20, where quantity supplied equals quantity demanded at 39 hours per semester. If
3. According to the News on page 61
(a) What was the initial price of a ticket to the NCAA finals?
(b) At that price was there (A) an equilibrium, (B) a shortage, or (C) a surplus? (LO 03-03)
Answers:
Feedback:
4
© 2016 by McGraw-Hill Education. This is proprietary material solely for authorized instructor use. Not authorized for sale or distribution in any
manner. This document may not be copied, scanned, duplicated, forwarded, distributed, or posted on a website, in whole or part.
(a) According to the News article “The Real March Madness: Ticket Prices,” when a price of
(b) This scenario, in which not all consumer demands can be satisfied at the market price, is
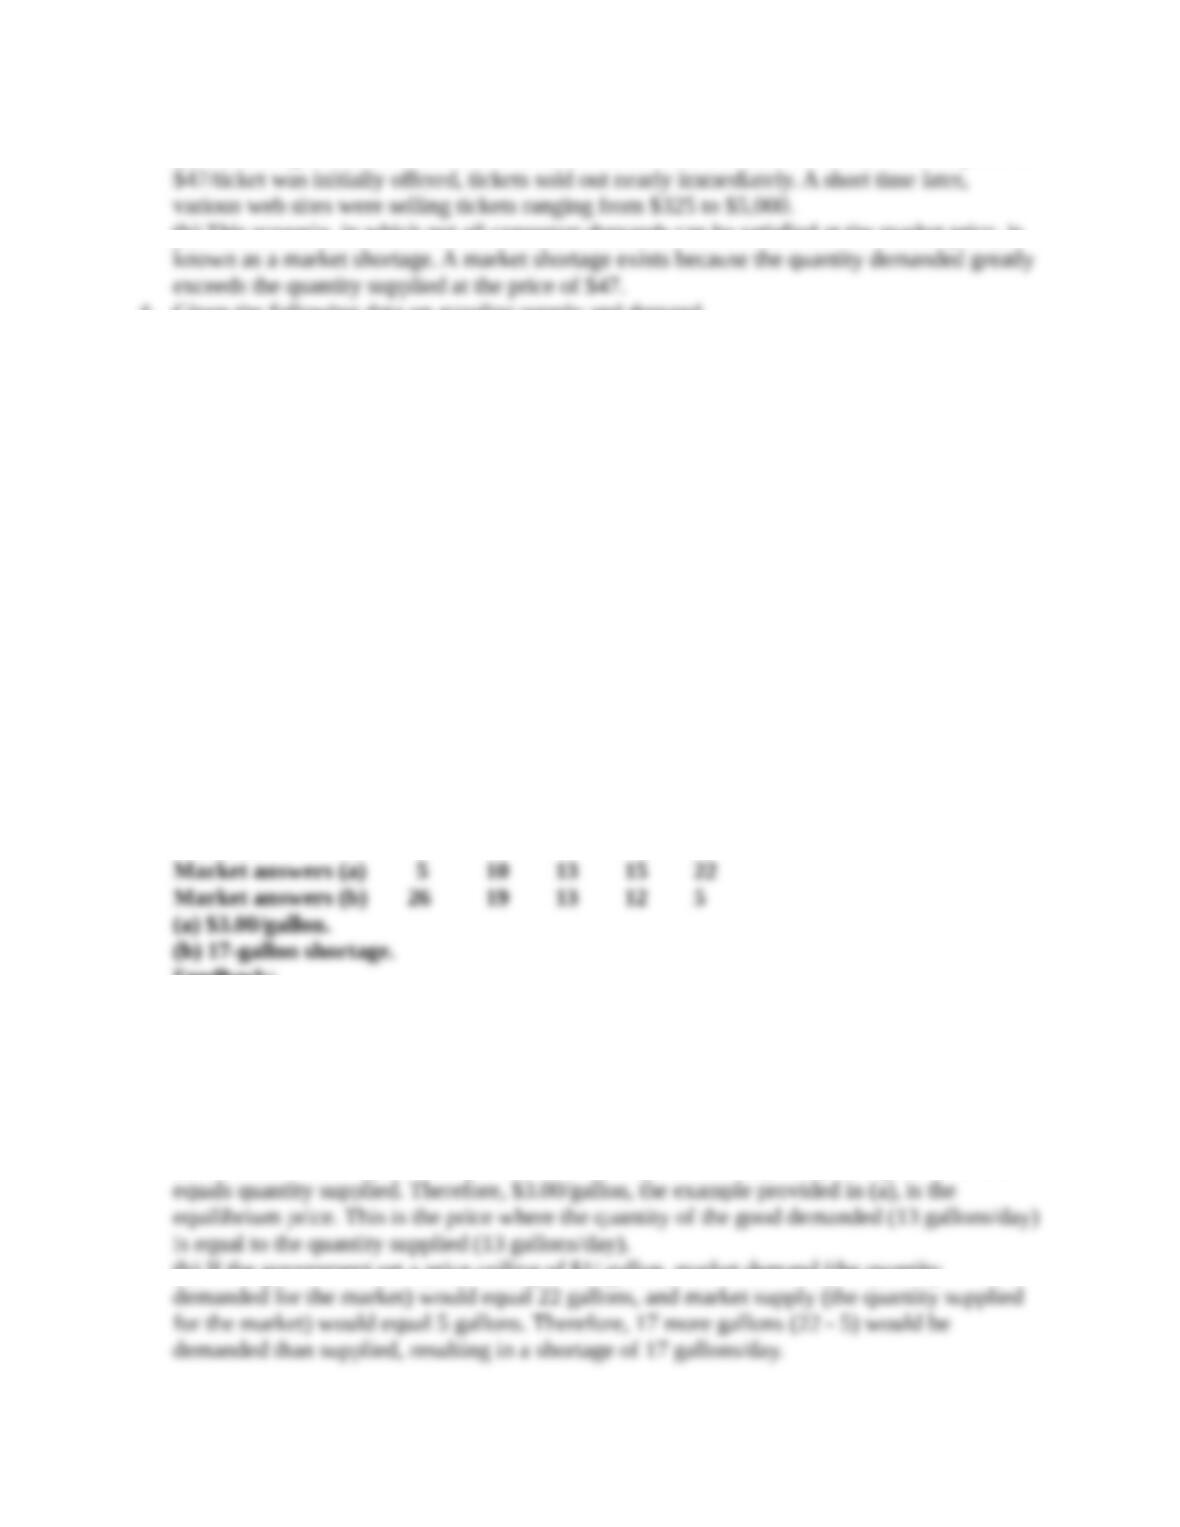
4. Given the following data on gasoline supply and demand,
(a) What is the equilibrium price?
(b) How large of a market shortage would exist if the government set a price ceiling of $1 per
gallon? (LO 03-03)
Price per gallon $5.00 $4.00 $3.00 $2.00 $1.00
Quantity demanded (gallons per day)
Al 12345
Betsy 0 1 1 1 2
Casey 2 2 3 3 4
Daisy 1 3 4 4 6
Eddie 1 2 2 3 5
Market total _ _ _ _ _
Price per gallon $5.00 $4.00 $3.00 $2.00 $1.00
Quantity supplied (gallons per day)
Firm A 3 3 2 2 1
Firm B 7 5 3 3 2
Firm C 6 4 3 3 1
Firm D 6 5 3 2 0
Firm E 4 2 2 2 1
Market total _ _ _ _ _
Answers:
Feedback:
To determine the market demand for gasoline at a particular price, we simply need to add the
quantity demanded for each of the individual market participants at that price. For example,
at a price of $3.00/gallon, we add Al’s, Betsy’s, Casey’s, Daisy’s, and Eddie’s quantities
demanded of gasoline (3 + 1 + 3 + 4 + 2), and we get a market demand of 13 gallons/day. At
a price of $3.00/gallon, we add Firms A, B, C, D, and E (2 + 3 + 3 + 3 + 2), and we get a
market supply of 13 gallons/day. We do the same thing for market supply.
(a) Remember that equilibrium price is the market price where quantity of a good demanded
(b) If the government set a price ceiling of $1/ gallon, market demand (the quantity
5
© 2016 by McGraw-Hill Education. This is proprietary material solely for authorized instructor use. Not authorized for sale or distribution in any
manner. This document may not be copied, scanned, duplicated, forwarded, distributed, or posted on a website, in whole or part.
5. As a result of the BP oil spill (News, p. 58), which of the following changed in the shrimp
market (answer yes or no):
(a) Demand?
(b) Supply?
(c) Price? (LO 03-02
Answers:
Feedback:
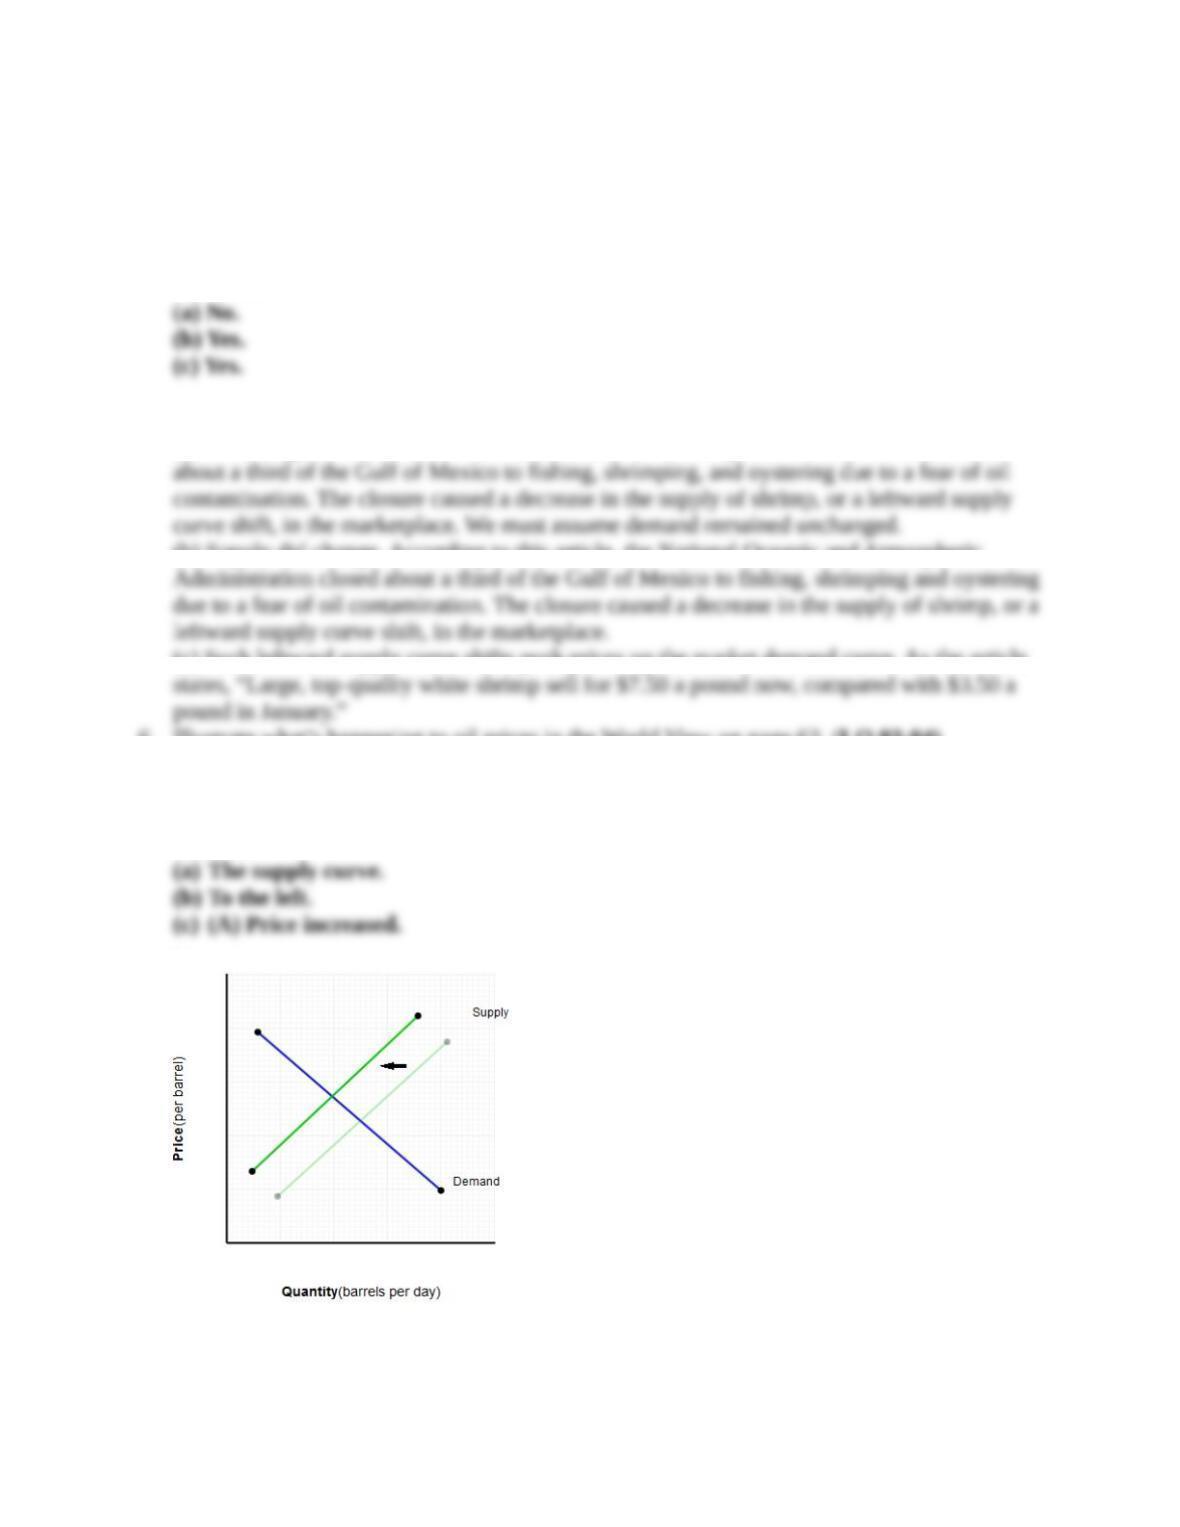
(a) According to the News, the National Oceanic and Atmospheric Administration closed
(b) Supply did change. According to this article, the National Oceanic and Atmospheric
(c) Such leftward supply curve shifts push prices up the market demand curve. As the article
6. Illustrate what’s happening to oil prices in the World View on page 63. (LO 03-04)
(a) Which curve shifted?
(b) Which direction did that curve shift (left or right)?
(c) Did price (A) increase or (B) decrease?
Answer:
..
..
Feedback: According to the World View, oil prices rose due to an expectation of a future
decrease in supply. Supply is expected to be restricted due to the likely U.S. sanctions on
6
© 2016 by McGraw-Hill Education. This is proprietary material solely for authorized instructor use. Not authorized for sale or distribution in any
manner. This document may not be copied, scanned, duplicated, forwarded, distributed, or posted on a website, in whole or part.
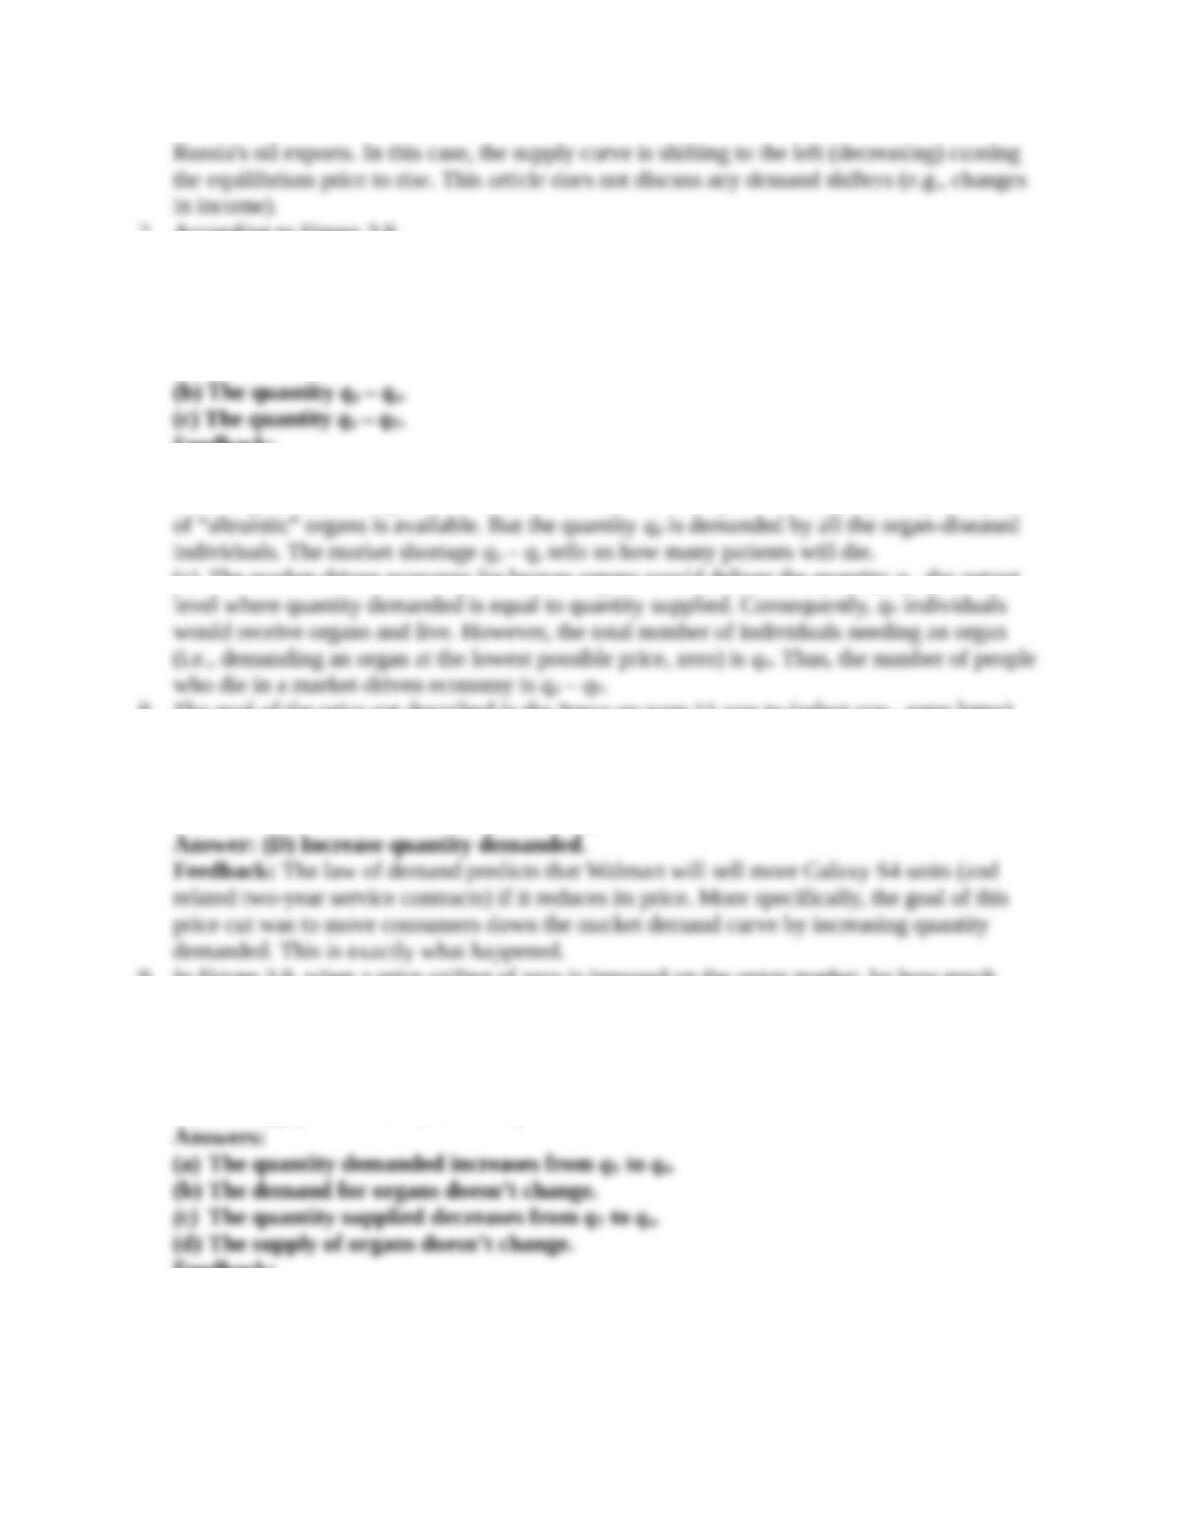
7. According to Figure 3.8,
(a) How many organs are supplied at zero price?
(b) How many people die in the government-regulated economy?
(c) How many people die in the market driven economy? (LO 03-05)
Answers:
(a) qa
Feedback:
(a) At a price of zero, the quantity supplied is at qa.
(b) In a government-regulated economy with a price ceiling set at zero, only the quantity qa
(c) The market-driven economy for human organs would deliver the quantity qE, the output
8. The goal of the price cut described in the News on page 51 was to (select one– enter letter)
(A) Increase supply.
(B) Increase quantity supplied.
(C) Increase demand.
(D) Increase quantity demanded. (LO 03-01)
9. In Figure 3.8, when a price ceiling of zero is imposed on the organ market, by how much
does
(a) The quantity of organs demanded increase?
(b) The demand increase?
(c) The quantity of organs supplied decrease?
(d) The supply decrease? (LO 03-05)
Feedback:
(a) Figure 3.8 shows that qE people would get transplants in a market-driven system. When a
price ceiling of zero is imposed on the organ market through government regulation, more
individuals would want organ donations at this lower price (of zero!). Therefore, with the
7
© 2016 by McGraw-Hill Education. This is proprietary material solely for authorized instructor use. Not authorized for sale or distribution in any
manner. This document may not be copied, scanned, duplicated, forwarded, distributed, or posted on a website, in whole or part.
(b) The imposition of a price ceiling of zero does not change the demand for organs. Price
(c) Figure 3.8 shows that qE people would get transplants in a market-driven system. When a
(d) The imposition of a price ceiling of zero does not change the supply of organs. Price
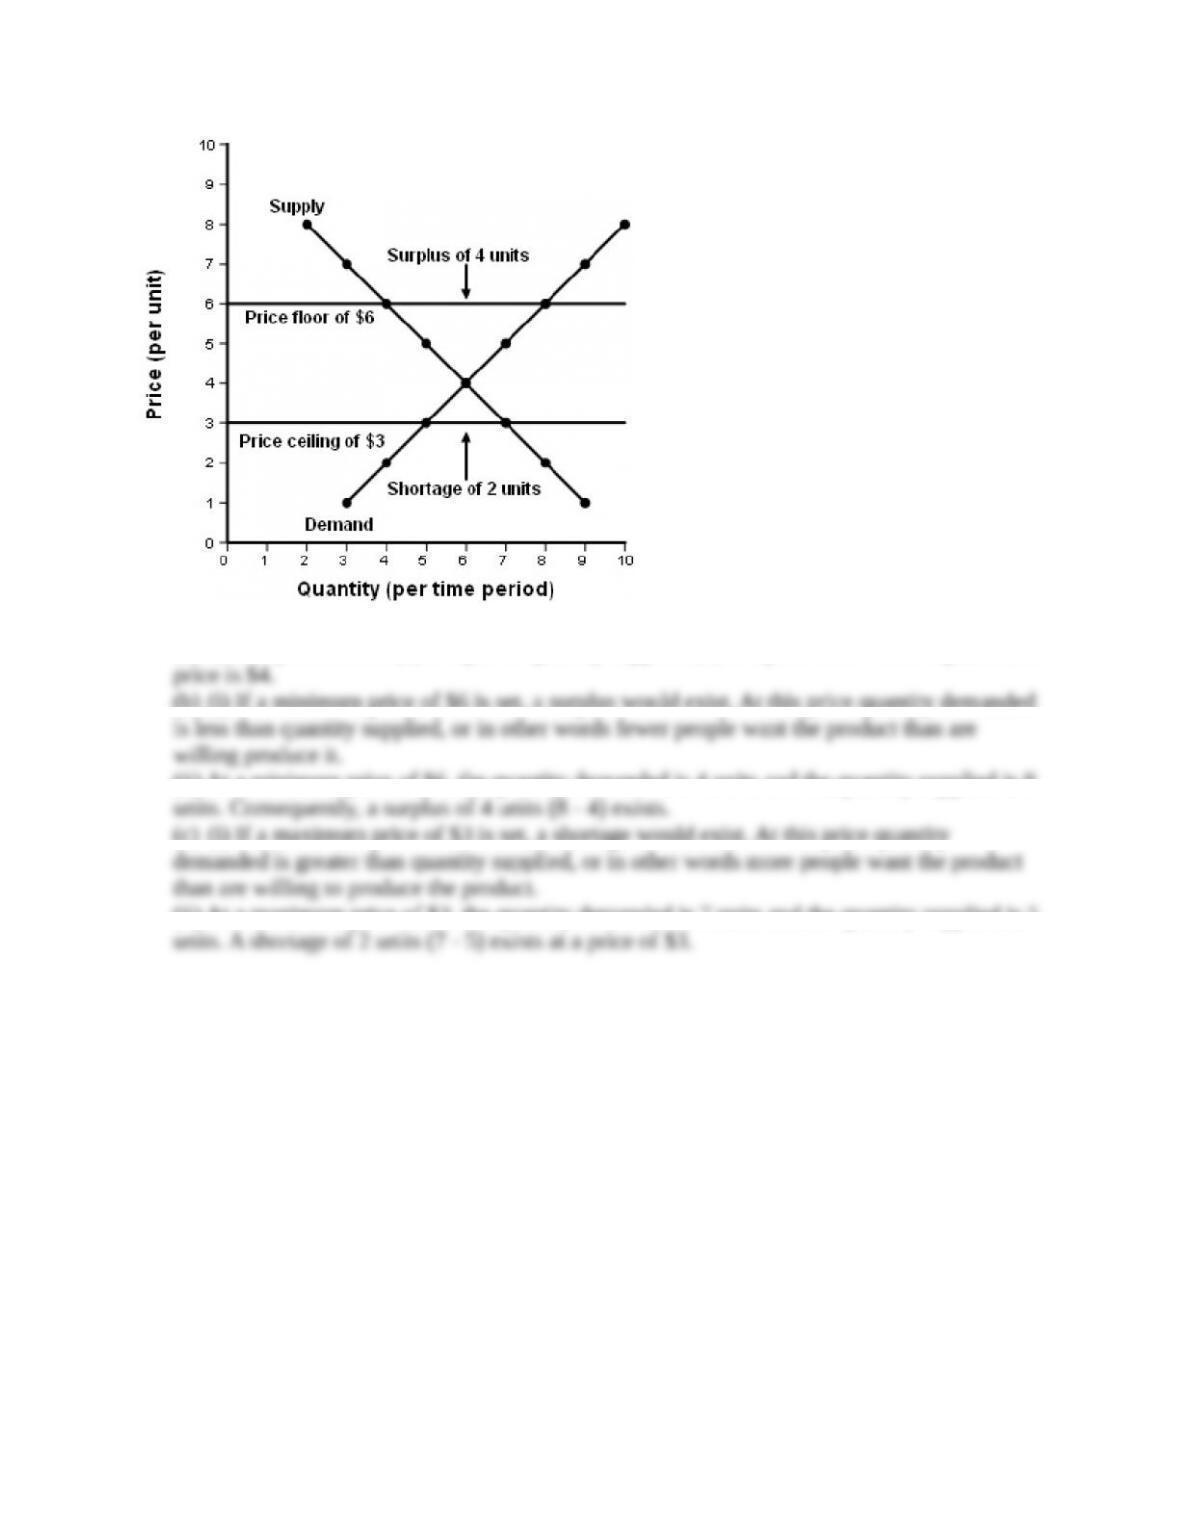
10. Use the following data to draw supply and demand curves on the accompanying graph.
Price $8 7 6 5 4 3 2 1
Quantity demanded 2 3 4 5 6 7 8 9
Quantity supplied 10 9 8 7 6 5 4 3
(a) What is the equilibrium price?
(b) If a minimum price (price floor) of $6 is set,
(i) What kind of disequilibrium situation results?
(ii) How large is it?
(c) If a maximum price (price ceiling) of $3 is set,
(i) What kind of disequilibrium situation results?
(ii) How large is it?
Illustrate these answers. (LO 03-05
Answers:
(a) $4.
8
© 2016 by McGraw-Hill Education. This is proprietary material solely for authorized instructor use. Not authorized for sale or distribution in any
manner. This document may not be copied, scanned, duplicated, forwarded, distributed, or posted on a website, in whole or part.
…
Feedback:
(a) Quantity demanded (6) is equal to quantity supplied (6) at a price of $4. Thus equilibrium
(b) (i) If a minimum price of $6 is set, a surplus would exist. At this price quantity demanded
(ii) At a minimum price of $6, the quantity demanded is 4 units and the quantity supplied is 8
(c) (i) If a maximum price of $3 is set, a shortage would exist. At this price quantity
(ii) At a maximum price of $3, the quantity demanded is 7 units and the quantity supplied is 5
9
© 2016 by McGraw-Hill Education. This is proprietary material solely for authorized instructor use. Not authorized for sale or distribution in any
manner. This document may not be copied, scanned, duplicated, forwarded, distributed, or posted on a website, in whole or part.