Chapter 2: The U.S. Economy: A Global View
Solutions Manual
Learning Objectives for Chapter 2
After reading this chapter, you should know
LO 02-01. The relative size of the U.S. economy.
LO 02-02. How the U.S. output mix has changed over time.
LO 02-03. How the U.S. is able to produce so much output.
LO 02-04. How incomes are distributed in the United States and elsewhere.
Questions for Discussion
1. Americans already enjoy living standards that far exceed world averages. Do we have
enough? Should we even try to produce more? (LO 02-01)
Answer: As long as people want more than they have, scarcity exists. If we are interested in
increasing our standard of living, then we should consider producing more. Of course, one of
2. Why is per capita GDP so much higher in the United States than in Mexico? (LO 02-03)
3. Can we continue to produce more output every year? Is there a limit? (LO 02-03)
4. The U.S. farm population has shrunk by over 25 million people since 1900. Where did all the
people go? Why did they move? (LO 02-02)
1
© 2016 by McGraw-Hill Education. This is proprietary material solely for authorized instructor use. Not authorized for sale or distribution in any
manner. This document may not be copied, scanned, duplicated, forwarded, distributed, or posted on a website, in whole or part.
5. Is the relative decline in U.S. farming and manufacturing (Figure 2.2) a good thing or a bad
thing? (LO 02-02)
6. How many people are employed by your local or state government? What do they produce?
What is the opportunity cost of that output? (LO 02-01)
7. Where do growing companies like Google and Facebook get their employees? What were
those workers doing before? (LO 02-02)
8. Should the government try to equalize incomes more by raising taxes on the rich and giving
more money to the poor? How might such redistribution affect total output and growth?
(LO 02-04)
9. Why are incomes so much more unequal in poor nations than in rich ones? (LO 02-04)
2
© 2016 by McGraw-Hill Education. This is proprietary material solely for authorized instructor use. Not authorized for sale or distribution in any
manner. This document may not be copied, scanned, duplicated, forwarded, distributed, or posted on a website, in whole or part.
10. How might free markets help reduce global poverty? How might they impede that goal?
(LO 02-03)
Problems
1. In 2013 the world’s total output (real GDP) was roughly $73 trillion. What percent of this
total was produced
(a) By the three largest economies (World View, p. 31)?
(b) By the three smallest economies in that World View?
(c) How much larger is the U.S. economy than the Ethiopian economy? (LO 02-01)
Answers:
(a) 42.33%.
Feedback:
(a) In 2013 the U.S. produced $16.8 trillion, China produced $9.2 trillion and Japan produced
(b) In contrast, the smallest three economies, Haiti ($0.01 trillion), Ethiopia ($0.05 trillion)
(c) The size of the U.S. GDP is 336 (16.8 / 0.05) times larger than Ethiopia’s. This is partially
2. According to the World View on page 32, how does per capita GDP in the following
countries stack up against America’s (in percentage terms):
(a) Russia?
(b) China?
(c) Cuba? (LO 02-01)
Answers:
(a) 25.82%.
Feedback: Per capita GDP is an indicator of how much output the average person would get
if all output were divided up evenly among the population. Note, however, that even the per
(a) Russia’s GDP per capita is $13,860, while the U.S. GDP per capita is $53,670, so
3
© 2016 by McGraw-Hill Education. This is proprietary material solely for authorized instructor use. Not authorized for sale or distribution in any
manner. This document may not be copied, scanned, duplicated, forwarded, distributed, or posted on a website, in whole or part.
3. In 1950, America’s GDP per capita was approximately $15,000 (in today’s dollars). How
much higher in percentage terms is
(a) America’s GDP per capita in 2013 compared to its GDP in 1950?
(b) America’s 1950 GDP per capita compared to
(i) Cuba’s in 2013?
(ii) China’s in 2013? (LO 02-04)
Answers:
(a) 358%.
Feedback:
(a) America’s GDP per capita in 2013 is 358% ([53,670 / 15,000] × 100) of America’s GDP
4. (a) How much more output does the $18 trillion U.S. economy produce when GDP increases
by 1.0 percent?
(b) By how much does this increase the average (per capita) income if the population is 320
million? (LO 02-03
Answers:
5. According to Table 2.1 (p. 34), how fast does total output (GDP) have to grow in order to
raise per capita GDP in
(a) China?
(b) Ethiopia? (LO 02-01)
Answers:
Feedback:
4
© 2016 by McGraw-Hill Education. This is proprietary material solely for authorized instructor use. Not authorized for sale or distribution in any
manner. This document may not be copied, scanned, duplicated, forwarded, distributed, or posted on a website, in whole or part.
Per capita GDP is calculated as a nation’s total output divided by its total population. In all
nations, GDP must grow by more than the growth rate of the population in order for per
6. (a) If Haiti’s per capita GDP of roughly $810 were to DOUBLE every decade, what would
Haiti’s per capita GDP be in 50 years?
(b) What is U.S. per capita GDP in 2013 (World View, p. 32)? (LO 02-03)
Answers:
Feedback:
(a) If Haiti’s per capita GDP of roughly $810 were to double every decade for 50 years, it
7. U.S. real gross domestic product increased from $10 trillion in 2000 to $15 trillion in 2010.
During that same decade the share of manufactured goods (e.g., cars, appliances) fell from 16
percent to 12 percent. What was the dollar value of manufactured output
(a) In 2000?
(b) In 2010?
(c) By how much did manufacturing output change? (LO 02-02)
Answers:
(a) $1.6 trillion.
Feedback:
(a) $10 trillion × 16% = $1.6 trillion of manufactured output.
8. Using the data in Figure 2.3,
(a) Compute the average income of U.S. households.
5
© 2016 by McGraw-Hill Education. This is proprietary material solely for authorized instructor use. Not authorized for sale or distribution in any
manner. This document may not be copied, scanned, duplicated, forwarded, distributed, or posted on a website, in whole or part.
(b) If all incomes were equalized by government taxes and transfer payments, how much
would the average household in each income quintile gain (via transfers) or lose (via taxes)?
i. Highest fifth.
ii. Second fifth.
iii. Third fifth.
iv. Fourth fifth.
v. Lowest fifth.
(c) What is the implied tax rate (i.e., tax ÷ average income) on the highest quintile?
(LO 02-04)
Answers:
(a) $72,800.
(b) i. – $112,200.
Feedback:
(a) Sum of the average income for each income quintile divided by the total of five quintiles:
(b) i. The highest quintile (the highest fifth) would lose $112,200 ($72,800 – $185,000 =
(c) The implied tax rate is the tax divided by the average income within the quintile. For the
9. If 150 million workers produced America’s GDP in 2013 (World View, p. 31), how much
output did the average worker produce? (LO 02-03)
Feedback: According to the World View, the United States produced $16.8 trillion in output
10. How much more output (income) per year will have to be produced in the world just to
provide the 2.7 billion “severely” poor population with $1 more output per day? (LO 02-04)
6
© 2016 by McGraw-Hill Education. This is proprietary material solely for authorized instructor use. Not authorized for sale or distribution in any
manner. This document may not be copied, scanned, duplicated, forwarded, distributed, or posted on a website, in whole or part.
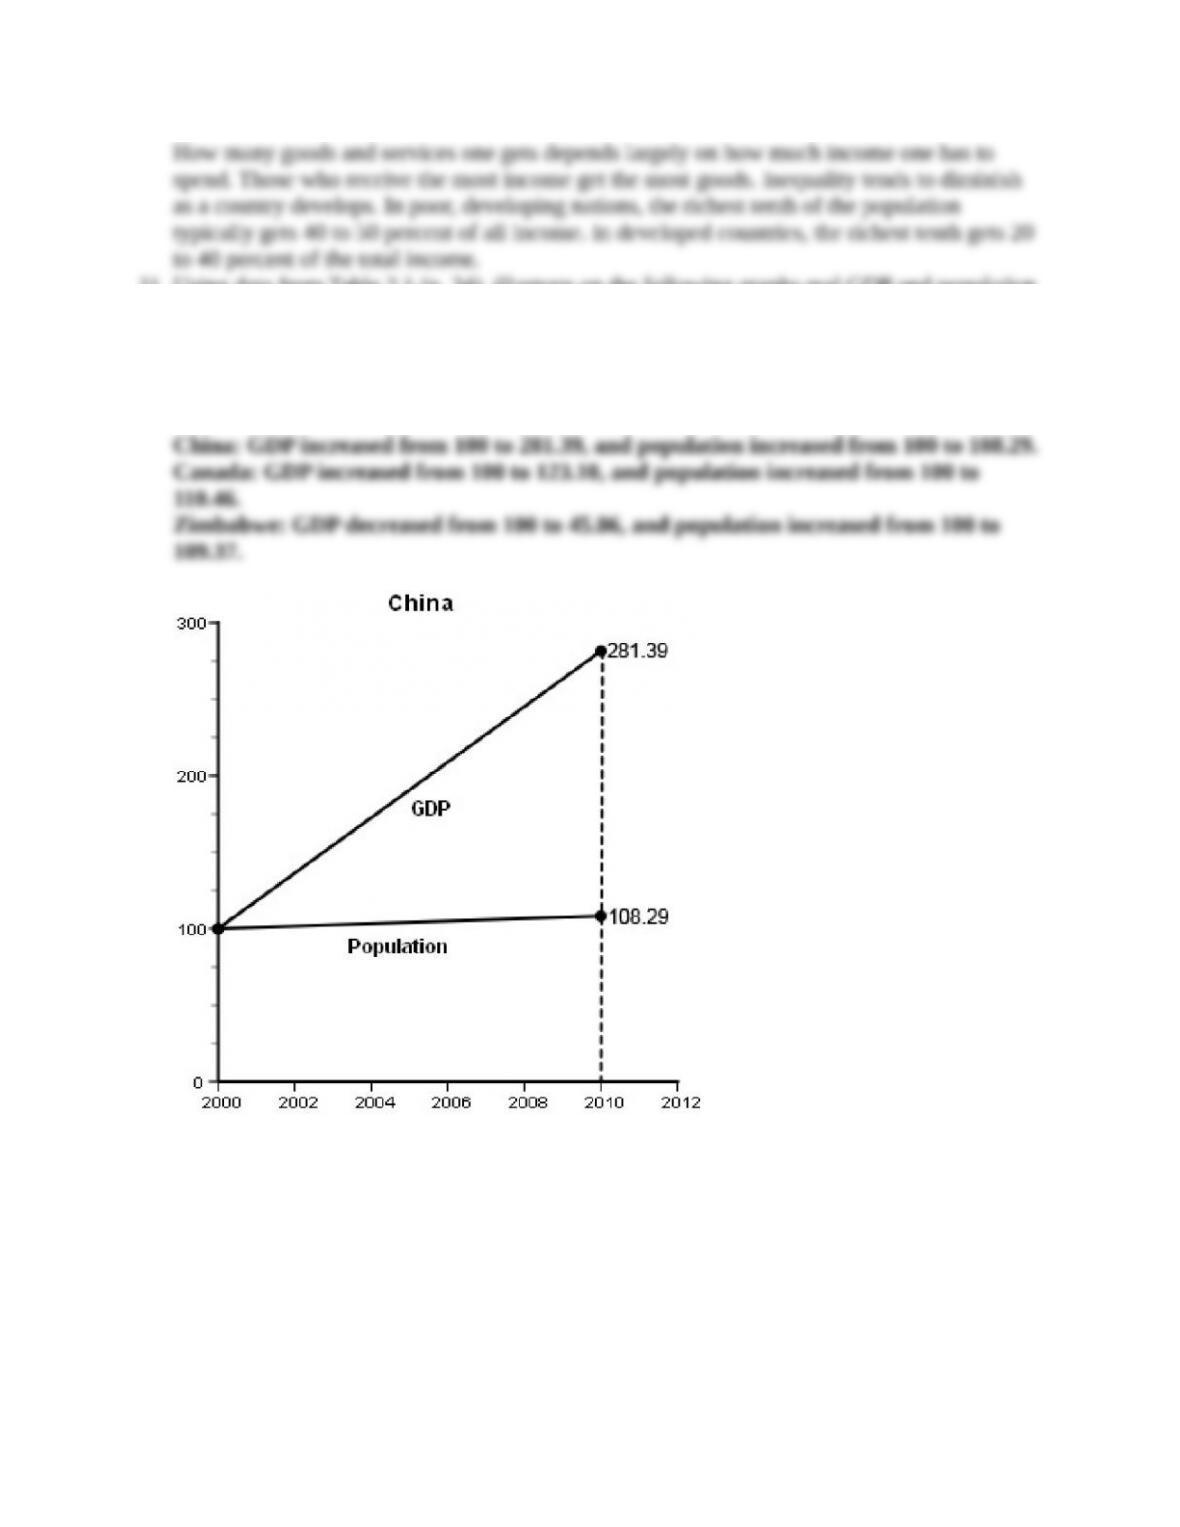
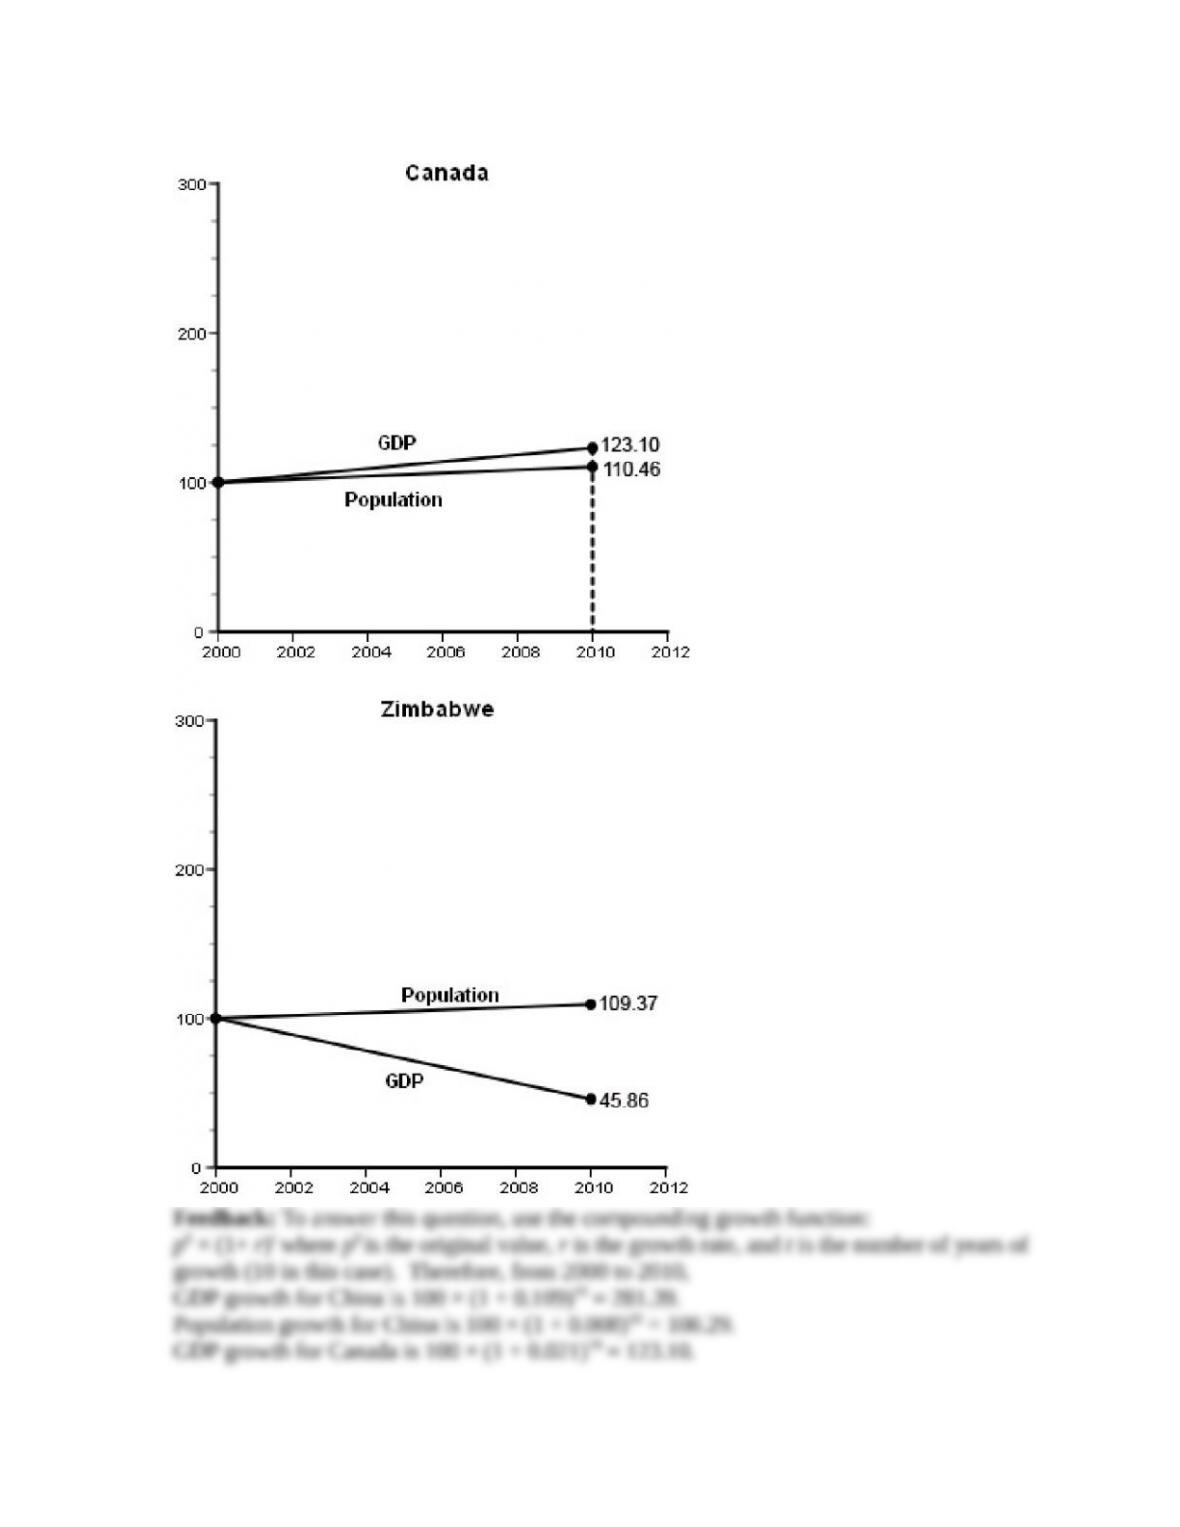
11. Using data from Table 2.1 (p. 34), illustrate on the following graphs real GDP and population
growth since 2000 (in the manner of Figure 2.1) for the nations indicated. (LO 02-01)
Answer:
The following graphs show the various growth rates for China, Canada, and Zimbabwe
from 2000 to 2010.
7
© 2016 by McGraw-Hill Education. This is proprietary material solely for authorized instructor use. Not authorized for sale or distribution in any
manner. This document may not be copied, scanned, duplicated, forwarded, distributed, or posted on a website, in whole or part.
….
…..
…
8
© 2016 by McGraw-Hill Education. This is proprietary material solely for authorized instructor use. Not authorized for sale or distribution in any
manner. This document may not be copied, scanned, duplicated, forwarded, distributed, or posted on a website, in whole or part.
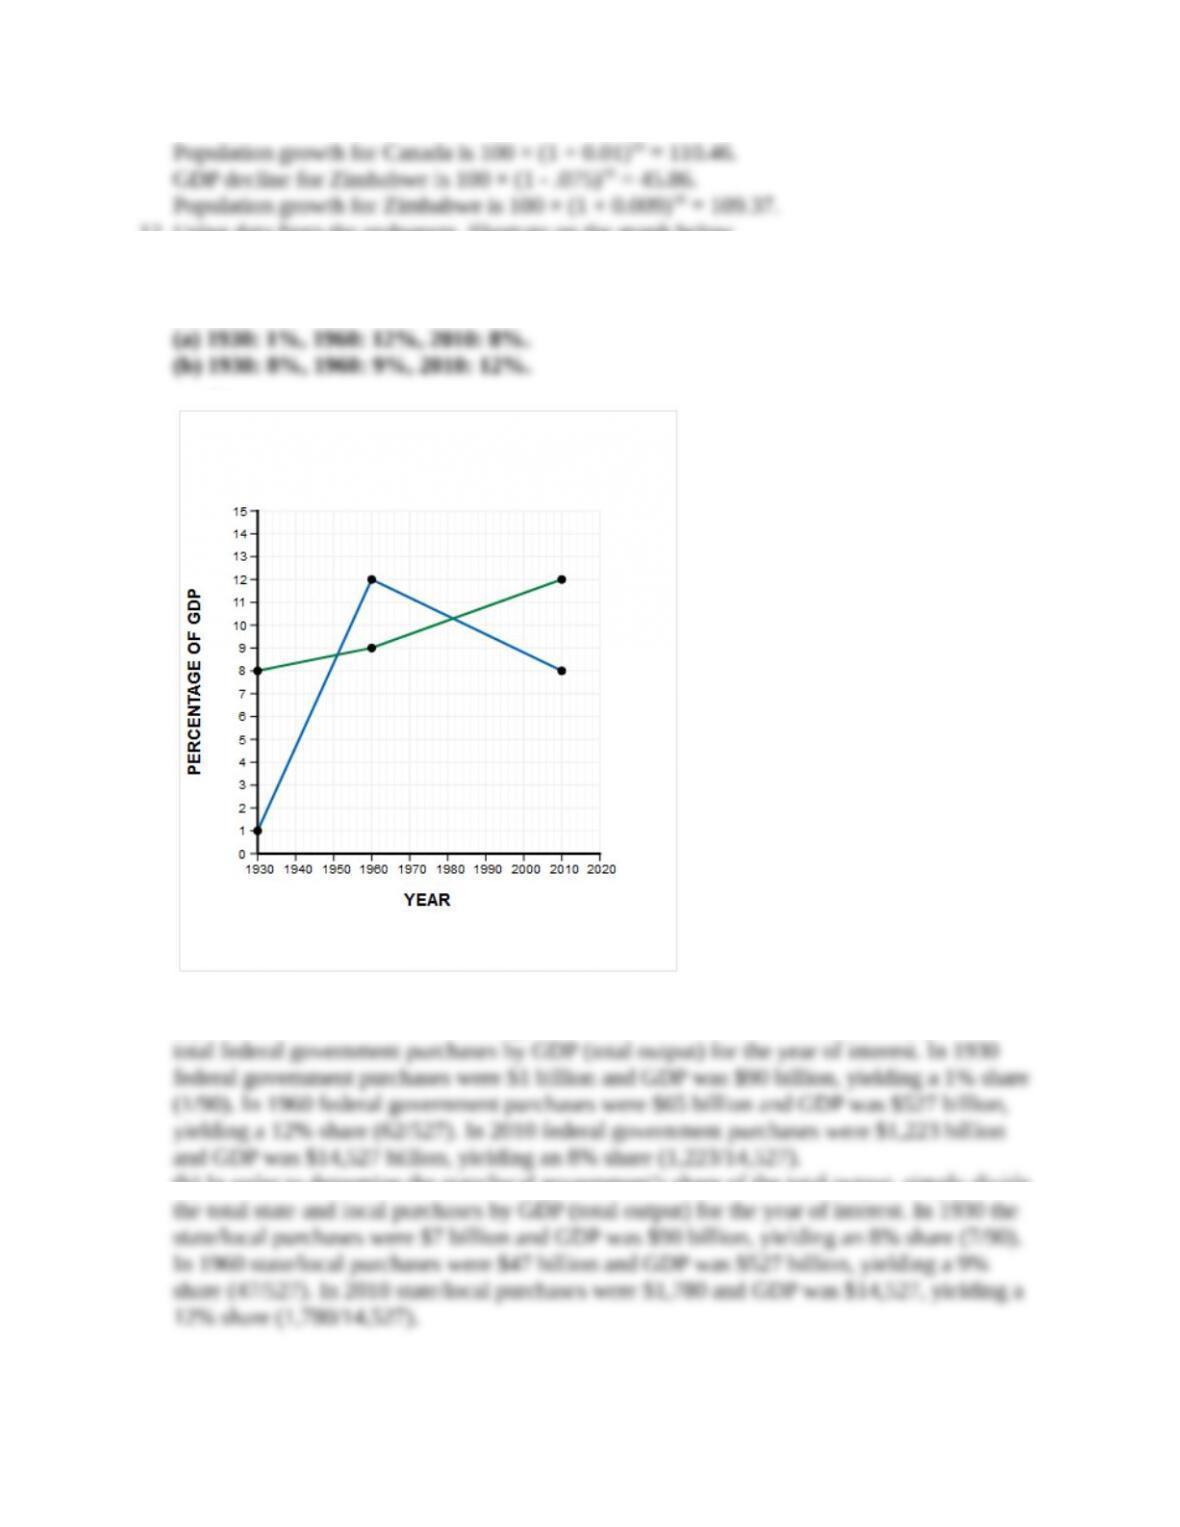
12. Using data from the endpapers, illustrate on the graph below
(a) The federal government’s share of the total output.
(b) The state/local government’s share of total output. (LO 02-01
Answers:
…
…
Feedback:
(a) In order to determine the federal government’s share of the total output, simply divide the
(b) In order to determine the state/local government’s share of the total output, simply divide
9
© 2016 by McGraw-Hill Education. This is proprietary material solely for authorized instructor use. Not authorized for sale or distribution in any
manner. This document may not be copied, scanned, duplicated, forwarded, distributed, or posted on a website, in whole or part.