Chapter 16: The Labor Market
Solutions Manual
Learning Objectives for Chapter 16
After reading this chapter, you should know
LO 16-01. What factors shape labor supply and demand.
LO 16-02. How market wage rates are established.
LO 16-03. How wage floors alter labor market outcomes.
Questions for Discussion
1. Why are you doing this homework? What are you giving up? What utility do you expect to
gain? (LO 16-01)
2. Would you continue to work after winning a lottery prize of $100,000 a year for life? Would
you change schools, jobs, or career objectives? What factors besides income influence work
decisions? (LO 16-01)
3. According to the World View on page 344, does the substitution effect or the income effect
dominate in Mexico? In Russia? Why might this be the case? (LO 16-01)
4. Explain why marginal physical product would diminish as
(a) More waiters are hired in a restaurant.
(b) More professors are hired in the economics department.
(c) More construction workers are hired to build a school. (LO 16-02)
1
© 2016 by McGraw-Hill Education. This is proprietary material solely for authorized instructor use. Not authorized for sale or distribution in any
manner. This document may not be copied, scanned, duplicated, forwarded, distributed, or posted on a website, in whole or part.
5. Is this course increasing your marginal productivity? If so, in what way? (LO 16-02)
6. How might you measure the marginal revenue product of (a) a quarterback and (b) the team’s
coach? (LO 16-02)
7. Who is hurt and who is helped by an increase in the legal minimum wage? Under what
circumstances might a higher minimum not reduce employment? (LO 16-03)
8. In 2007 the president of the University of Southern California was paid $900,000 and the
football coach was paid $4 million. Does this make any sense? (LO 16-02)
2
© 2016 by McGraw-Hill Education. This is proprietary material solely for authorized instructor use. Not authorized for sale or distribution in any
manner. This document may not be copied, scanned, duplicated, forwarded, distributed, or posted on a website, in whole or part.
9. Is it possible that the president of the United States is overpaid? How should his MRP be
measured? (LO 16-02)
10. The minimum wage in Mexico is less than $1 an hour. Does this make Mexican workers
more cost-effective than U.S. workers? Explain. (LO 16-03)
11. Why didn’t President Obama set pay limits on baseball players who play in publicly funded
stadiums? Why did he single out bank executives? (LO 16-02)
3
© 2016 by McGraw-Hill Education. This is proprietary material solely for authorized instructor use. Not authorized for sale or distribution in any
manner. This document may not be copied, scanned, duplicated, forwarded, distributed, or posted on a website, in whole or part.
Problems
1. (a) How many home runs did Giancarlo Stanton score in 2014? (See the News, p. 351).
(b) If his annual salary were based on runs alone, how much would each run be worth?
(LO 16-01)
Feedback:
(a) According to the article, Giancarlo Stanton scored 37 home runs in 2014.
(b) Giancarlo Stanton’s average annual salary will be $25 million (= $325 million / 13 years).
2. By what percentage did
(a) The federal minimum wage increase between July 1997 and July 2009? (See Table 16.2.)
(b1) If using The Micro Economy Today, use the following question: Compensation per hour
(b2) If using The Economy Today, use the following question: Average consumer prices
Answer:
Feedback:
(a) Minimum wages in 1997 and 2009 were $5.15 and $7.25 respectively. Therefore, the
(b1) According to the table, compensation per hour in 1990 was $55.20, and in 2010 it was
(b2) According to the table, average consumer prices increased from an index of 130.7 to
3. According to the News on page 341, what was the situation in the 2014 Atlantic City labor
market? A: Labor surplus B: labor shortage C: equilibrium (LO 16-01)
Feedback:
4
© 2016 by McGraw-Hill Education. This is proprietary material solely for authorized instructor use. Not authorized for sale or distribution in any
manner. This document may not be copied, scanned, duplicated, forwarded, distributed, or posted on a website, in whole or part.
The market supply of labor consists of individuals willing to sell their time and talents to
anyone who is willing to pay the right price. When there are more individuals willing to work
4. According to the News on page 341,
(a) How many people were supplying labor?
(b) How many employers were demanding labor? (LO 16-03)
Answer:
Feedback:
(a) According to the article, 1,500 job seekers had come through the Convention Center by 2
5. (a) According to Figure 16.8, how many workers are unemployed at the equilibrium wage?
(b) How many workers are unemployed at the minimum wage? (LO 16-03)
Answer:
Feedback:
(a) Everyone who is willing to work at the equilibrium wage has a job.
(b) Figure 16.8 illustrates the effects of implementing a minimum wage above the
6. Suppose a wage increase from $71 to $19 an hour increases the number of job applicants
from 42 to 56. What is the price elasticity of labor supply? (LO 16-01)
Feedback:
5
© 2016 by McGraw-Hill Education. This is proprietary material solely for authorized instructor use. Not authorized for sale or distribution in any
manner. This document may not be copied, scanned, duplicated, forwarded, distributed, or posted on a website, in whole or part.
7. If the price of strawberries doubled, how many pickers would be hired at $4 an hour,
according to Table 16.1? (LO 16-01)
Feedback:
According to the information available in Table 16.1, when the price of strawberries is $2 per
8. Apples can be harvested by hand or machine. Handpicking yields 80 pounds per hour;
mechanical pickers yield 120 pounds per hour.
(a) If the wage rate of human pickers is $8 an hour and the rental on a mechanical picker is
$15 an hour, which is more cost-effective?
(b) If the wage rate increased to $12 an hour, which would be more cost-effective?
(LO 16-03)
Answer:
Feedback:
Cost efficiency = Marginal physical product of an input/Cost of an input
(a) Human pickers: Cost efficiency = 80 pounds/$8 = 10 pounds per $1 spent.
(b) When the wage rate increases, the cost for handpicking goes up, and thus cost efficiency
9. Assume that the following data describe labor market conditions:
6
© 2016 by McGraw-Hill Education. This is proprietary material solely for authorized instructor use. Not authorized for sale or distribution in any
manner. This document may not be copied, scanned, duplicated, forwarded, distributed, or posted on a website, in whole or part.
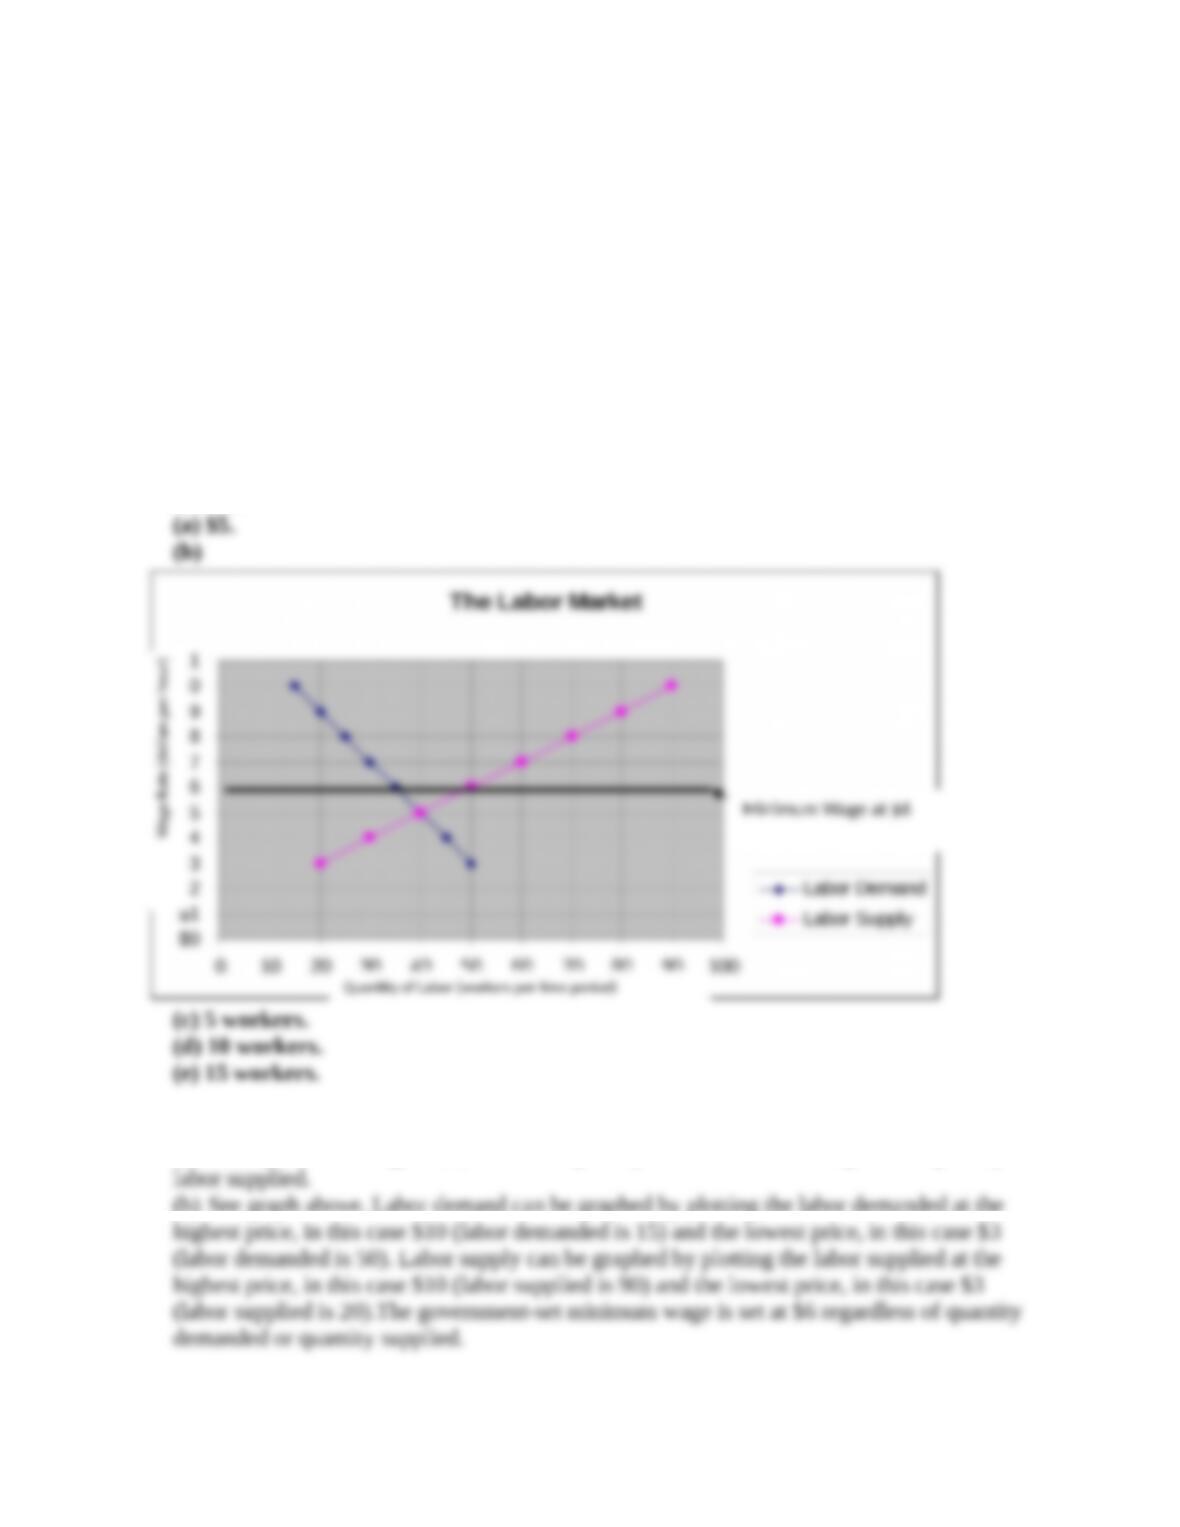
Wage rate (per hour) $3 $4 $5 $6 $7 $8 $9 $10
Labor demanded 50 45 40 35 30 25 20 15
Labor supplied 20 30 40 50 60 70 80 90
On the graph below, illustrate
(a) The equilibrium wage.
(b) A government-set minimum wage of $6 per hour when the minimum wage is
implemented.
(c) How many workers lose jobs?
(d) How many additional workers seek jobs?
(e) How many workers end up unemployed? (LO 16-03)
Answers:
Feedback:
(a) The equilibrium wage is $5, where the quantity of labor demanded equals the quantity of
(b) See graph above. Labor demand can be graphed by plotting the labor demanded at the
7
© 2016 by McGraw-Hill Education. This is proprietary material solely for authorized instructor use. Not authorized for sale or distribution in any
manner. This document may not be copied, scanned, duplicated, forwarded, distributed, or posted on a website, in whole or part.
(c) With a minimum wage at $6, 5 workers lose their jobs as quantity demanded decreases
(d) There will be 10 more workers seeking jobs as quantity supplied increases from 40
(e) After the minimum wage is implemented, there will be 15 people unemployed (i.e., there
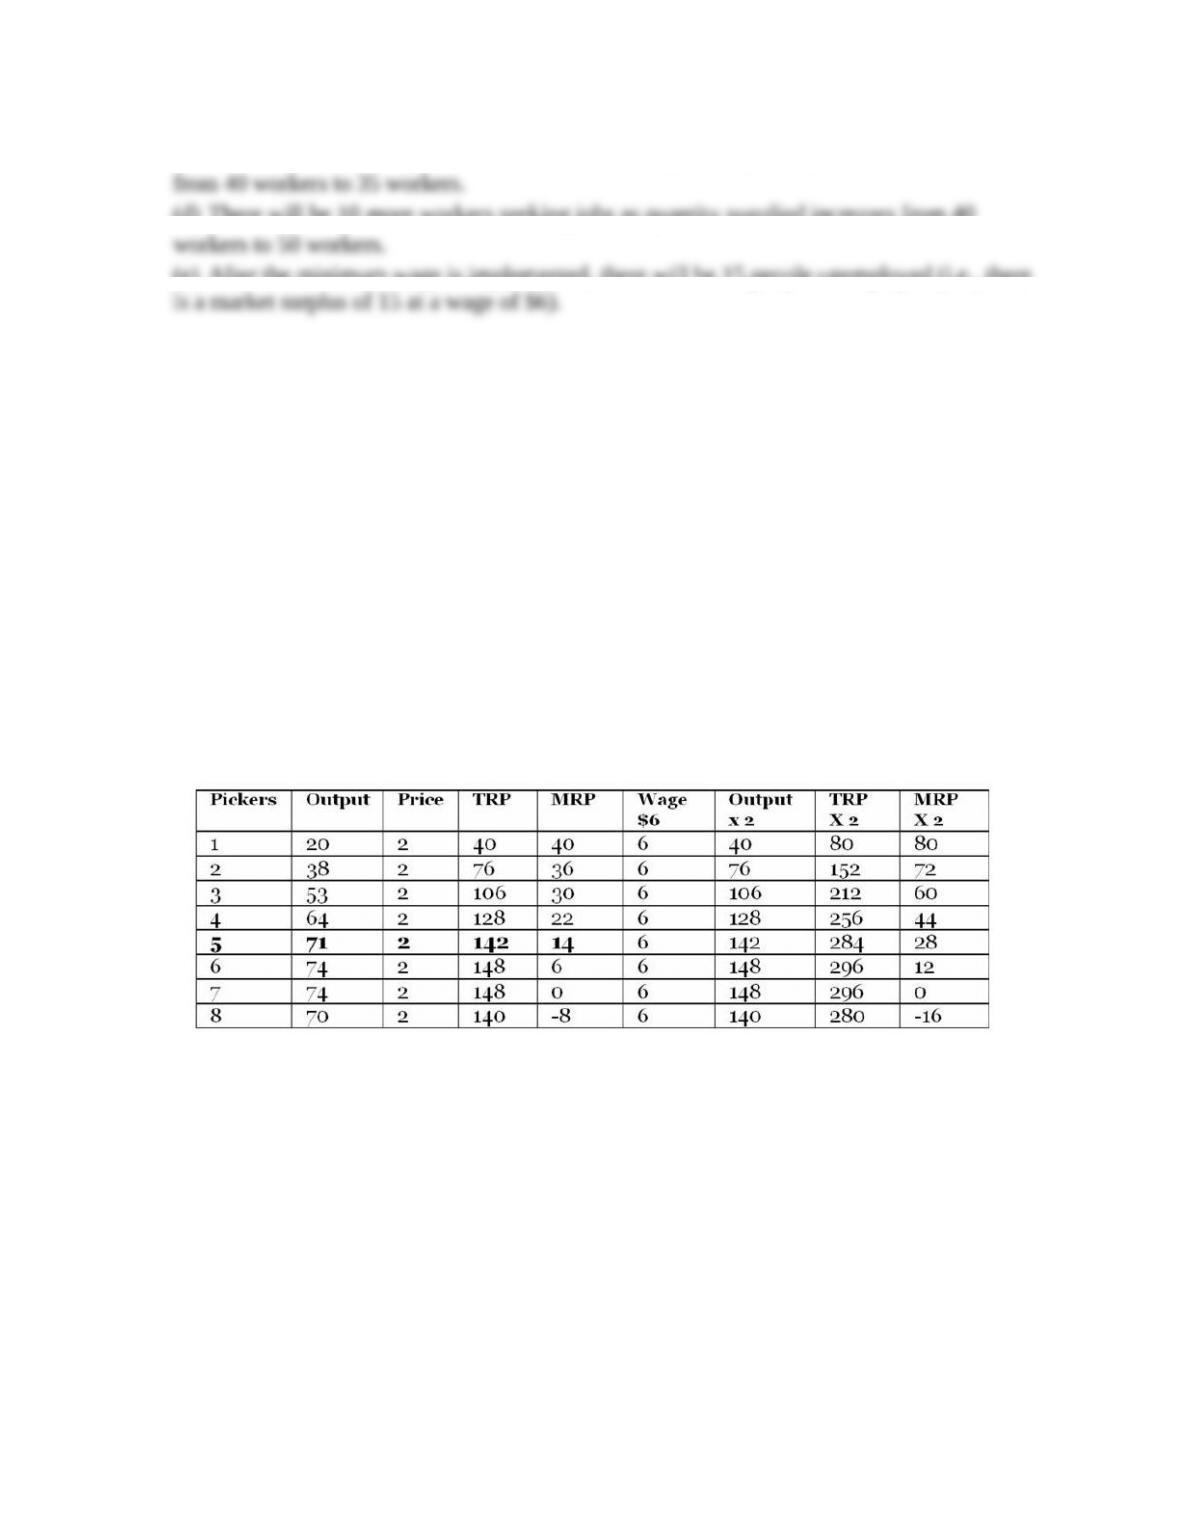
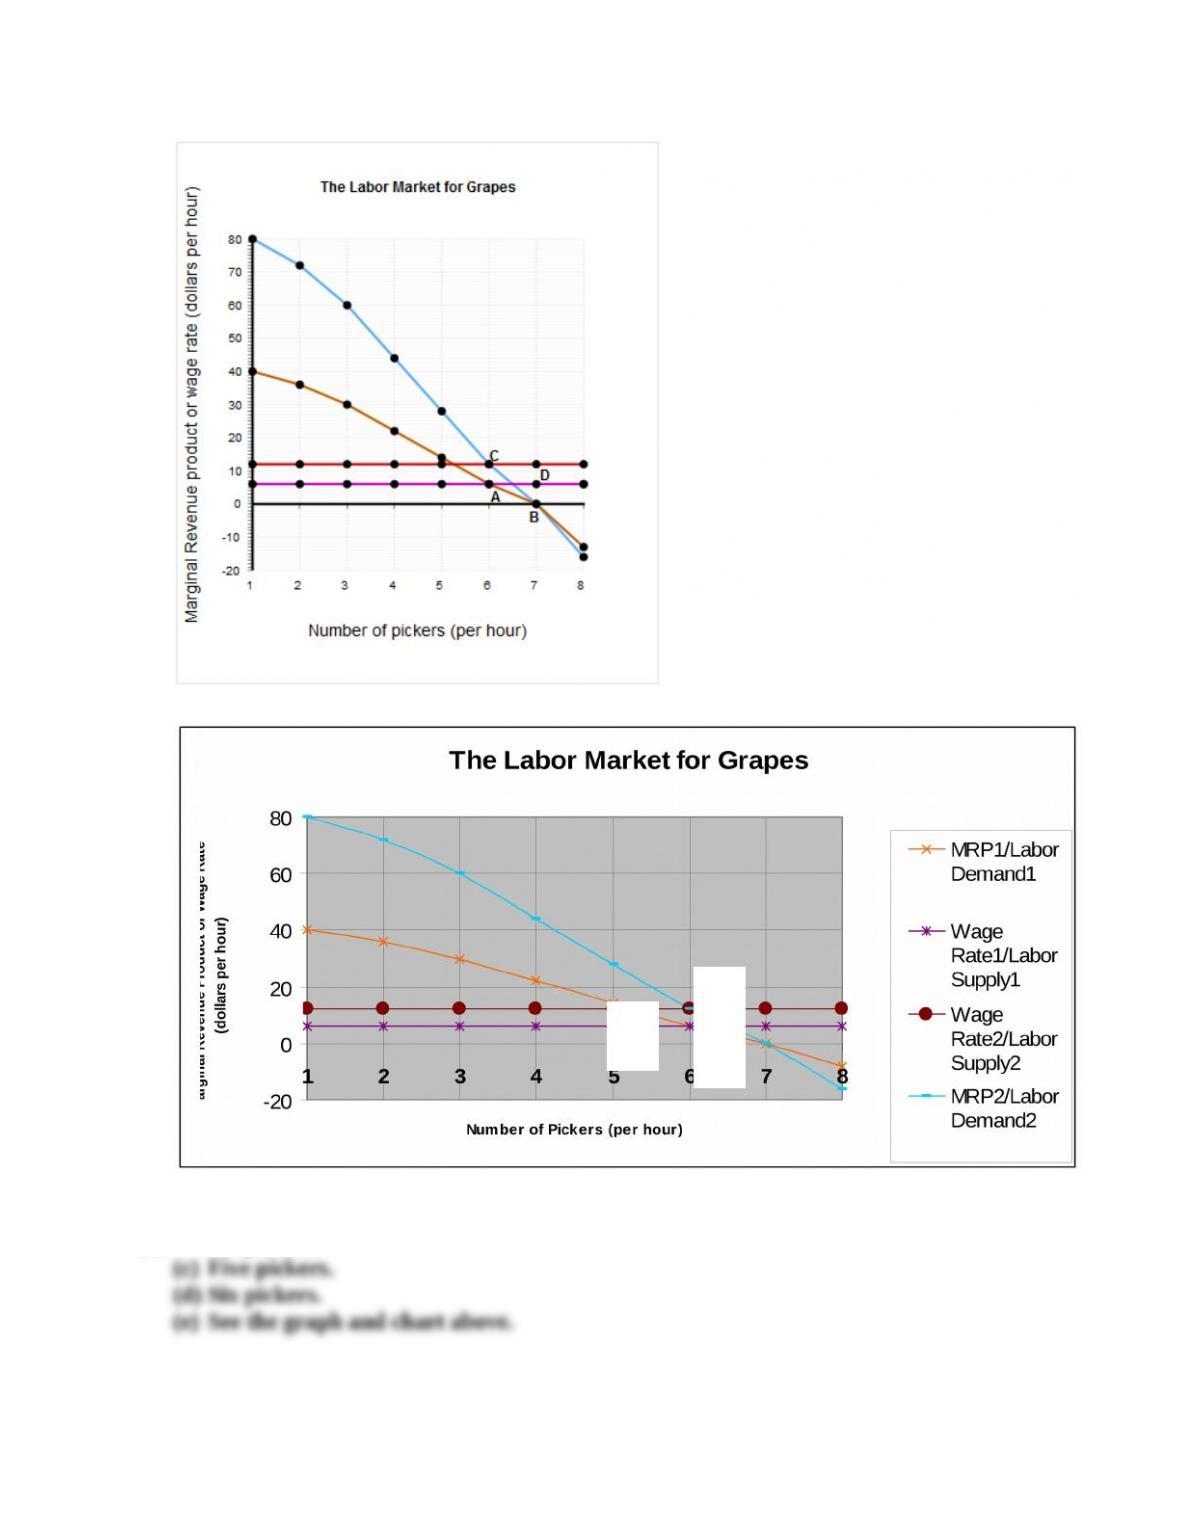
10. The following table depicts the number of grapes that can be picked in an hour with varying
amounts of labor:
Number of pickers (per hour) 1 2 3 4 5 6 7 8
Output of grapes (in flats) 20 38 53 64 71 74 74 70
(a) Illustrate the supply and demand of labor for a single farmer, assuming that the local wage
rate is $6 an hour and a flat of grapes sells for $2.
(b) How many pickers will be hired?
(c) If the wage rate doubles, how many pickers will be hired?
(d) If the productivity of all workers doubles, how many pickers will be hired at a wage of
$12 an hour?
(e) Illustrate your answers on the graph below. (LO 16-02)
Answers:
(a) Supply and demand intersect at six units and $6.
8
© 2016 by McGraw-Hill Education. This is proprietary material solely for authorized instructor use. Not authorized for sale or distribution in any
manner. This document may not be copied, scanned, duplicated, forwarded, distributed, or posted on a website, in whole or part.
..
..
..
(b) Six pickers.
Feedback:
9
© 2016 by McGraw-Hill Education. This is proprietary material solely for authorized instructor use. Not authorized for sale or distribution in any
manner. This document may not be copied, scanned, duplicated, forwarded, distributed, or posted on a website, in whole or part.
B
C
D
(a) See table above.
(b) The firm is perfectly competitive in the labor market and can hire all the labor it wants at
(c) If the wage rate were to double to $12 per hour, a firm would no longer be willing to hire
(d) If both productivity and wage double, the firm will once again hire six pickers.
11. By how much would the quantity of labor demanded decrease if a minimum wage hike raised
prevailing wages from $8 to $10 an hour and if the elasticity of labor demand were 0.10?
(LO 16-03)
Feedback:
Elasticity of labor demand = Percentage change in quantity of labor demanded/Percentage
change in wage rate
10
© 2016 by McGraw-Hill Education. This is proprietary material solely for authorized instructor use. Not authorized for sale or distribution in any
manner. This document may not be copied, scanned, duplicated, forwarded, distributed, or posted on a website, in whole or part.