Chapter 11: Oligopoly
1. How many bookstores are on or near your campus? If there were more bookstores, how
would the price of new and used books be affected? (LO 11-01)
2. What entry barriers exist in (a) the fast-food industry, (b) cable television, (c) the auto
industry, (d) illegal drug trade, (e) potato chips and (f) beauty parlors? (LO 11-01)
Answers:
3.Why does RC Cola depend on advertising to gain market share? (See News, p. 244.) Why
not offer cheaper sodas than Coke or Pepsi? (LO 11-03)
Answer: Pepsi and Coke have marketing muscle and financial resources that would bury
4. Why was the Saudi Arabia oil minister “happy” with OPEC’s production decision (World
View, p. 250)? Would he have been happier with less production and higher prices?
(LO 11-02)
1
© 2016 by McGraw-Hill Education. This is proprietary material solely for authorized instructor use. Not authorized for sale or distribution in any
manner. This document may not be copied, scanned, duplicated, forwarded, distributed, or posted on a website, in whole or part.
5. If an oligopolist knows rivals will match a price cut, would it ever reduce its price?
(LO 11-03)
6. How might the high concentration ratio in the credit card industry (Table 11.2) affect the
annual fees and interest charges for credit card services? (LO 11-02)
7. What evidence of economies of scale is cited in the proposed cigarette merger (News, p.
255)? Should the acquisition be approved? (LO 11-02)
8. What reasons might rival airlines have for not matching Delta’s fare increase? (See News,
p. 246.) (LO 11-03)
9. The Ivy League schools defended their price-fixing arrangement (see p. 251) by arguing
that their coordination assured a fair distribution of scholarship aid. Who was hurt or
helped by this arrangement? (LO 11-02)
10. Using the payoff matrix in Table 11.4, decide whether Universal should cut its price. What
factors will influence the decision? (LO 25-03)
2
© 2016 by McGraw-Hill Education. This is proprietary material solely for authorized instructor use. Not authorized for sale or distribution in any
manner. This document may not be copied, scanned, duplicated, forwarded, distributed, or posted on a website, in whole or part.
11. Dominos and Pizza Hut hold 66 percent of the delivered-pizza market. Should antitrust
action be taken? (LO 11-01)
12. Why do phone companies offer incentives to purchase two-year wireless service
agreements? (LO 11-03)
Problems
1. According to Table 11.2, in how many markets do fewer than four firms produce at least 80
percent of total output? (LO 11-01
2. According to the World View on page 250,
(a) By what percentage did the price of oil increase after OPEC’s announcement?
(b) What caused the price increase: A = shift of demand, B = shift of supply, or C = shift of
both supply and demand?
(c) Which shift factor changed? (LO 11-02)
3. According to the News on page 244,
(a) What is the concentration ratio in the U.S. soda market?
(b) What is the maximum value of the Herfindahl-Hirschman Index? (LO 11-02)
3
© 2016 by McGraw-Hill Education. This is proprietary material solely for authorized instructor use. Not authorized for sale or distribution in any
manner. This document may not be copied, scanned, duplicated, forwarded, distributed, or posted on a website, in whole or part.
4. According to the News on page 255, what were the values of
(a) The concentration ratio in the cigarette industry
(i) prior to the merger?
(ii) after the merger?
(b) The maximum value of the Herfindahl-Hirshman Index
(i) prior to the merger?
(ii) after the merger?
(c) Which measure best reflects the increased market power? (LO 11-01)
5. (a) According to the News on page 255, how many years will it take Reynolds to recoup its
purchase price through cost savings?
(b) If Reynolds increases cigarette prices by 10 percent and the price elasticity of demand
is 0.4, by how much money will its annual revenue of $11 billion increase? (LO 11-02
4
© 2016 by McGraw-Hill Education. This is proprietary material solely for authorized instructor use. Not authorized for sale or distribution in any
manner. This document may not be copied, scanned, duplicated, forwarded, distributed, or posted on a website, in whole or part.
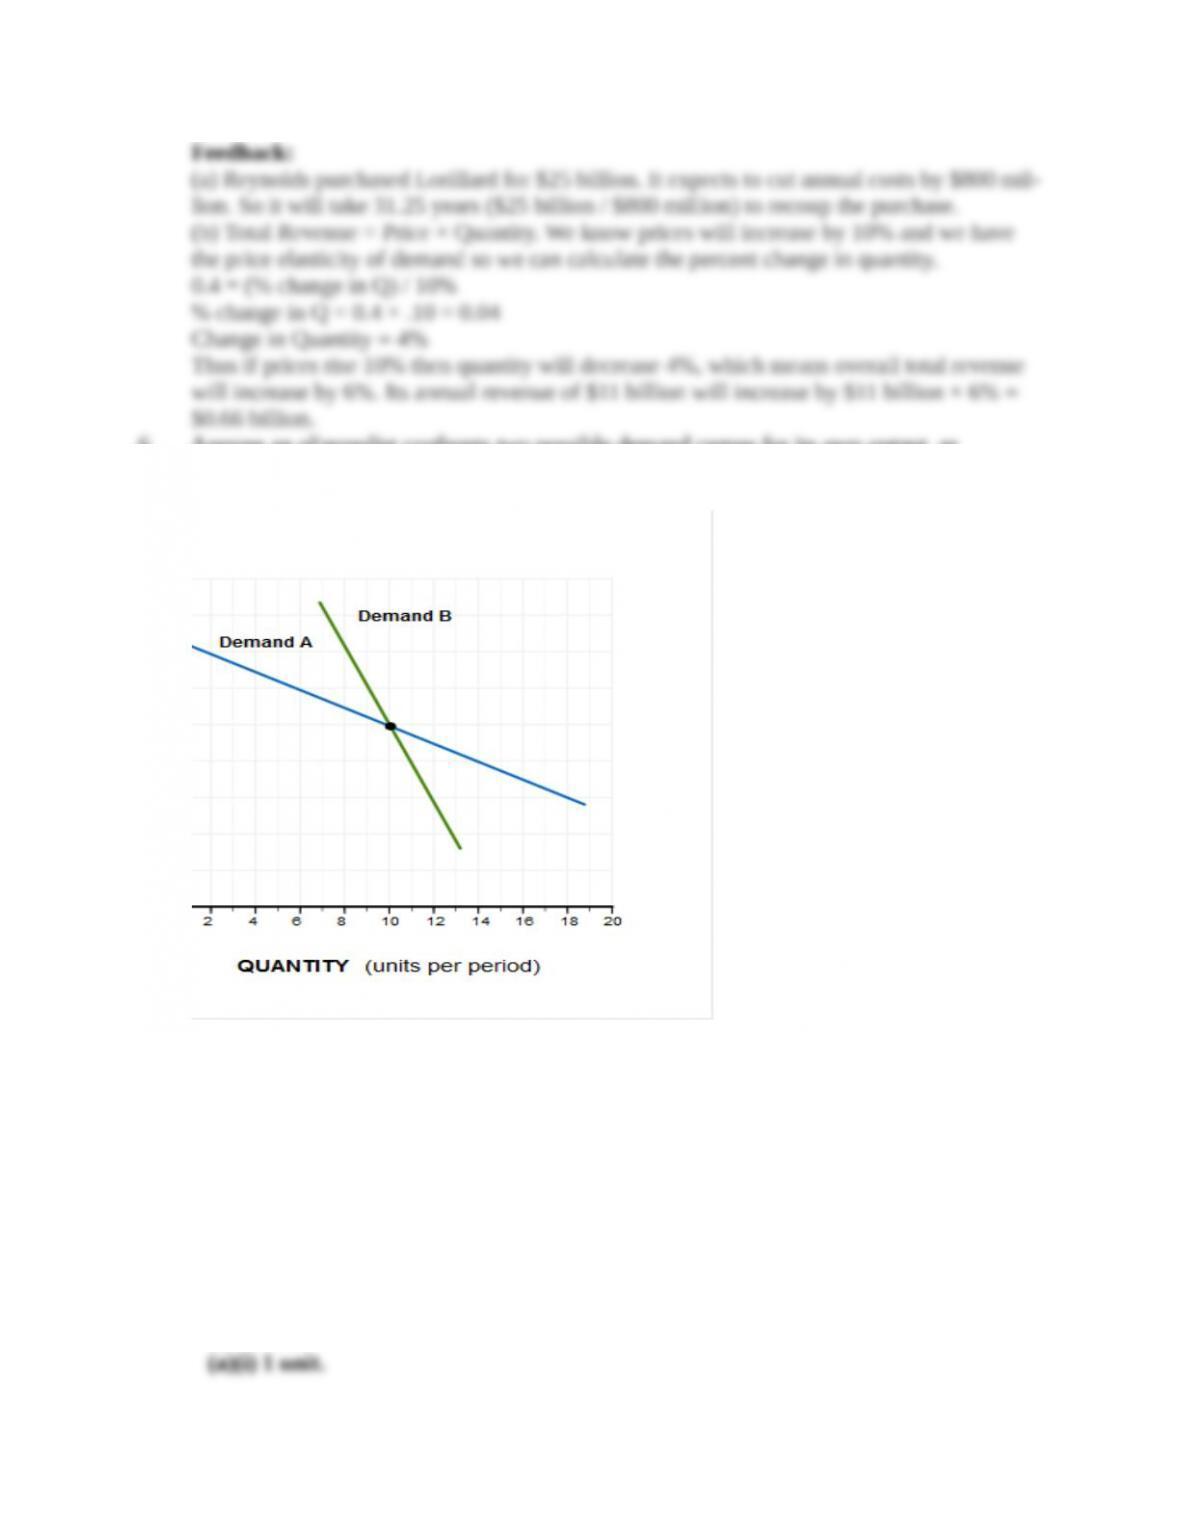
6. Assume an oligopolist confronts two possible demand curves for its own output, as
illustrated here. The first (A) prevails if other oligopolists don’t match price changes. The
second (B) prevails if rivals do match price changes.
(a) By how much does quantity demanded increase if the price is reduced from $11 to $9
and
(i) Rivals match the price cut?
(ii) Rivals don’t match the price cut?
(b) By how much does quantity demanded change when the price is raised from $11 to $13
and
(i) Rivals match the price hike?
(ii) Rivals don’t match the price hike? (LO 11-03)
Answers:
5
© 2016 by McGraw-Hill Education. This is proprietary material solely for authorized instructor use. Not authorized for sale or distribution in any
manner. This document may not be copied, scanned, duplicated, forwarded, distributed, or posted on a website, in whole or part.
Feedback:
(a) The shape of the demand curve facing an oligopolist depends on the responses of its
(b)The opposite is true if the oligopolist decides to raise prices. If rival oligopolists match
7. How large would the probability of a “don’t match” outcome have to be to make a
Universal price cut statistically worthwhile? (See expected payoff, p. 248.) (LO 11-03)
Answer: Greater than 1.96 percent.
Feedback:
Expected value = [Probability that rivals match × Size of loss from price cuts] +
6
© 2016 by McGraw-Hill Education. This is proprietary material solely for authorized instructor use. Not authorized for sale or distribution in any
manner. This document may not be copied, scanned, duplicated, forwarded, distributed, or posted on a website, in whole or part.
8. Suppose the payoff to each of four strategic interactions is as follows:
Rival Response
Action Reduce Price Don’t Reduce Price
Reduce Price Loss = $800 Gain = $50,000
Don’t Reduce Price Loss = $6,000 No loss or gain
(a) If the probability of rivals matching a price reduction is 98 percent, what is the
expected payoff of a price cut?
(b) If the probability of rivals reducing price even though you don’t is 5 percent, what is
the expected payoff of not reducing price? (LO 11-03)
Answers:
Feedback:
(a) If the probability of rivals matching a price reduction is 98 percent,
(b) If the probability of rivals matching a price reduction is 5 percent,
9. Suppose that the following schedule summarizes the sales (demand) situation confronting
an oligopolist:
Price (per unit) $8 $10 $12 $14 $16 $17 $18 $19 $20
Quantity Demanded
(units per period) 10 9 8 7 6 5 4 3 2
7
© 2016 by McGraw-Hill Education. This is proprietary material solely for authorized instructor use. Not authorized for sale or distribution in any
manner. This document may not be copied, scanned, duplicated, forwarded, distributed, or posted on a website, in whole or part.
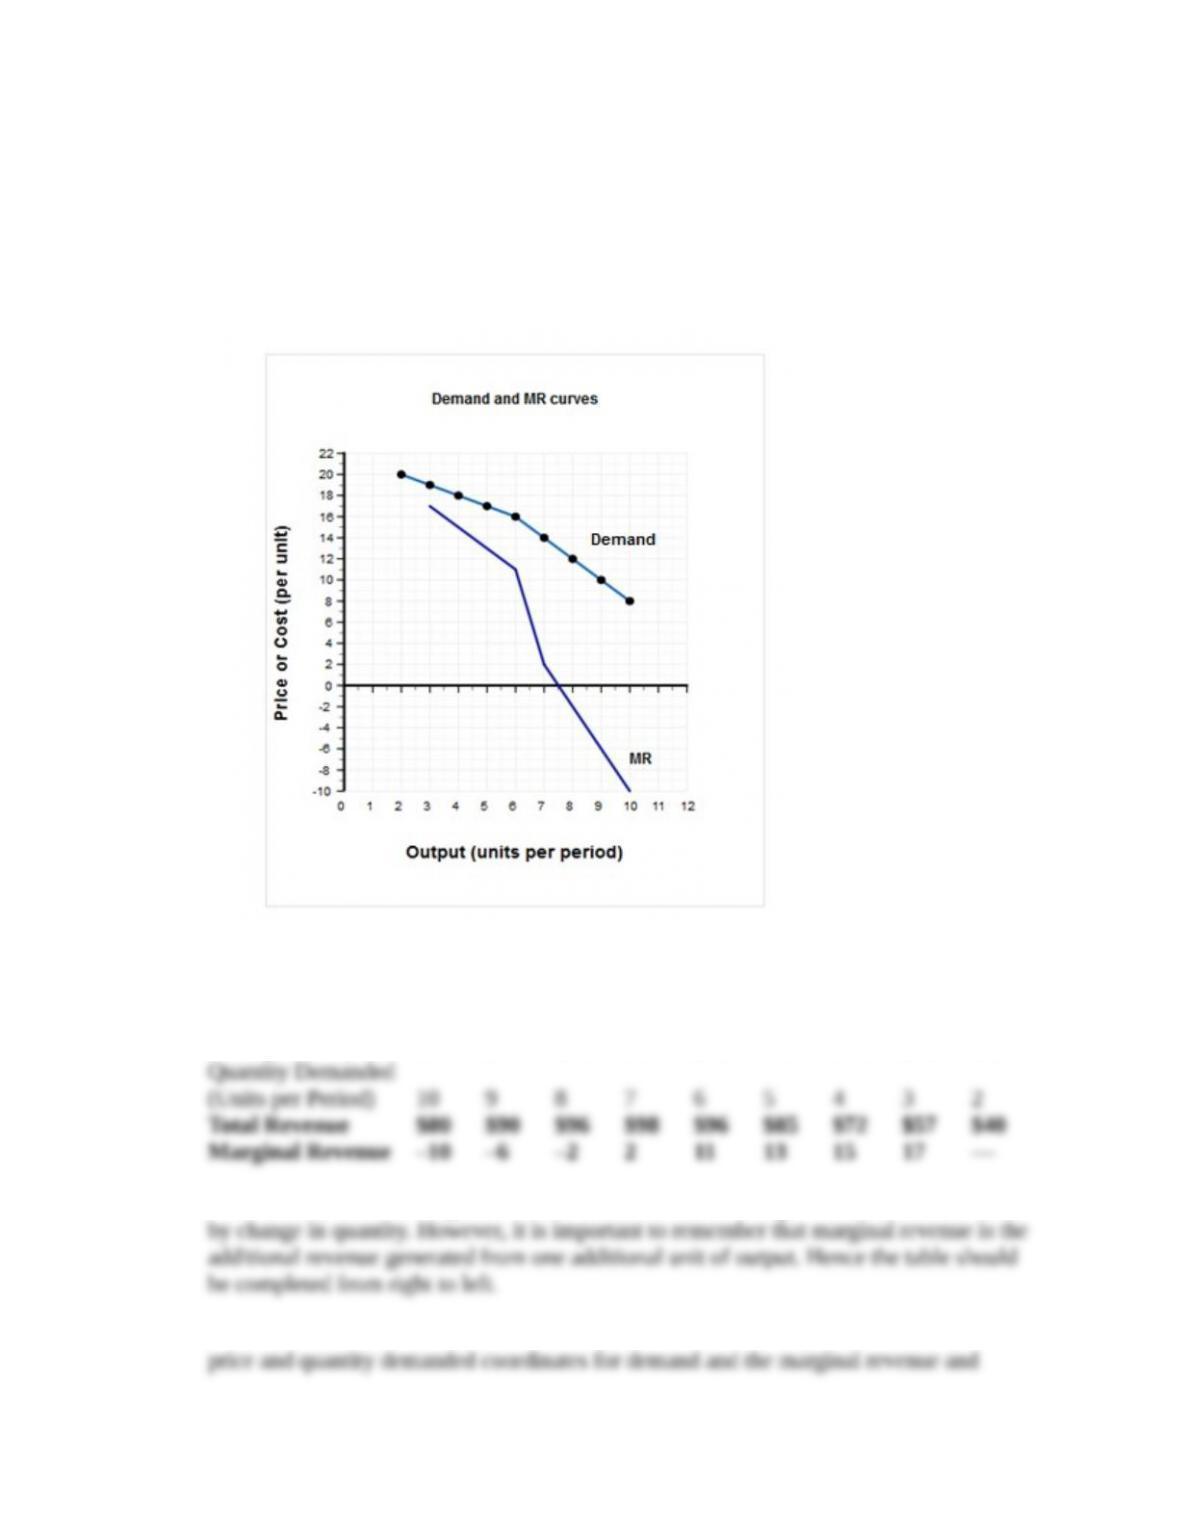
Using the following graph,
(a) Draw the demand and marginal revenue curves facing the firm.
(b) Identify the profit-maximizing rate of output in a situation where marginal cost is
constant at $11 per unit. (LO 11-02)
Answers:
(a)
(b) 6 units.
Feedback:
(a)
Price (per Unit) $8 $10 $12 $14 $16 $17 $18 $19 $20
In the table provided, marginal revenue is determined as change in total revenue divided
To graph the demand and marginal revenue curves facing the oligopoly, simply plot the
8
© 2016 by McGraw-Hill Education. This is proprietary material solely for authorized instructor use. Not authorized for sale or distribution in any
manner. This document may not be copied, scanned, duplicated, forwarded, distributed, or posted on a website, in whole or part.
(b) The profit-maximizing production rate occurs at the kink in the demand curve at a
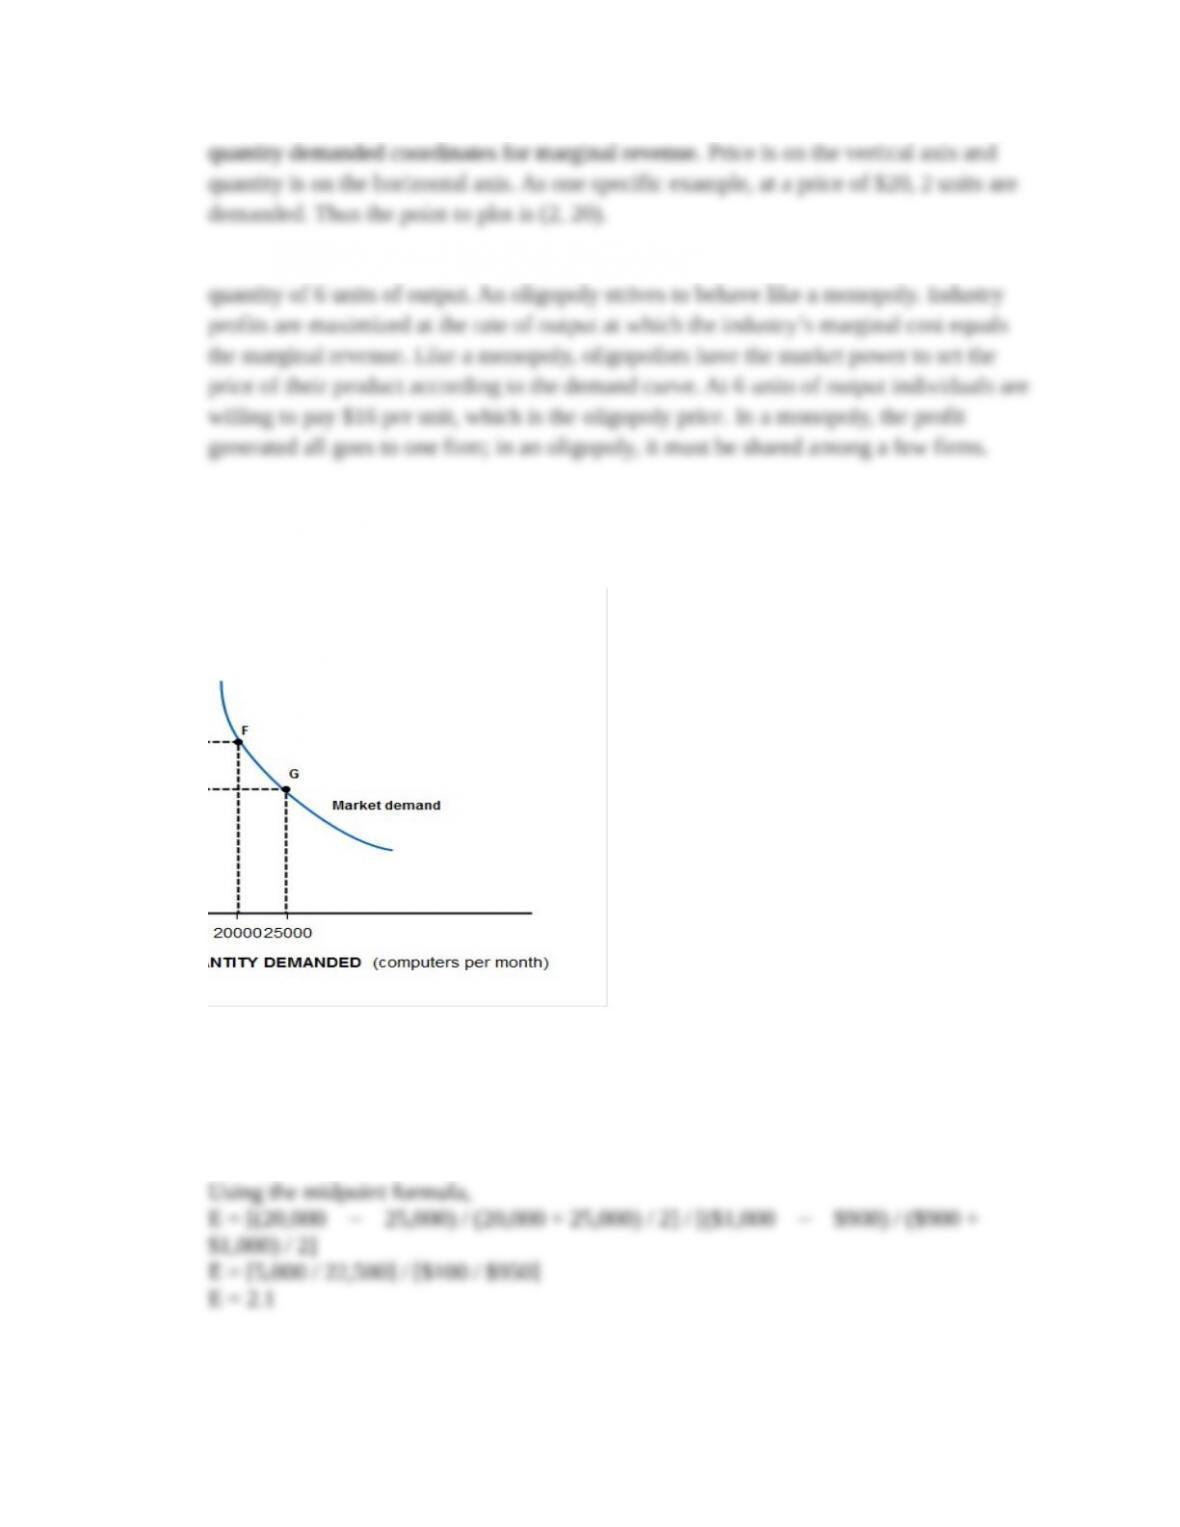
10. What is the price elasticity of demand between points F and G in Figure 11.2?
(LO 11-02)
Answer: 2.1.
Feedback:
E = Percentage change in quantity demanded / Percentage change in price
9
© 2016 by McGraw-Hill Education. This is proprietary material solely for authorized instructor use. Not authorized for sale or distribution in any
manner. This document may not be copied, scanned, duplicated, forwarded, distributed, or posted on a website, in whole or part.
11. If the price elasticity of demand for oil is 0.2, by how much would oil prices have fallen
in 2014 had OPEC increased output from 30 to 32 million barrels per day rather than
holding output constant (World View, p. 250)? (LO 11-03)
Feedback:
E = Percentage change in quantity demanded / Percentage change in price
10
© 2016 by McGraw-Hill Education. This is proprietary material solely for authorized instructor use. Not authorized for sale or distribution in any
manner. This document may not be copied, scanned, duplicated, forwarded, distributed, or posted on a website, in whole or part.