Unlock document.
This document is partially blurred.
Unlock all pages and 1 million more documents.
Get Access
Chapter 10: Monopoly
Solutions Manual
Learning Objectives for Chapter 10
After reading this chapter, you should know
LO 10-01. How a monopolist sets price and output.
LO 10-02. How monopoly and competitive outcomes differ.
LO 10-03. The pros and cons of monopoly.
Questions for Discussio
1. The objective in the game of Monopoly is to get all the property and then raise the rents.
Can this power be explained with market supply and demand curves? (LO 10-01)
Answer: Yes. Players who land on a property on the board have no choice but to pay the
2. According to the Federal Trade Commission (News, p. 228), how often do monopolies lead
to higher prices? Why, then, did the rocket merger get approved? (LO 10-01)
3. Why don't monopolists try to establish "the highest price possible,” as many people allege?
What would happen to sales? To profits? (LO 10-01)
4. How does Ticketmaster’s “dynamic pricing” (News, p. 224) affect ticket sales, total
revenue, and profit? (LO 10-01)
1
© 2016 by McGraw-Hill Education. This is proprietary material solely for authorized instructor use. Not authorized for sale or distribution in any
manner. This document may not be copied, scanned, duplicated, forwarded, distributed, or posted on a website, in whole or part.
5. What are the Intel entry barriers mentioned in the News on page 226? How effective might
they be? (LO 10-02)
6. What would have happened to iPad prices and features if Apple had not faced competition
from iPad clones (Chapter 9)? (LO 10-02)
7. What entry barriers helped protect the following?
(a) The Russian sable monopoly (World View, p. 216)
(b) The Live Nation monopoly (News, p. 221)
(c) The Intel monopoly (News, p. 226)
(d) The rocket monopoly (News, p. 228)
(e) Google’s search dominance (News, p. 233)
(LO 10-02)
8. What similarities exist between the AT&T, Microsoft, and Google antitrust cases?
(LO 10-03)
2
© 2016 by McGraw-Hill Education. This is proprietary material solely for authorized instructor use. Not authorized for sale or distribution in any
manner. This document may not be copied, scanned, duplicated, forwarded, distributed, or posted on a website, in whole or part.
9. How might consumers benefit from the merger of XM and Sirius (News, p. 229)? How
might they have lost? (LO 10-03)
10. How might Google’s search-engine dominance harm consumers? Help them?? (LO 10-03)
Problem
1. Use Figures 10.2 and 10.3 to answer the following questions:
(a) What is the highest price the monopolist could charge and still sell fish?
(b) What is total revenue at that highest price?
(c) What rate of output maximizes total revenue (partial unit okay)?
(d) What rate of output maximizes total profit (use higher rate)?
(e) What is MR at that rate of output?
(f) What is the price at the profit-maximizing rate of output? (LO 10-01)
Feedback:
(a) A monopolist confronts the downward-sloping market demand curve; it is
3
© 2016 by McGraw-Hill Education. This is proprietary material solely for authorized instructor use. Not authorized for sale or distribution in any
manner. This document may not be copied, scanned, duplicated, forwarded, distributed, or posted on a website, in whole or part.
(b) Total Revenue = Price × Quantity. In this case the highest price that a consumer will
(c) Total Revenue = Price × Quantity. Total revenue is maximized at the rate of seven
(d) Remember that a monopolist confronts the industry (market) demand curve. The
demand curve for a single monopolistic firm is thus downward-sloping instead of
(e) Marginal Revenue is $7 at 4 bushels of output per day (point d in Figure 10.3).
(f) Point D on the demand curve in Figure 10.3 indicates that consumers are willing to
2. (a) Complete the following table:
Price $24 $21 $18 $15 $12 $9 $6 $3
Quantity Demanded 1 2 3 4 5 6 7 8
Marginal Revenue ___ ___ ___ ___ ___ ___ ___ ___
(b) At what rate of output does marginal revenue turn negative?
(c) If marginal cost is constant at $12, what is the profit-maximizing rate of output?
(d) What price should be charged at that rate of output? (LO 10-01)
Answers:
(a)
Price $24 $21 $18 $15 $12 $9 $6 $3
Quantity Demanded 1 2 3 4 5 6 7 8
Feedback:
(a) Total revenue = Price × Quantity. Find this first for each price and quantity
4
© 2016 by McGraw-Hill Education. This is proprietary material solely for authorized instructor use. Not authorized for sale or distribution in any
manner. This document may not be copied, scanned, duplicated, forwarded, distributed, or posted on a website, in whole or part.
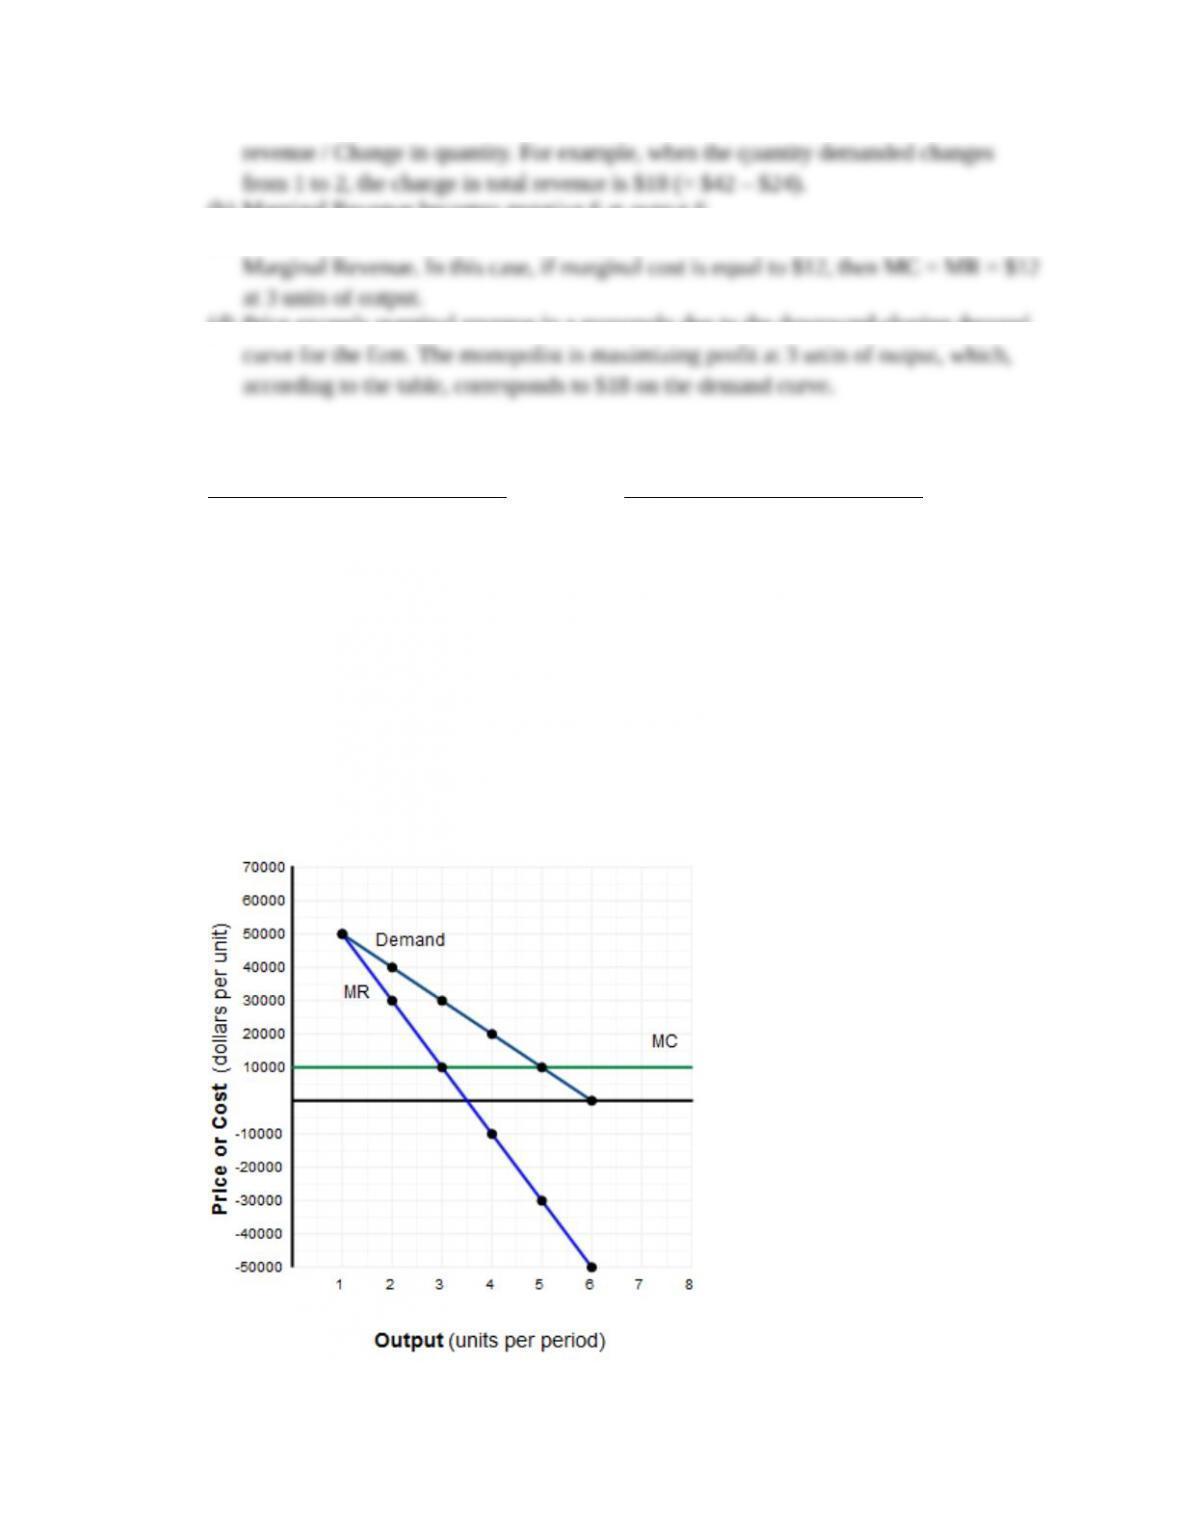
(b) Marginal Revenue becomes negative 6 at output 6.
(c) For a monopoly, the profit-maximizing rate of output is where Marginal Cost =
(d) Price exceeds marginal revenue in a monopoly due to the downward-sloping demand
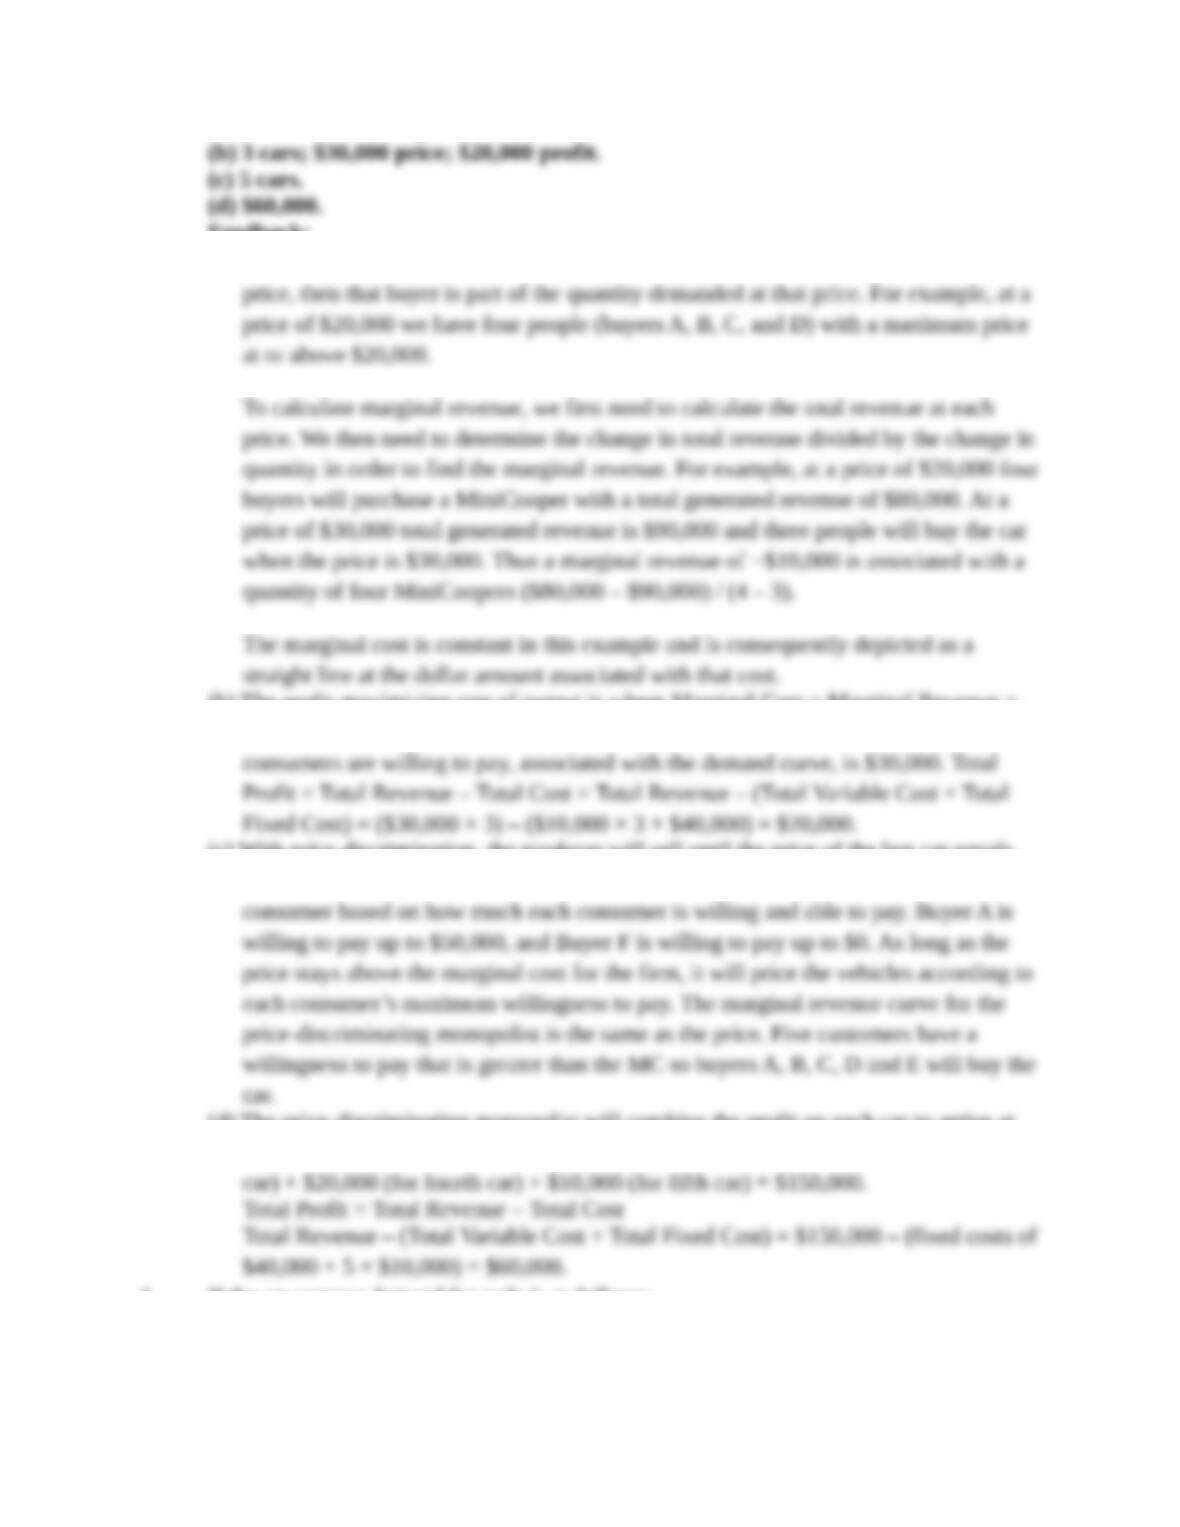
3. The following table indicates the prices various buyers are willing to pay for a Mini
Cooper car:
Buyer Maximum Price Buyer Maximum Price
Buyer A $50,000 Buyer D $20,000
Buyer B 40,000 Buyer E 10,000
Buyer C 30,000 Buyer F 0
The cost of producing the cars includes $40,000 of fixed costs and a constant marginal
cost of $10,000.
(a) Graph below the demand, marginal revenue, and marginal cost curves.
(b) What is the profit-maximizing rate of output and price for a monopolist? How much
total profit does the monopolist make?
(c) If the monopolist can price discriminate, how many cars will he sell?
(d) How much profit will he make? (LO 10-01)
Answers:
(a) See graph below.
5
© 2016 by McGraw-Hill Education. This is proprietary material solely for authorized instructor use. Not authorized for sale or distribution in any
manner. This document may not be copied, scanned, duplicated, forwarded, distributed, or posted on a website, in whole or part.
Feedback:
(a) For any given price, if there exists a buyer with a maximum price above that given
(b) The profit-maximizing rate of output is where Marginal Cost = Marginal Revenue =
$10,000 at 3 MiniCoopers. At a quantity demanded of 3 cars, the maximum price that
(c) With price discrimination, the producer will sell until the price of the last car equals
the marginal cost. The monopolist will price the cars differently for each and every
(d) The price-discriminating monopolist will combine the profit on each car to arrive at
the total profit: $50,000 (for first car) + $40,000 (for second car) + $30,000 (for third
4. If the on-campus demand for soda is as follows:
Price (per can) $0.25 0.50 0.75 1.00 1.25 1.50 1.75 2.00
Quantity demanded
6
© 2016 by McGraw-Hill Education. This is proprietary material solely for authorized instructor use. Not authorized for sale or distribution in any
manner. This document may not be copied, scanned, duplicated, forwarded, distributed, or posted on a website, in whole or part.
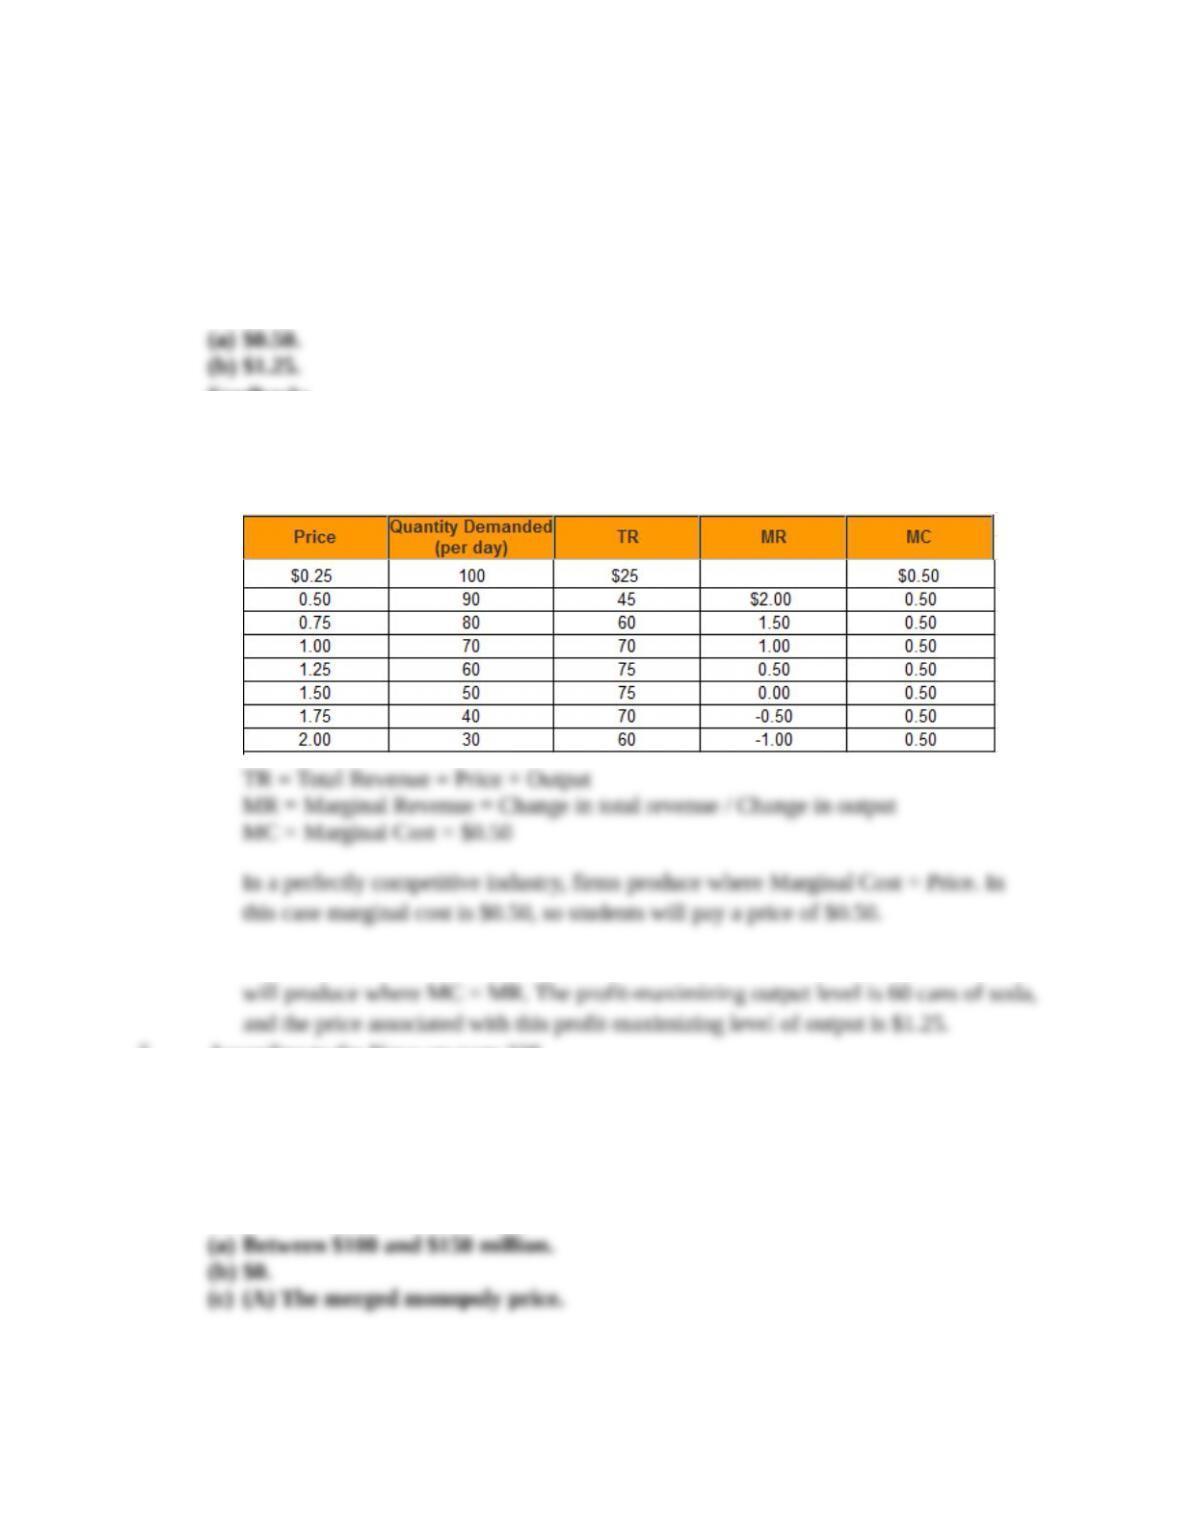
(per day) 100 90 80 70 60 50 40 30
and the marginal cost of supplying a soda is 50 cents, what price will students end up
paying in
(a) A perfectly competitive market?
(b) A monopolized market? (LO 10-02)
Answers:
Feedback:
(a) The accompanying table shows the Total Revenue, Marginal Revenue, and Marginal
Cost associated with the information provided in the problem.
(b) For a monopoly, price is always greater than marginal revenue. A monopolistic firm
5. According to the News on page 228,
(a) What was the annual cost saving for the rocket monopoly (in $ millions)?
(b) How much of this saving did the FTC expect to be reflected in reduced rocket prices?
(c) According to economic theory, which is likely to be higher, A: the merged monopoly
price; or B: the two-firm competitive price? (LO 10-03)
Answers:
Feedback:
7
© 2016 by McGraw-Hill Education. This is proprietary material solely for authorized instructor use. Not authorized for sale or distribution in any
manner. This document may not be copied, scanned, duplicated, forwarded, distributed, or posted on a website, in whole or part.
(a) According to the text and News on page 228, the annual anticipated cost saving for
(b) According to the News on page 228, the FTC expected this merger to bring about
(c) Competition (even when the competition is between only two firms) forces suppliers
6. By how much did the price of the heart drug for babies increase when a monopoly was
established (News, p. 223)? (LO 10-02)
Feedback: The price skyrocketed from $36 to $500, so there was a $464 (= $500 − $36)
reap tremendous profits from market power.
7. The following table summarizes the weekly sales and cost situation confronting a
monopolist:
Average
Quantity Total Marginal Total Marginal Total
Price Demanded Revenue Revenue Cost Cost Cost
$22 0 $4
20 1 8
18 2 13
16 3 19
14 4 27
12 5 37
10 6 51
8 7 69
(a) Complete the table.
(b) Graph the demand, MR, and MC curves on the following graph.
(c) At what rate of output is total revenue maximized within this range?
(d) What are the values of MR and MC at the revenue-maximizing rate of output?
(e) At what rate of output are profits maximized?
(f) What are the values of MR and MC at the profit-maximizing rate of output?
(g) What are total profits at that output rate?
(h) If a competitive industry confronted the same demand and costs, how much output
would it produce in the short run? (LO 10-02)
Answers:
(a)
8
© 2016 by McGraw-Hill Education. This is proprietary material solely for authorized instructor use. Not authorized for sale or distribution in any
manner. This document may not be copied, scanned, duplicated, forwarded, distributed, or posted on a website, in whole or part.
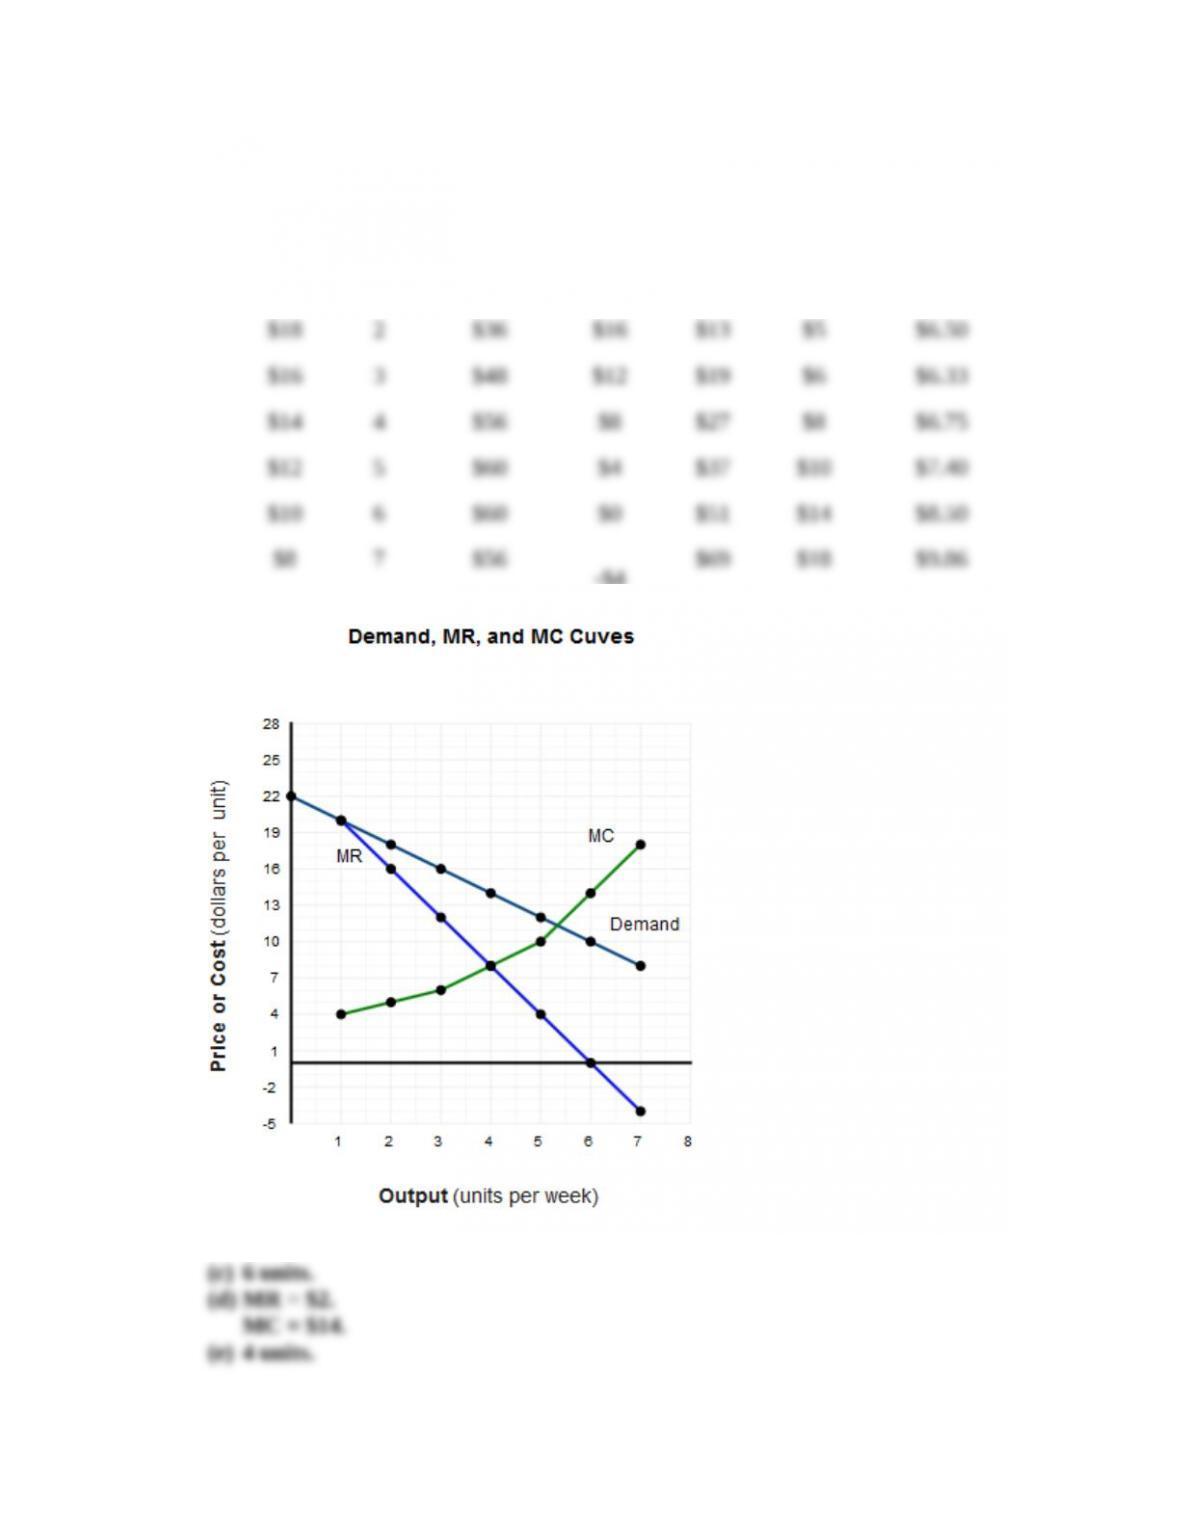
Price Quantity Total
Revenue
Marginal
Revenue
Total
Cost
Marginal
Cost
Average
Total Cost
$22 0 $0 --- $4 --- ---
$20 1 $20 $20 $8 $4 $8.00
(b) See graph below.
9
© 2016 by McGraw-Hill Education. This is proprietary material solely for authorized instructor use. Not authorized for sale or distribution in any
manner. This document may not be copied, scanned, duplicated, forwarded, distributed, or posted on a website, in whole or part.
Feedback:
(a) Total Revenue = Price × Quantity
(b) To graph demand, plot the price and quantity demanded combinations provided. To
(c) Total revenue is maximized at a value of $60 or an output rate of six units. This is the
(d) According to the table provided, at a total revenue of $60 (six units of output),
(e) For a monopolist, the profit-maximizing rate of output is where MC = MR. This
(f) At the profit-maximizing rate of output (four units), marginal revenue is $0 and
(g) Profit = Total Revenue – Total Cost. At four units of output, total revenue is $56 and
(h) A competitive industry produces where supply and demand intersect (i.e., where
10
© 2016 by McGraw-Hill Education. This is proprietary material solely for authorized instructor use. Not authorized for sale or distribution in any
manner. This document may not be copied, scanned, duplicated, forwarded, distributed, or posted on a website, in whole or part.


