Chapter 1: Economics: The Core Issues
Solutions Manual
Learning Objectives for Chapter 1
After reading this chapter, you should know
LO 01-01. How scarcity creates opportunity costs.
LO 01-02. What the production-possibilities curve represents.
LO 01-03. The three core economic questions that every society must answer.
LO 01-04. How market and government approaches to economic problems differ.
Questions for Discussion
1. What opportunity costs did you incur in reading this chapter? If you read another chapter
today, would your opportunity costs (per chapter) increase? Explain. (LO 01-01)
Answer: Opportunity cost is what you must give up to get the next best alternative. In this
case, opportunity costs include the things you could have done with your time instead of
2. How much time could you spend on homework in a day? How much do you spend? How do
you decide? (LO 01-01)
Answer: You theoretically could spend 24 hours in a day doing homework. However, in
reality, there is a limit to the amount of time in which you can effectively complete your
3. What’s the real cost of the food in the “free lunch” cartoon on page 6? (LO 01-01)
Answer: Even if a bar doesn’t charge for lunch, preparation of the lunch requires the use of
1
© 2016 by McGraw-Hill Education. This is proprietary material solely for authorized instructor use. Not authorized for sale or distribution in any
manner. This document may not be copied, scanned, duplicated, forwarded, distributed, or posted on a website, in whole or part.
4. How might a nation’s production possibilities be affected by the following? (LO 01-02)
a. New solar technology.
b. An increase in immigration.
c. An increase in military spending.
d. An increase in college tuition.
Answer:
(a) In general, a nation’s production possibilities curve will shift due to a change in resources,
(b) An increase in immigration is an example of an increase in resources for a nation. An
(c) An increase in military spending will, in general, simply move the economy from one
point on the production possibilities curve to a different point on the curve since this is
(d) An increase in college tuition would, in the short run, result in a movement along the
5. What are the opportunity costs of developing wind farms to generate “clean” electricity?
Should we make the investment? (LO 01-01)
Answer: Wind is freely available (when it is actually blowing of course). However, we need
6. Who would go to college in a completely private (market) college system? How does
government intervention change this FOR WHOM outcome? (LO 01-03)
2
© 2016 by McGraw-Hill Education. This is proprietary material solely for authorized instructor use. Not authorized for sale or distribution in any
manner. This document may not be copied, scanned, duplicated, forwarded, distributed, or posted on a website, in whole or part.
Answer: Financial aid and guaranteed student loans make college accessible to more people.
7. Why do people around the world have so much faith in free markets (World View, p. 15)?
(LO 01-04)
Answer: Market-based incomes based on private property may motivate higher productivity;
8. How many resources should we allocate to space exploration? How will we make this
decision? (LO 01-04)
Answer: As a society, we have to make important choices about the economy tomorrow,
including space exploration. Do we want to journey to Mars? If so, how fast do we want to
9. What is the connection between North Korea’s missile program and its hunger problem?
(World View, p. 10) (LO 01-01
Answer: North Korea is a relatively small country: its population of 24 million ranks 40th in
10. Why might more reliance on markets rather than government be desirable? When and how
might it be undesirable? (LO 01-04)
Answer: Markets don’t require any direct contact between consumers and producers.
Problems
1. According to Table 1.1 (or Figure 1.1), what is the opportunity cost of the first truck
produced? (LO 01-01)
Answer: 0.5 tanks.
3
© 2016 by McGraw-Hill Education. This is proprietary material solely for authorized instructor use. Not authorized for sale or distribution in any
manner. This document may not be copied, scanned, duplicated, forwarded, distributed, or posted on a website, in whole or part.
2. (a) Compute the opportunity cost in forgone tanks for each additional truck produced:
Truck output 0 1 2 3 4 5
Tank output 5 4.5 3.8 3.0 2.0 0
Opportunity cost __ __ __ 0.8 __ __
(b) As truck output increases, are opportunity costs (A) increasing, (B) decreasing, or (C)
remaining constant? (LO 01-02)
Answers:
(a) Opportunity cost 0 0.5 0.7 0.8 1 2.
3. According to Figure 1.2 (p. 9), what is the opportunity cost of North Korea moving from
point P to point N (in terms of food output)? (LO 01-02)
4
© 2016 by McGraw-Hill Education. This is proprietary material solely for authorized instructor use. Not authorized for sale or distribution in any
manner. This document may not be copied, scanned, duplicated, forwarded, distributed, or posted on a website, in whole or part.
4. (a) What is the cost of the North Korean 2009 missile launch, according to South Korea (p.
10)?
(b) How many people could have been fed for an entire year at the World Bank standard of
$2 per day with that money? (LO 01-01)
Answers:
(a) Approximately $300 million.
5. What is the opportunity cost (in civilian output) of a defense buildup that raises military
spending from 4.0 to 4.3 percent of a $18 trillion economy? (LO 01-01)
6. What are the three core economic questions societies must answer? (LO 01-03)
7. According to Figure 1.4, (LO 01-02)
(a) At which point(s) is this society producing some of each type of output but still producing
inefficiently?
(b) At which point(s) is this society producing the most output possible with the available
resources and technology?
(c) At which point(s) is the output combination currently unattainable with current available
resources and technology?
(d) Show the change that would occur if the population of this society increased dramatically.
Label this curve PPC2.
5
© 2016 by McGraw-Hill Education. This is proprietary material solely for authorized instructor use. Not authorized for sale or distribution in any
manner. This document may not be copied, scanned, duplicated, forwarded, distributed, or posted on a website, in whole or part.
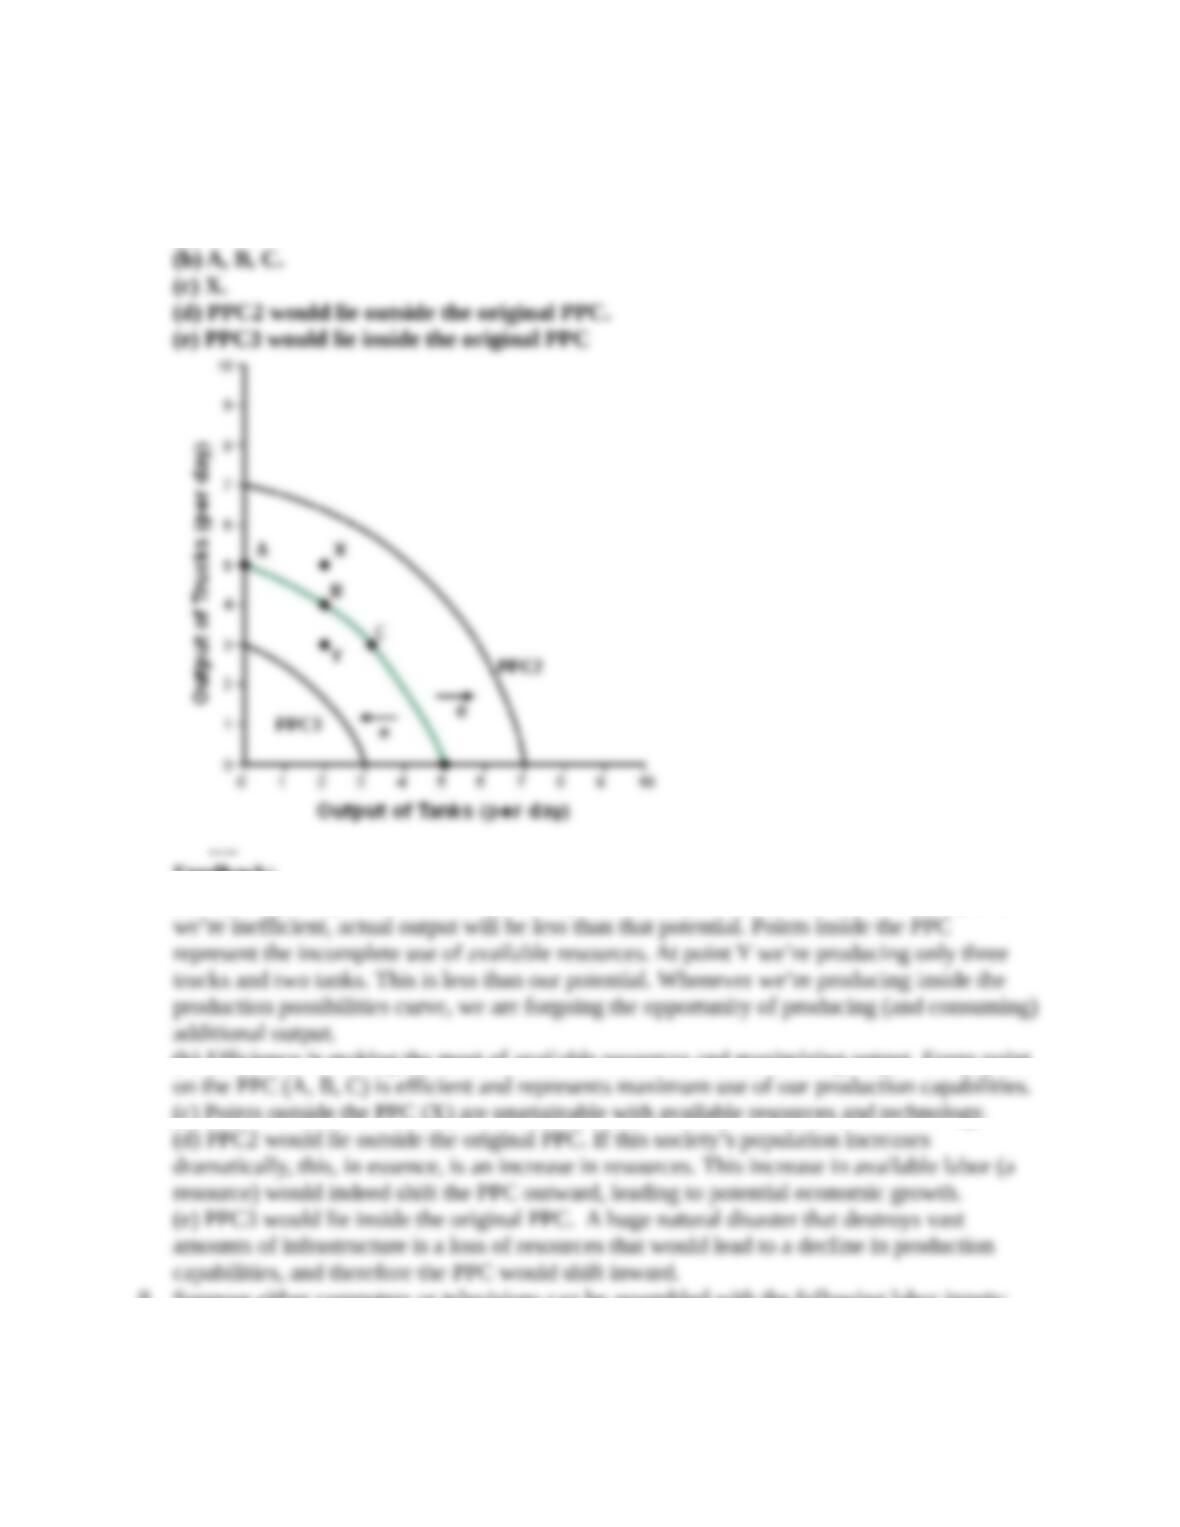
(e) Show the change that would occur with a huge natural disaster that destroyed vast
amounts of infrastructure. Label this curve PPC3.
Answers:
(a) Y.
Feedback:
(a) A production possibilities curve shows potential output, not necessarily actual output. If
(b) Efficiency is making the most of available resources and maximizing output. Every point
(c) Points outside the PPC (X) are unattainable with available resources and technology.
8. Suppose either computers or televisions can be assembled with the following labor inputs:
Units produced 1 2 3 4 5 6 7 8 9 10
Total labor used 3 7 12 18 25 33 42 54 70 90
6
© 2016 by McGraw-Hill Education. This is proprietary material solely for authorized instructor use. Not authorized for sale or distribution in any
manner. This document may not be copied, scanned, duplicated, forwarded, distributed, or posted on a website, in whole or part.
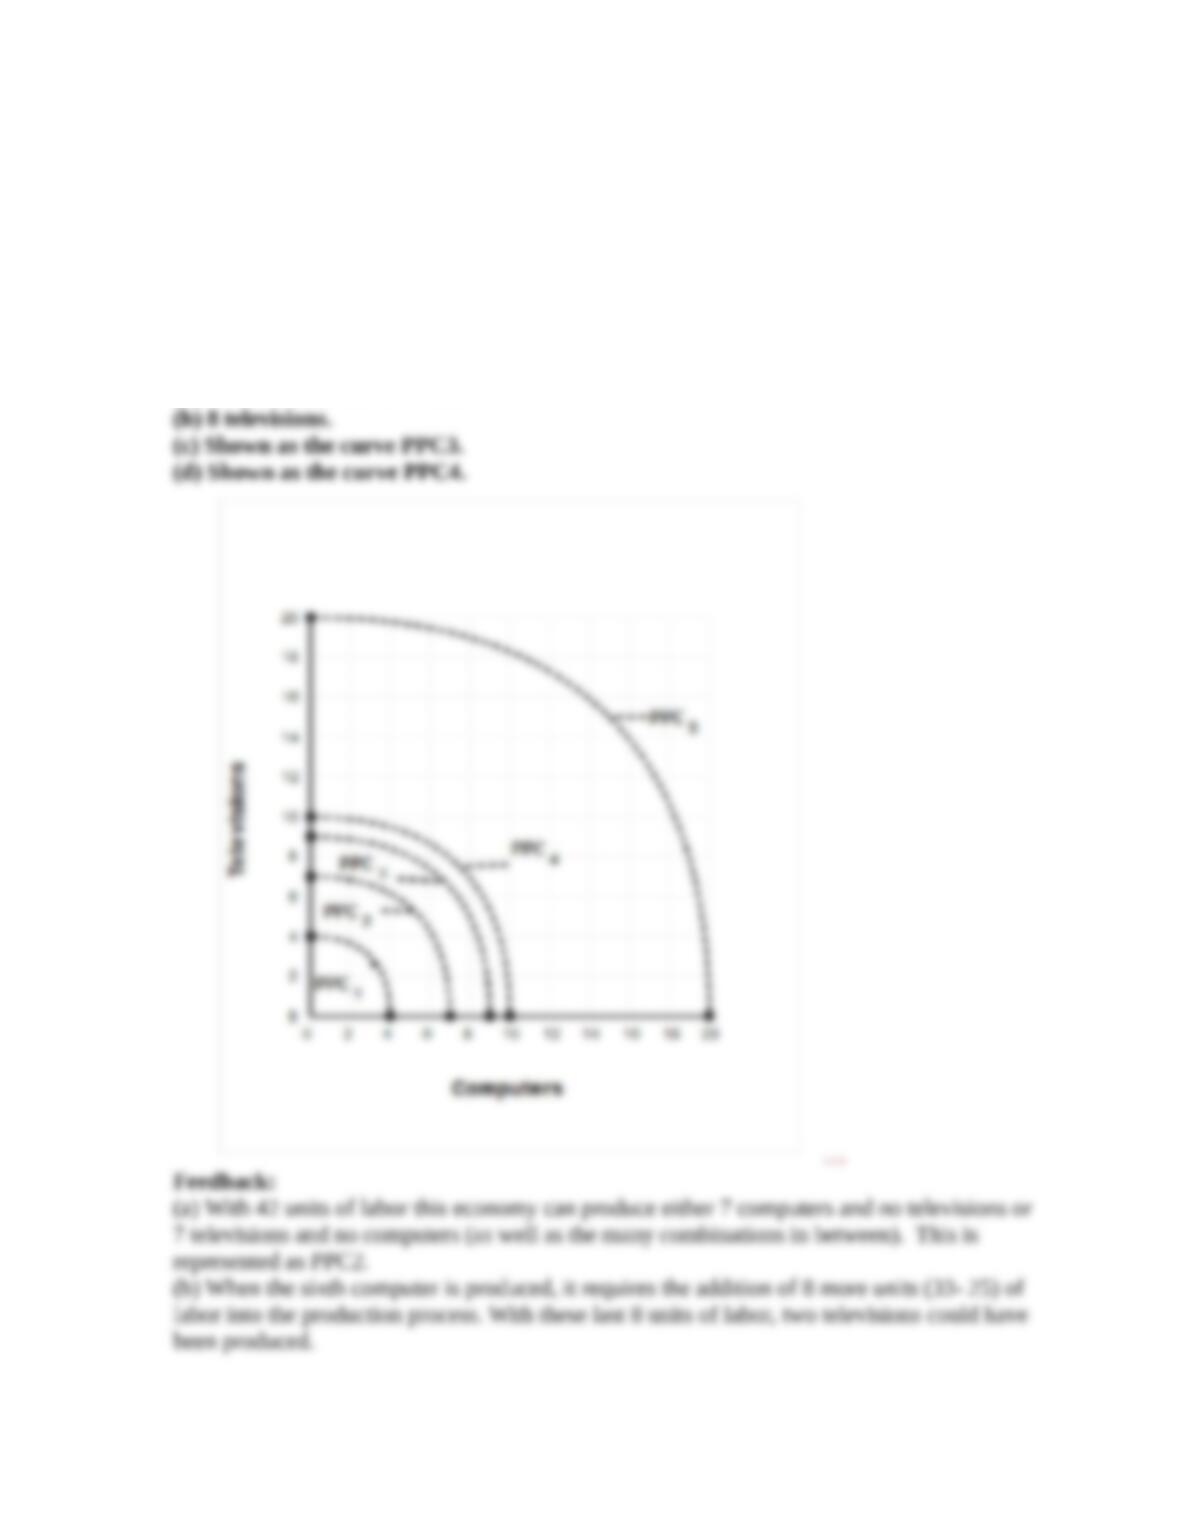
(a) Draw the production possibilities curve for an economy with 42 units of labor. Label it
P42.
(b) What is the opportunity cost of the sixth computer?
(c) Suppose immigration brings in 28 more workers. Redraw the production possibilities
curve to reflect this added labor. Label the new curve P70.
(d) Suppose advancing technology (e.g., the miniaturization of electronic circuits) increases
the productivity of the 70-laborer workforce by 10 percent. Draw a third production
possibilities curve (PT) to illustrate this change. (LO 01-02)
Answers:
(a) Shown as the curve PPC2.
7
© 2016 by McGraw-Hill Education. This is proprietary material solely for authorized instructor use. Not authorized for sale or distribution in any
manner. This document may not be copied, scanned, duplicated, forwarded, distributed, or posted on a website, in whole or part.
(c) If immigration brings in 28 more workers, this economy now has 70 units of labor
(d) If advancing technology increases the productivity of the 70-laborer workforce by 10
9. According to the World View on page 15, which nation has
(a) The highest level of faith in the market system?
(b) The lowest level of faith in the market system? (LO 01-04
Answers:
10. If a person literally had “nothing else to do,”
(a) What would be the opportunity cost of doing these problems?
(b) What is the likelihood of that? (LO 01-01)
Answers:
(a) Zero.
(b) Zero.
Feedback:
(a) Opportunity cost is what is given up to get something else. If a person literally had
11. Suppose there’s a relationship of the following sort between study time and grades:
(a) (b) (c) (d) (e)
____________________________________________________________________
Study time (hours per week) 0 2 6 12 20
Grade point average 0 1.0 2.0 3.0 4.0
If you have only 20 hours per week to use for either study time or fun time,
(a) Draw the (linear) production possibilities curve on the graph below that represents the
alternative uses of your time.
(b) Indicate on the graph the point C that would get you a 2.0 grade average.
(c) What is the cost, in lost fun time, of raising your grade point average from 2.0 to 3.0?
Illustrate this effort on the graph (point C to point D).
8
© 2016 by McGraw-Hill Education. This is proprietary material solely for authorized instructor use. Not authorized for sale or distribution in any
manner. This document may not be copied, scanned, duplicated, forwarded, distributed, or posted on a website, in whole or part.
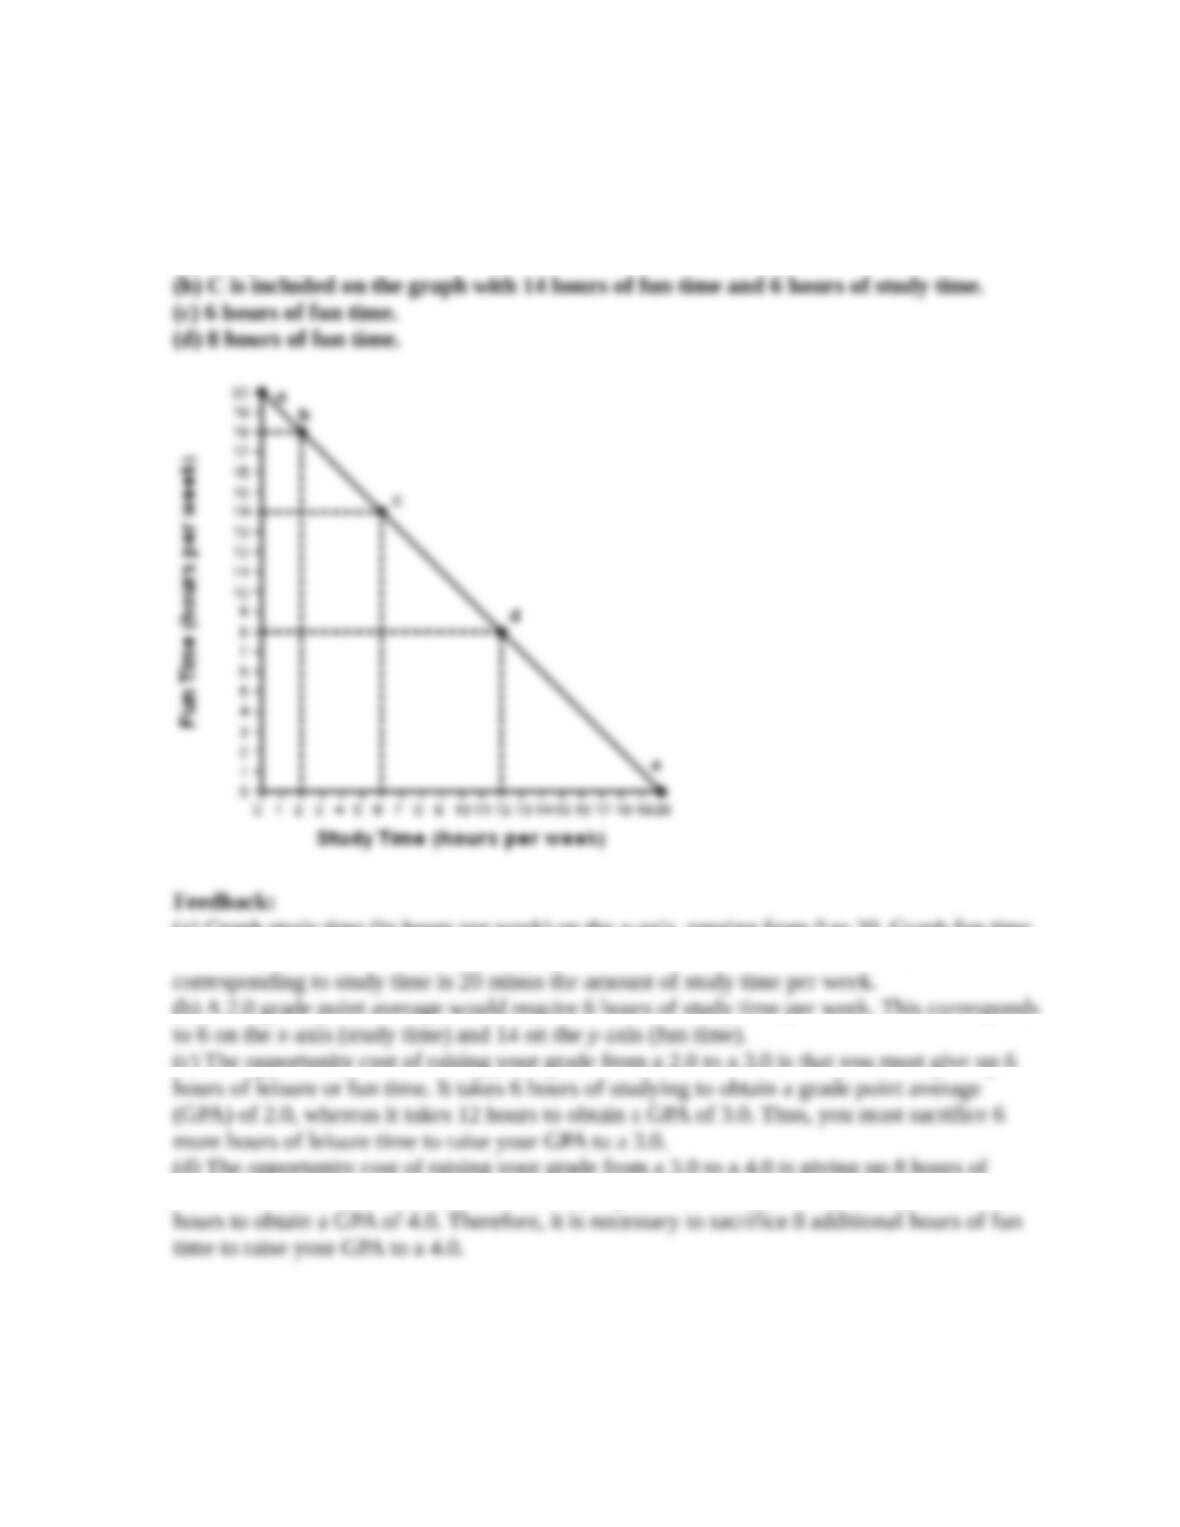
(d) What is the opportunity cost of increasing your grade point average from 3.0 to 4.0?
Illustrate as point D to E. (LO 01-02)
Answers:
(a) Graph is provided.
(a) Graph study time (in hours per week) on the x-axis, ranging from 0 to 20. Graph fun time
(in hours per week) on the y-axis, ranging from 0 to 20. The amount of fun time
(b) A 2.0 grade point average would require 6 hours of study time per week. This corresponds
(c) The opportunity cost of raising your grade from a 2.0 to a 3.0 is that you must give up 6
(d) The opportunity cost of raising your grade from a 3.0 to a 4.0 is giving up 8 hours of
leisure or fun time. It takes 12 hours of studying to obtain a GPA of 3.0, whereas it takes 20
9
© 2016 by McGraw-Hill Education. This is proprietary material solely for authorized instructor use. Not authorized for sale or distribution in any
manner. This document may not be copied, scanned, duplicated, forwarded, distributed, or posted on a website, in whole or part.