CHAPTER 3 B – 1
CHAPTER 3
FINANCIAL STATEMENTS ANALYSIS
AND LONG-TERM PLANNING
Answers to Concept Questions
1. Time trend analysis gives a picture of changes in the company’s financial situation over time.
Comparing a firm to itself over time allows the financial manager to evaluate whether some aspects
of the firm’s operations, finances, or investment activities have changed. Peer group analysis involves
comparing the financial ratios and operating performance of a particular firm to a set of peer group
firms in the same industry or line of business. Comparing a firm to its peers allows the financial
manager to evaluate whether some aspects of the firm’s operations, finances, or investment activities
2. If a company is growing by opening new stores, then presumably total revenues would be rising.
3. The reason is that, ultimately, sales are the driving force behind a business. A firm’s assets, employees,
and, in fact, just about every aspect of its operations and financing exist to directly or indirectly support
4. Two assumptions of the sustainable growth formula are that the company does not want to sell new
equity, and that financial policy is fixed. If the company raises outside equity, or increases its debt–
5. The sustainable growth rate is greater than 20 percent, because at a 20 percent growth rate the negative
EFN indicates that there is excess financing still available. If the firm is 100 percent equity financed,
then the sustainable and internal growth rates are equal and the internal growth rate would be greater
CHAPTER 3 B – 2
6. Common-size financial statements provide the financial manager with a ratio analysis of the company.
The common-size income statement can show, for example, that cost of goods sold as a percentage of
7. It would reduce the external funds needed. If the company is not operating at full capacity, it would
be able to increase sales without a commensurate increase in fixed assets.
8. Presumably not, but, of course, if the product had been much less popular, then a similar fate would
9. Since customers did not pay until shipment, receivables rose. The firm’s NWC, but not its cash,
11. All three were important, but the lack of cash or, more generally, financial resources ultimately spelled
14. The EBITDA/Assets ratio shows the company’s operating performance before interest, depreciation,
and taxes. This ratio would show how a company has controlled costs. While taxes are a cost, and
interest and depreciation can be considered costs, they are not as easily controlled by company
Solutions to Questions and Problems
CHAPTER 3 B – 3
1. Using the DuPont identity, the ROE is:
ROE = (PM)(TAT)(EM)
2. The equity multiplier is:
EM = 1 + D/E
One formula to calculate return on equity is:
ROE = (ROA)(EM)
ROE can also be calculated as:
ROE = NI/TE
So, net income is:
NI = ROE(TE)
3. This is a multi-step problem involving several ratios. The ratios given are all part of the DuPont
identity. The only DuPont identity ratio not given is the profit margin. If we know the profit margin,
we can find the net income since sales are given. So, we begin with the DuPont identity:
ROE = .15 = (PM)(TAT)(EM) = (PM)(S/TA)(1 + D/E)
Solving the DuPont identity for profit margin, we get:
Now that we have the profit margin, we can use this number and the given sales figure to solve for net
income:
4. An increase of sales to $50,310 is an increase of:
Sales increase = ($50,310 – 43,000)/$43,000
CHAPTER 3 B – 4
Sales increase = .17, or 17%
Assuming costs and assets increase proportionally, the pro forma financial statements will look like
this:
Pro forma income statement Pro forma balance sheet
Sales $50,310.00 Assets $ 122,265 Debt $ 28,200.00
Costs 35,334.00 Equity 83,142.16
The addition to retained earnings is:
Addition to retained earnings = $9,884.16 – 3,042
Addition to retained earnings = $6,842.16
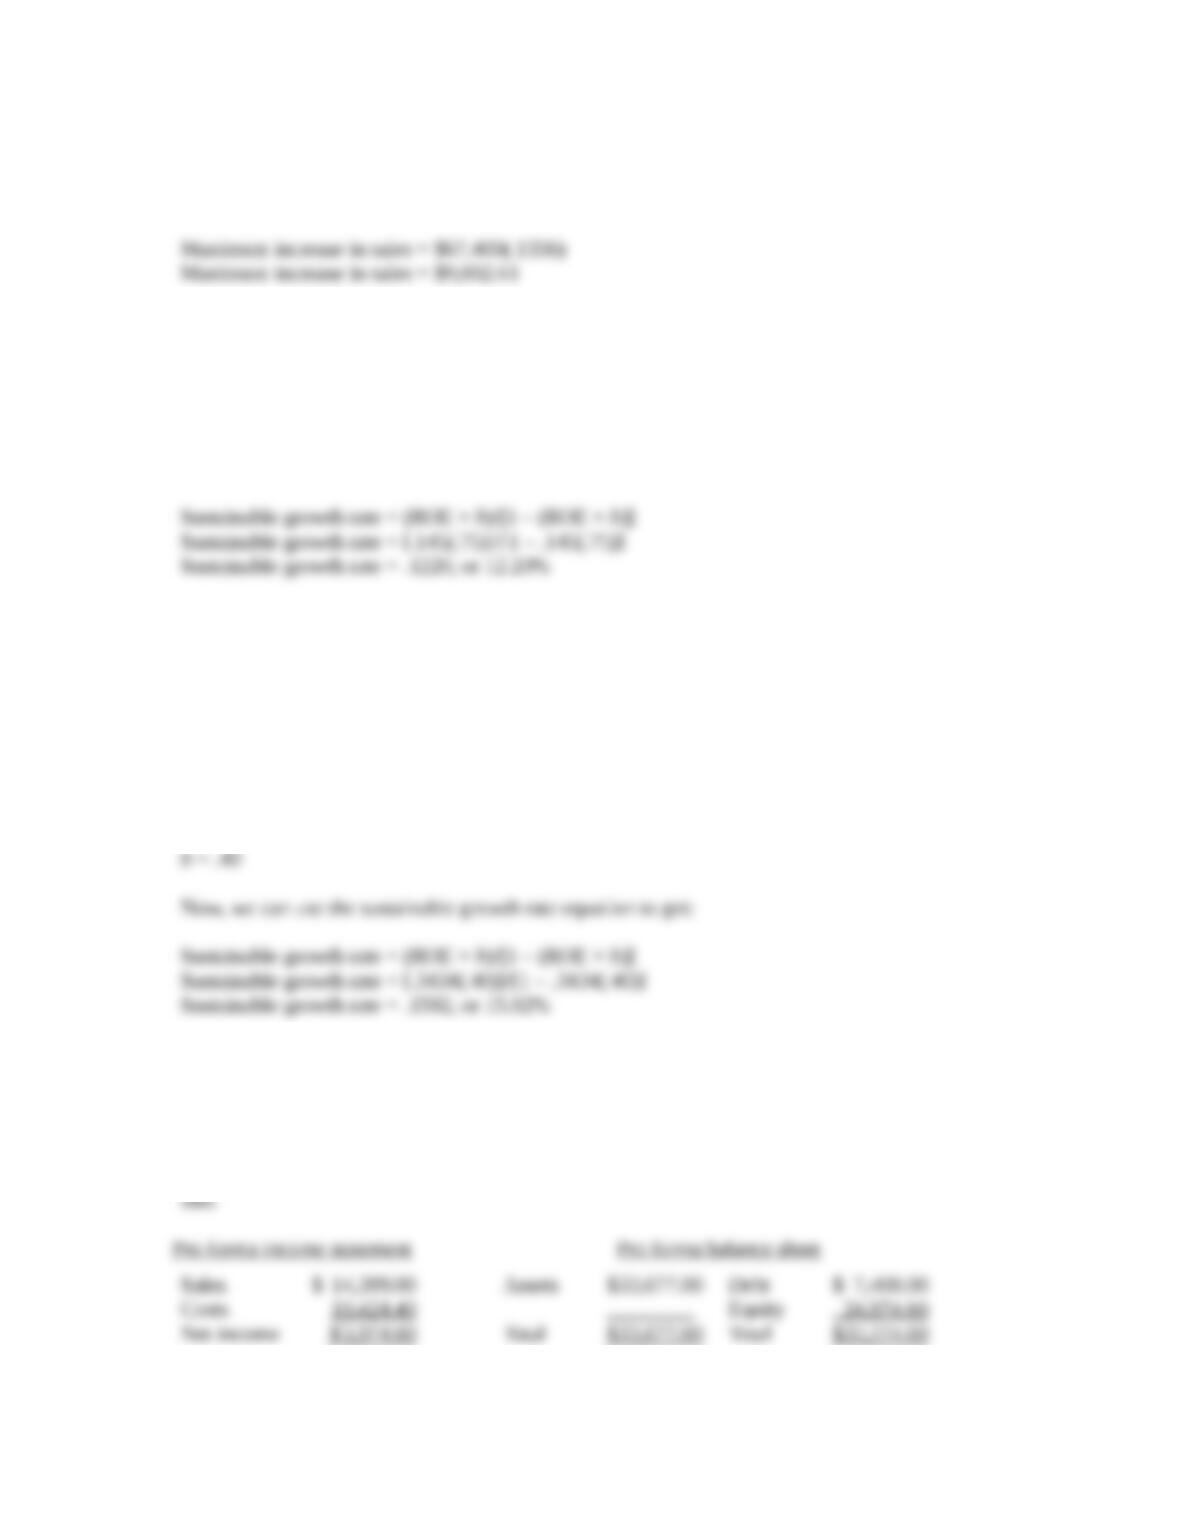
5. The maximum percentage sales increase is the sustainable growth rate. To calculate the sustainable
growth rate, we first need to calculate the ROE, which is:
ROE = Net income/Total equity
ROE = $18,348/$109,000
Sustainable growth rate = .1336, or 13.36%
CHAPTER 3 B – 5
So, the maximum dollar increase in sales is:
Maximum increase in sales = $67,400(.1336)
6. We need to calculate the retention ratio to calculate the sustainable growth rate. The retention ratio is:
b = 1 – .25
b = .75
Now we can use the sustainable growth rate equation to get:
Sustainable growth rate = (ROE × b)/[1 – (ROE × b)]
ROE is:
ROE = (PM)(TAT)(EM)
ROE = (.074)(3.20)(1.45)
ROE = .3434, or 34.34%
The plowback ratio is one minus the dividend payout ratio, so:
b = 1 – .60
b = .40
Sales increase = ($14,399 – 12,100)/$12,100
Sales increase = .19, or 19%
Assuming costs and assets increase proportionally, the pro forma financial statements will look like
this:
CHAPTER 3 B – 6
Equity = $20,900 + 3,974.60
Equity = $24,874.60
So the EFN is:
sales divided by one plus the growth rate, so:
Current sales = Next year’s sales/(1 + g)
Current sales = $211,600,000/(1 + .15)
Current sales = $184,000,000
And the change in sales is:
Change in sales = $211,600,000 – 184,000,000
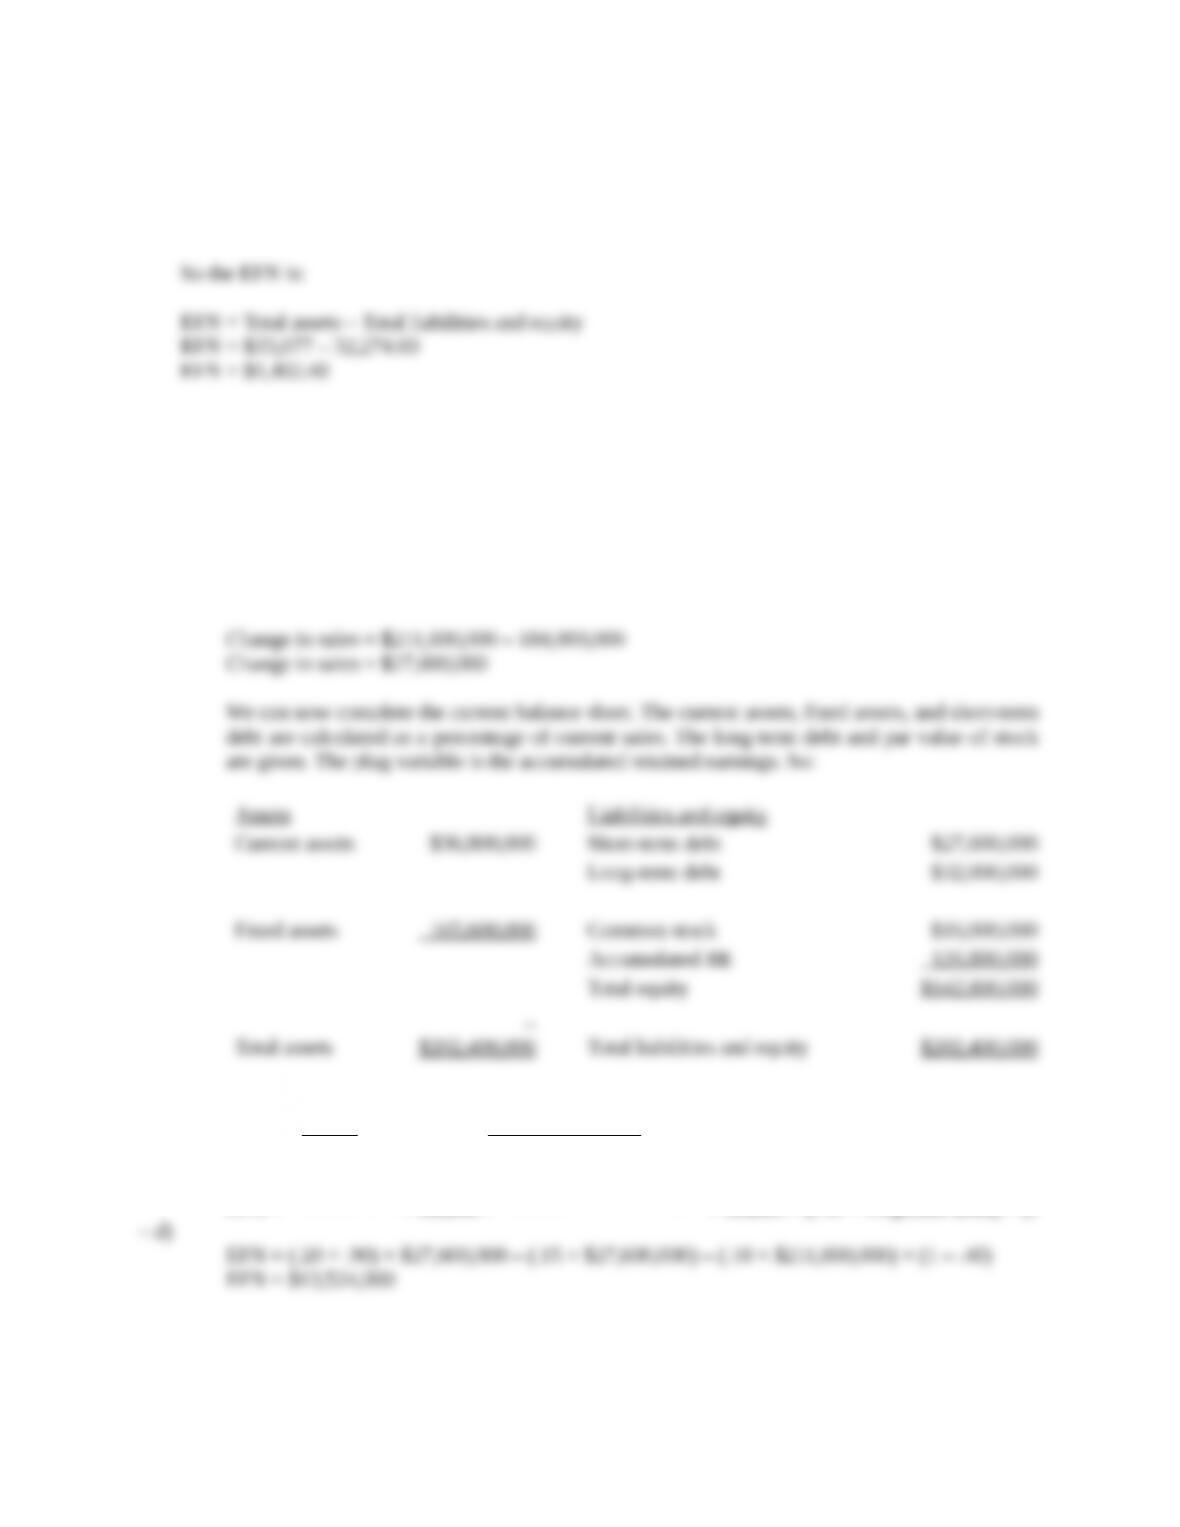
the percentages given in the problem, so:
EFN =
Sales
Assets
× ΔSales –
Sales
debt sSpontaneou
× ΔSales – (PM × Projected sales) × (1 – d)
EFN = (.20 + .90) × $27,600,000 – (.15 × $27,600,000) – (.10 × $211,600,000) × (1 – .40)
EFN = $13,524,000
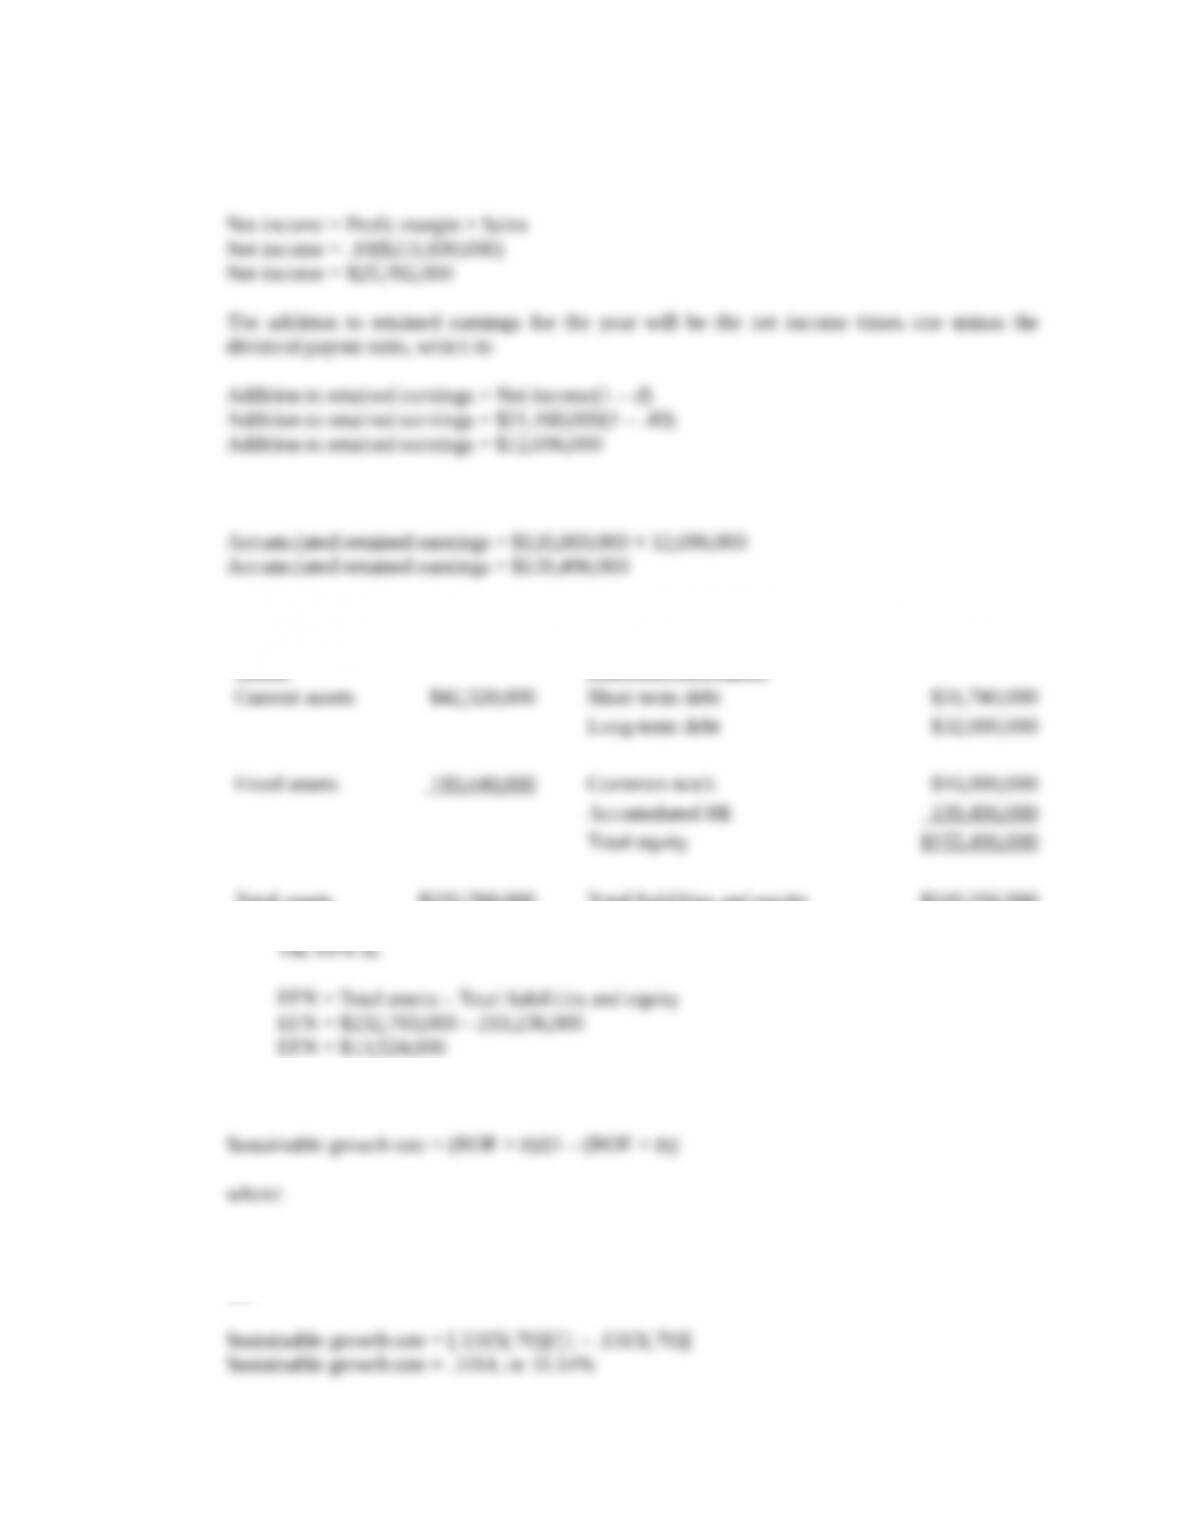
come for the year as:
Net income = Profit margin × Sales
CHAPTER 3 B – 7
Net income = .10($211,600,000)
Net income = $25,392,000
Accumulated retained earnings = $139,496,000
Assets
Liabilities and equity
Current assets
$42,320,000
Short-term debt
$31,740,000
Long-term debt
$32,000,000
Fixed assets
190,440,000
Common stock
$16,000,000
Accumulated RE
139,496,000
Total equity
$155,496,000
Total assets
$232,760,000
Total liabilities and equity
$219,236,000
The EFN is:
EFN = Total assets – Total liabilities and equity
EFN = $232,760,000 – 219,236,000
where:
Sustainable growth rate = [.1315(.70)]/[1 – .1315(.70)]
Sustainable growth rate = .1014, or 10.14%
CHAPTER 3 B – 8
the sustainable growth rate includes ROE in the calculation, this also implies that changes in the
profit margin, total asset turnover, or equity multiplier will affect the sustainable growth rate.
Decrease its total assets/sales ratio; in other words, utilize its assets more efficiently.
Reduce the dividend payout ratio.
Intermediate
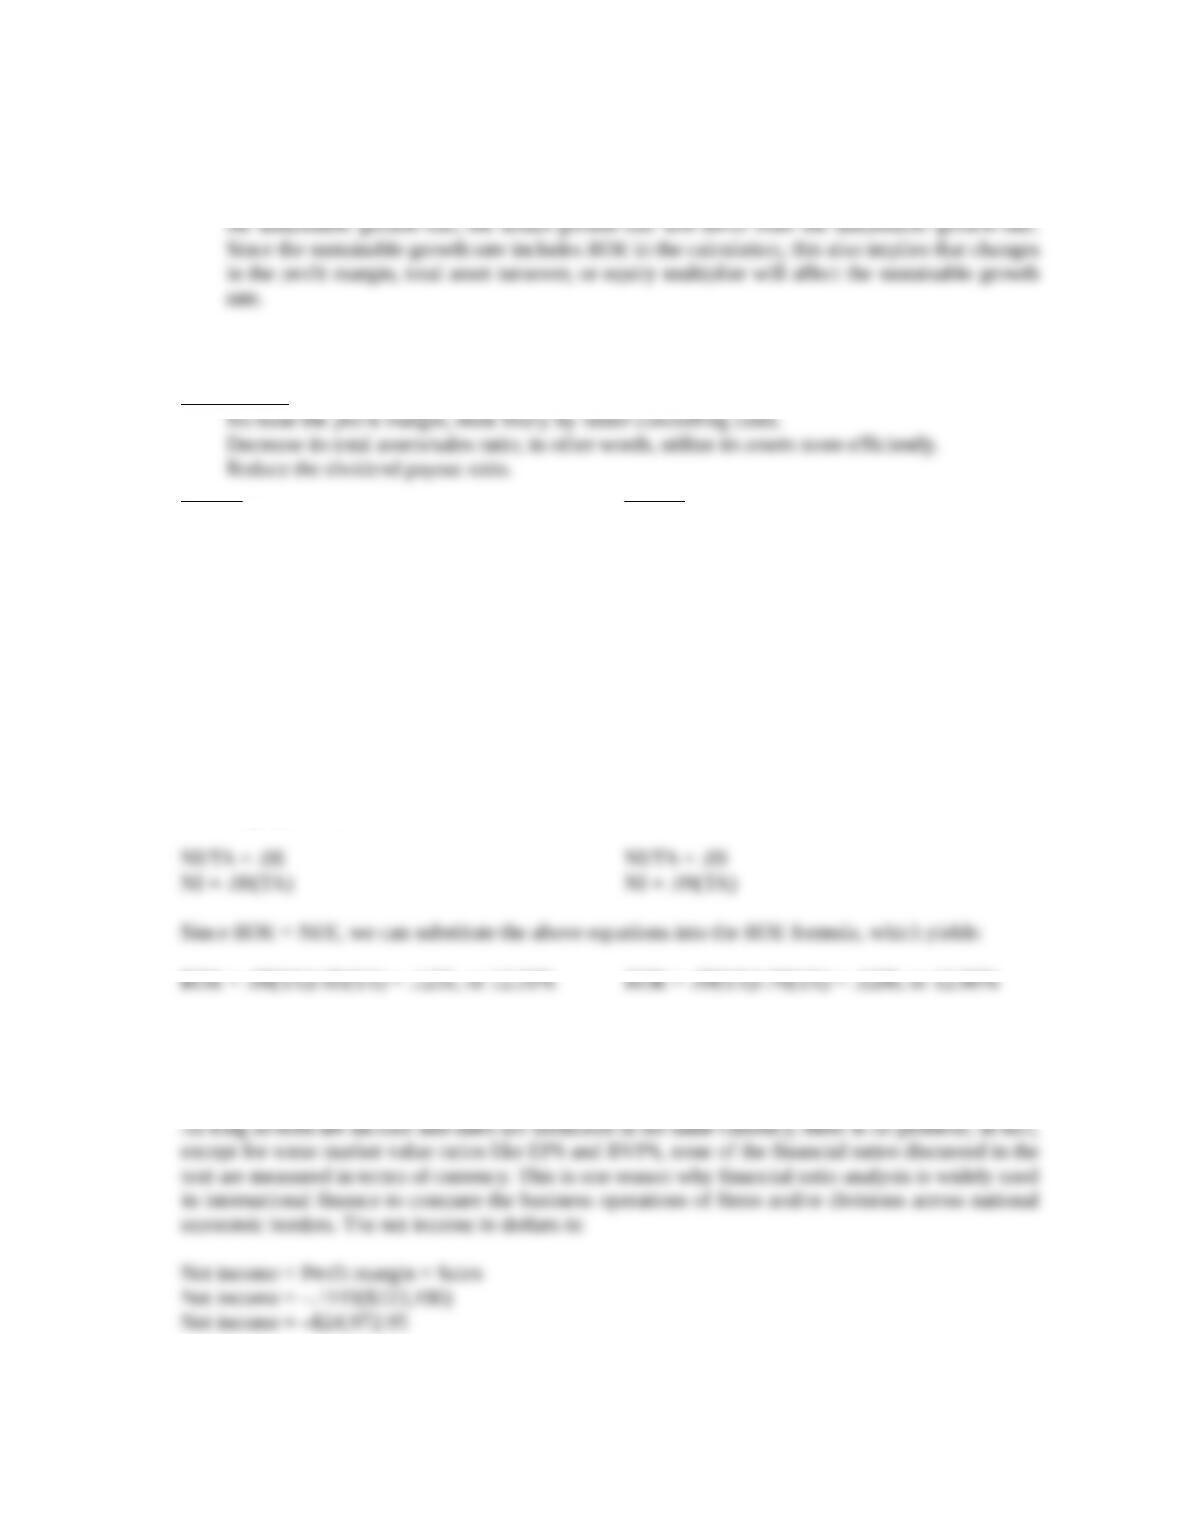
D/TA = .35 D/TA = .30
(TA – E)/TA = .35 (TA – E)/TA = .30
(TA/TA) – (E/TA) = .35 (TA/TA) – (E/TA) = .30
1 – (E/TA) = .35 1 – (E/TA) = .30
E/TA = .65 E/TA = .70
E = .65(TA) E = .70(TA)
Rearranging ROA, we find:
NI/TA = .08 NI/TA = .09
NI = .08(TA) NI = .09(TA)
Since ROE = NI/E, we can substitute the above equations into the ROE formula, which yields:
As long as both net income and sales are measured in the same currency, there is no problem; in fact,
except for some market value ratios like EPS and BVPS, none of the financial ratios discussed in the
text are measured in terms of currency. This is one reason why financial ratio analysis is widely used
in international finance to compare the business operations of firms and/or divisions across national
economic borders. The net income in dollars is: