CHAPTER 3 C-1
CHAPTER 3
RATIOS AND FINANCIAL PLANNING AT
EAST COAST YACHTS
1. Preferred stock has features of both debt and equity. Preferred shareholders receive a stated dividend,
and, if the corporation is liquidated, preferred shareholders get a stated value. Often, preferred stocks
carry credit ratings much like those of bonds. Furthermore, preferred stock is sometimes convertible
into common stock, and preferred stocks are often callable.
In addition, many issues of preferred stock have obligatory sinking funds. The existence of such a
of the total equity, it will make little difference in this case.
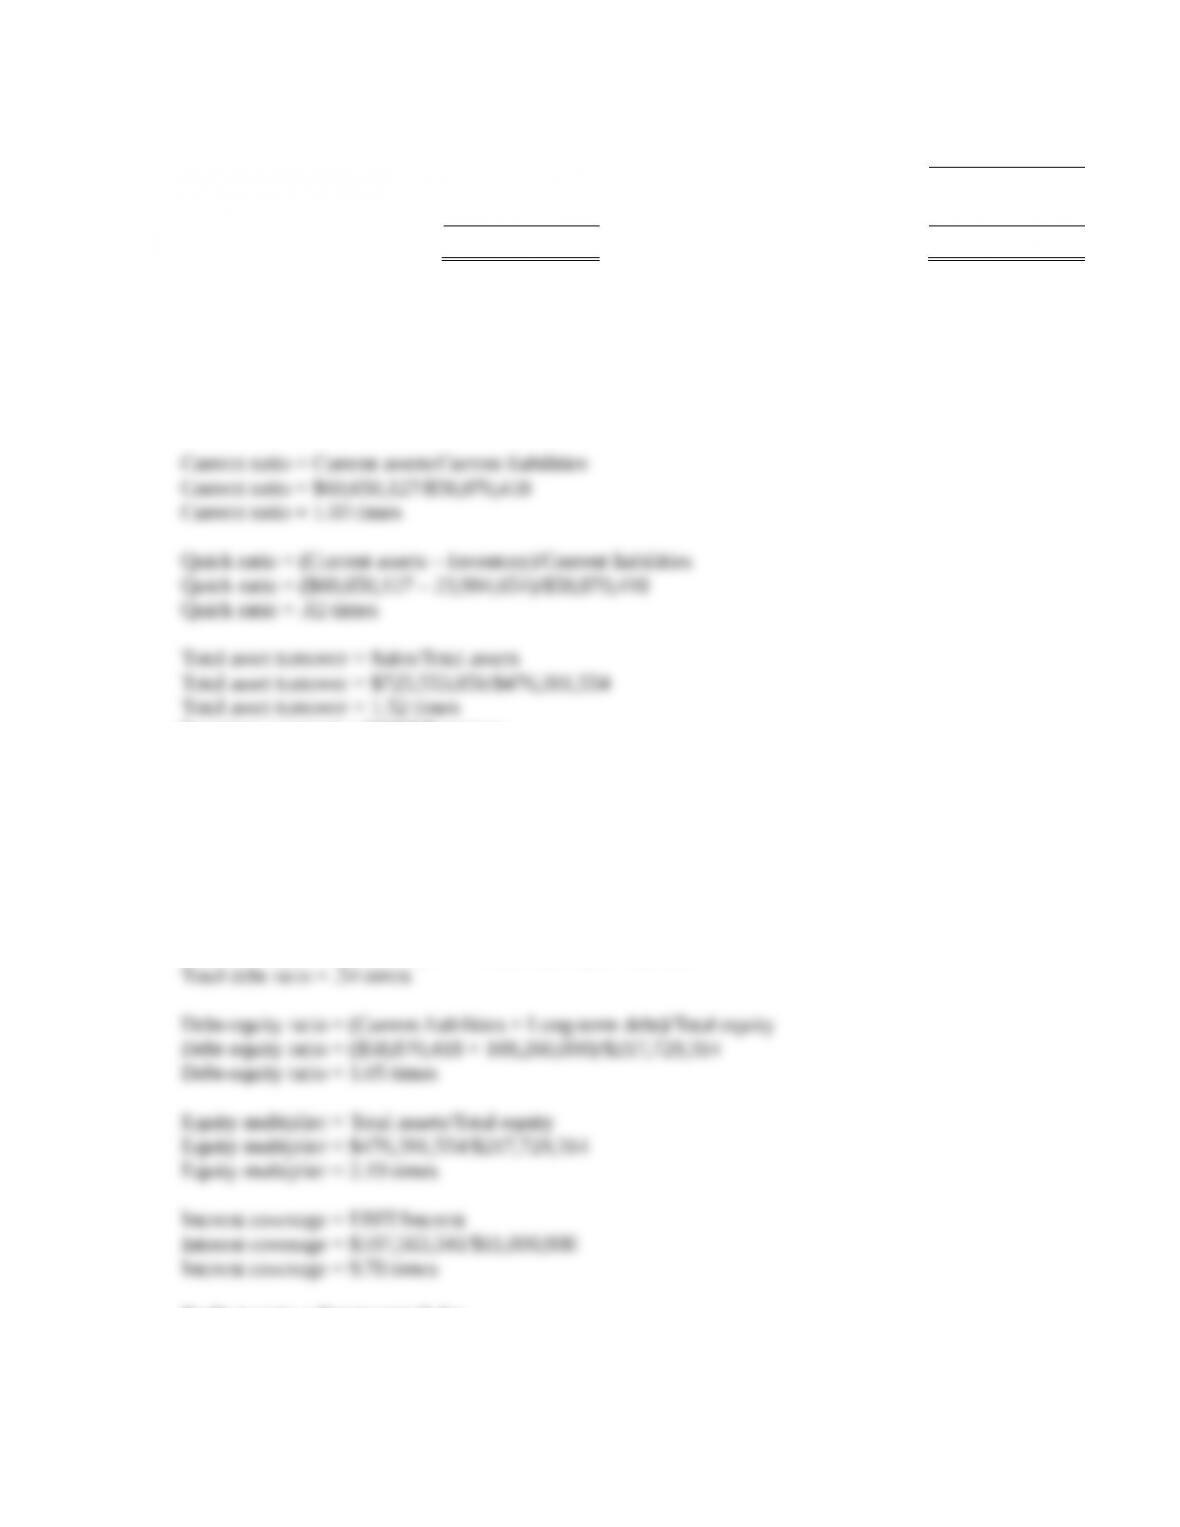
2. The calculations for the ratios listed are:
Current ratio = Current assets/Current liabilities
Current ratio = $51,123,050/$50,584,750
Current ratio = 1.01 times
Quick ratio = (Current assets – Inventory)/Current liabilities
Quick ratio = ($51,123,050 – 20,149,650)/$50,584,750
Quick ratio = .61 times
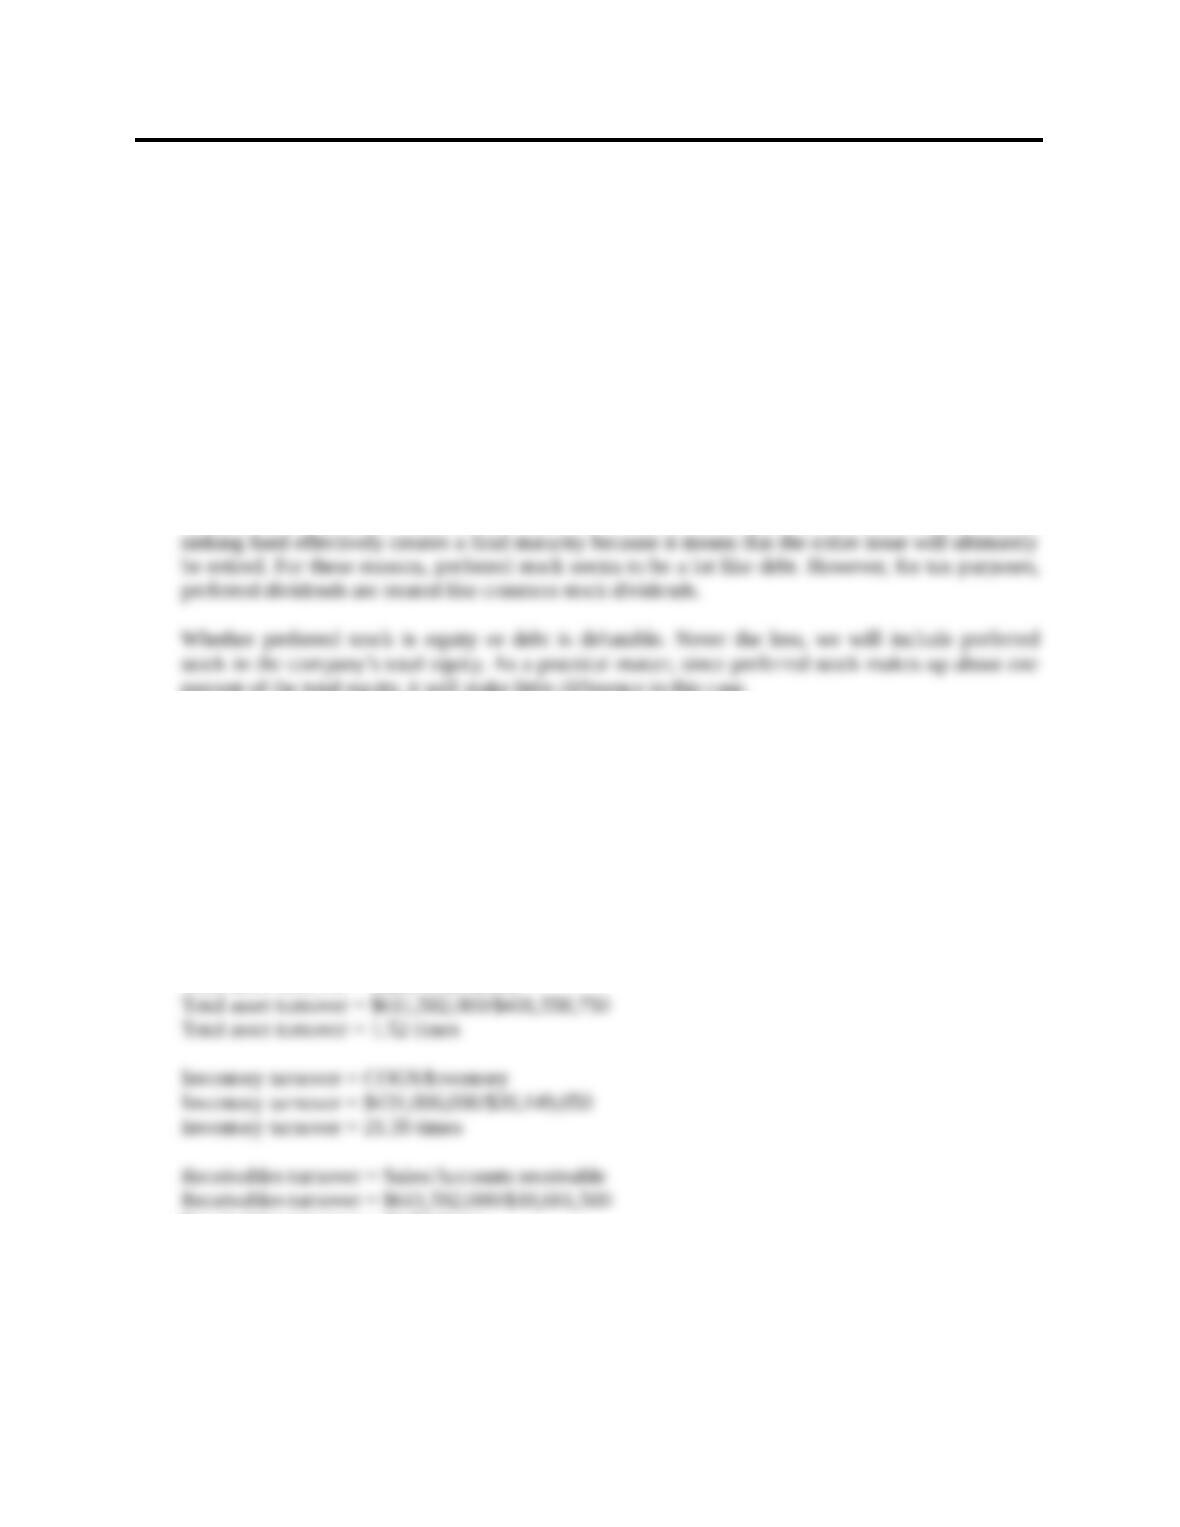
Total asset turnover = Sales/Total assets
Receivables turnover = 32.74 times
Total debt ratio = (Total assets – Total equity)/Total assets
Total debt ratio = ($401,558,750 – 181,714,000)/$401,558,750
Total debt ratio = .55 times
CHAPTER 3 C-2
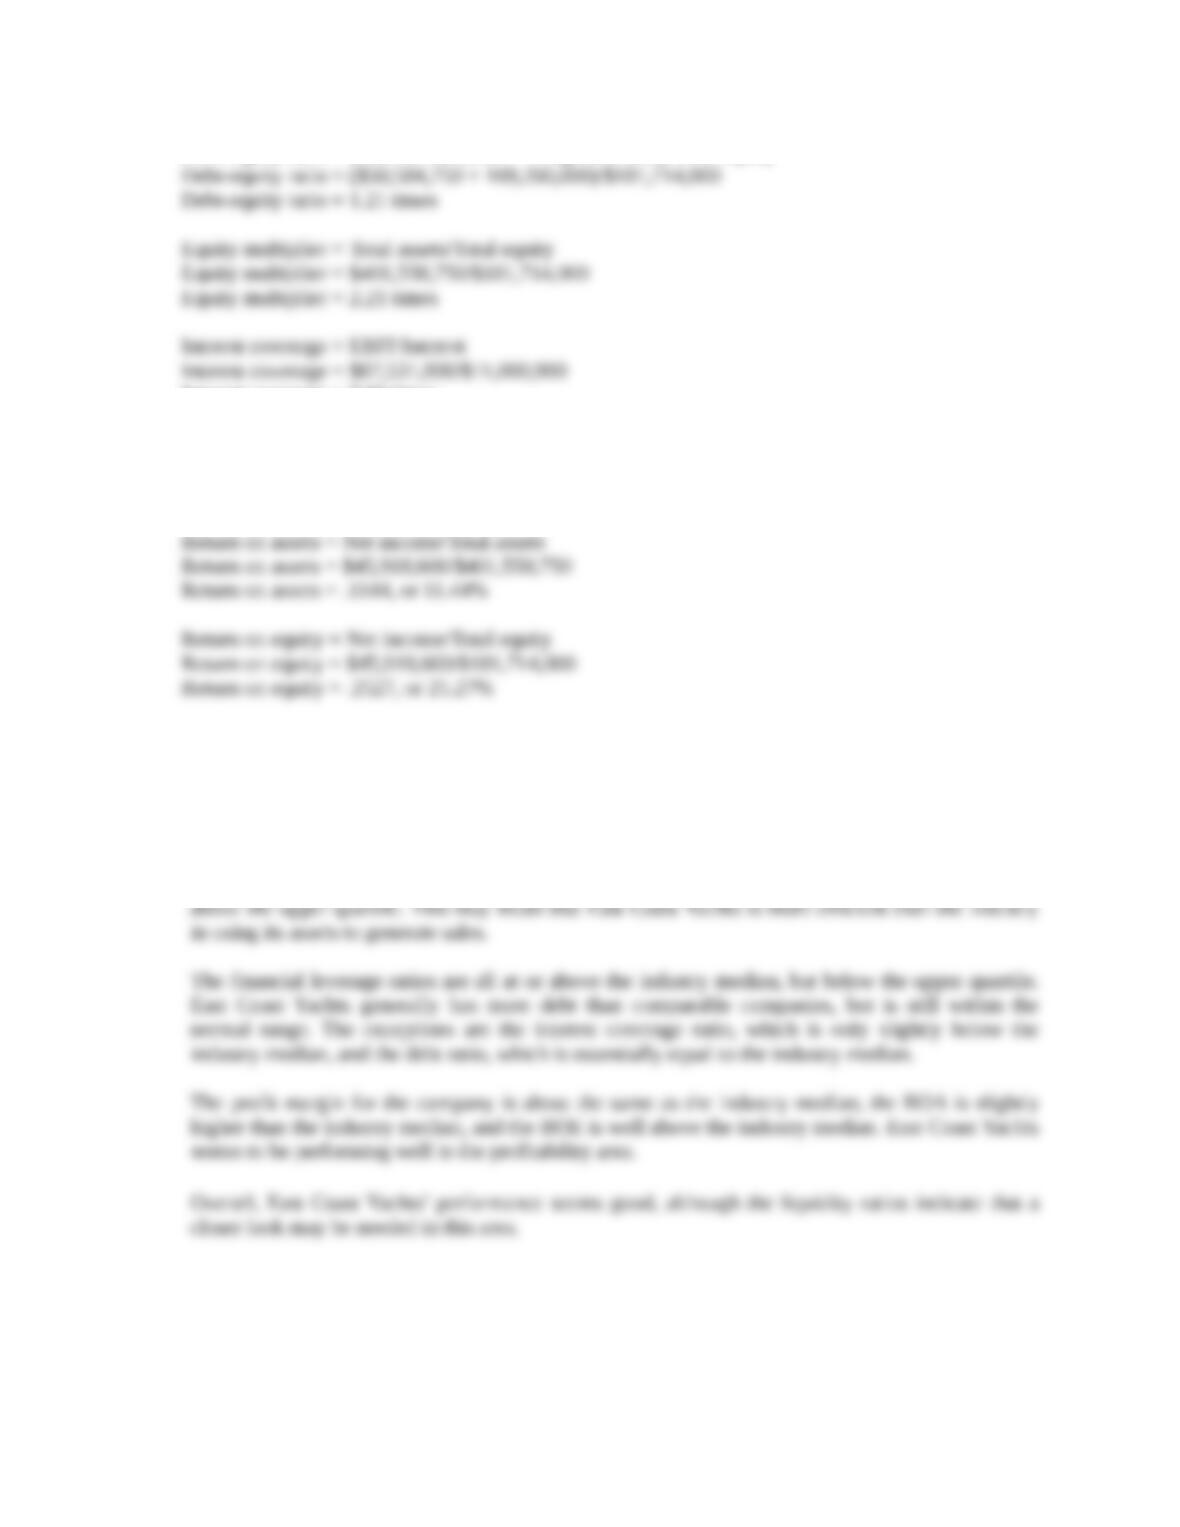
Debt-equity ratio = (Current liabilities + Long-term debt)/Total equity
Interest coverage = 7.96 times
Profit margin = Net income/Sales
Profit margin = $45,918,600/$611,582,000
Profit margin = .0751, or 7.51%
3. Regarding the liquidity ratios, East Coast Yachts’ current ratio is below the median industry ratio.
This implies the company has less liquidity than the industry in general. However, the current ratio
is above the lower quartile, so there are companies in the industry with lower liquidity than East Coast
Yachts. The company may have more predictable cash flows, or more access to short-term borrowing.
The turnover ratios are all higher than the industry median; in fact, all three turnover ratios are above
the upper quartile. This may mean that East Coast Yachts is more efficient than the industry in using
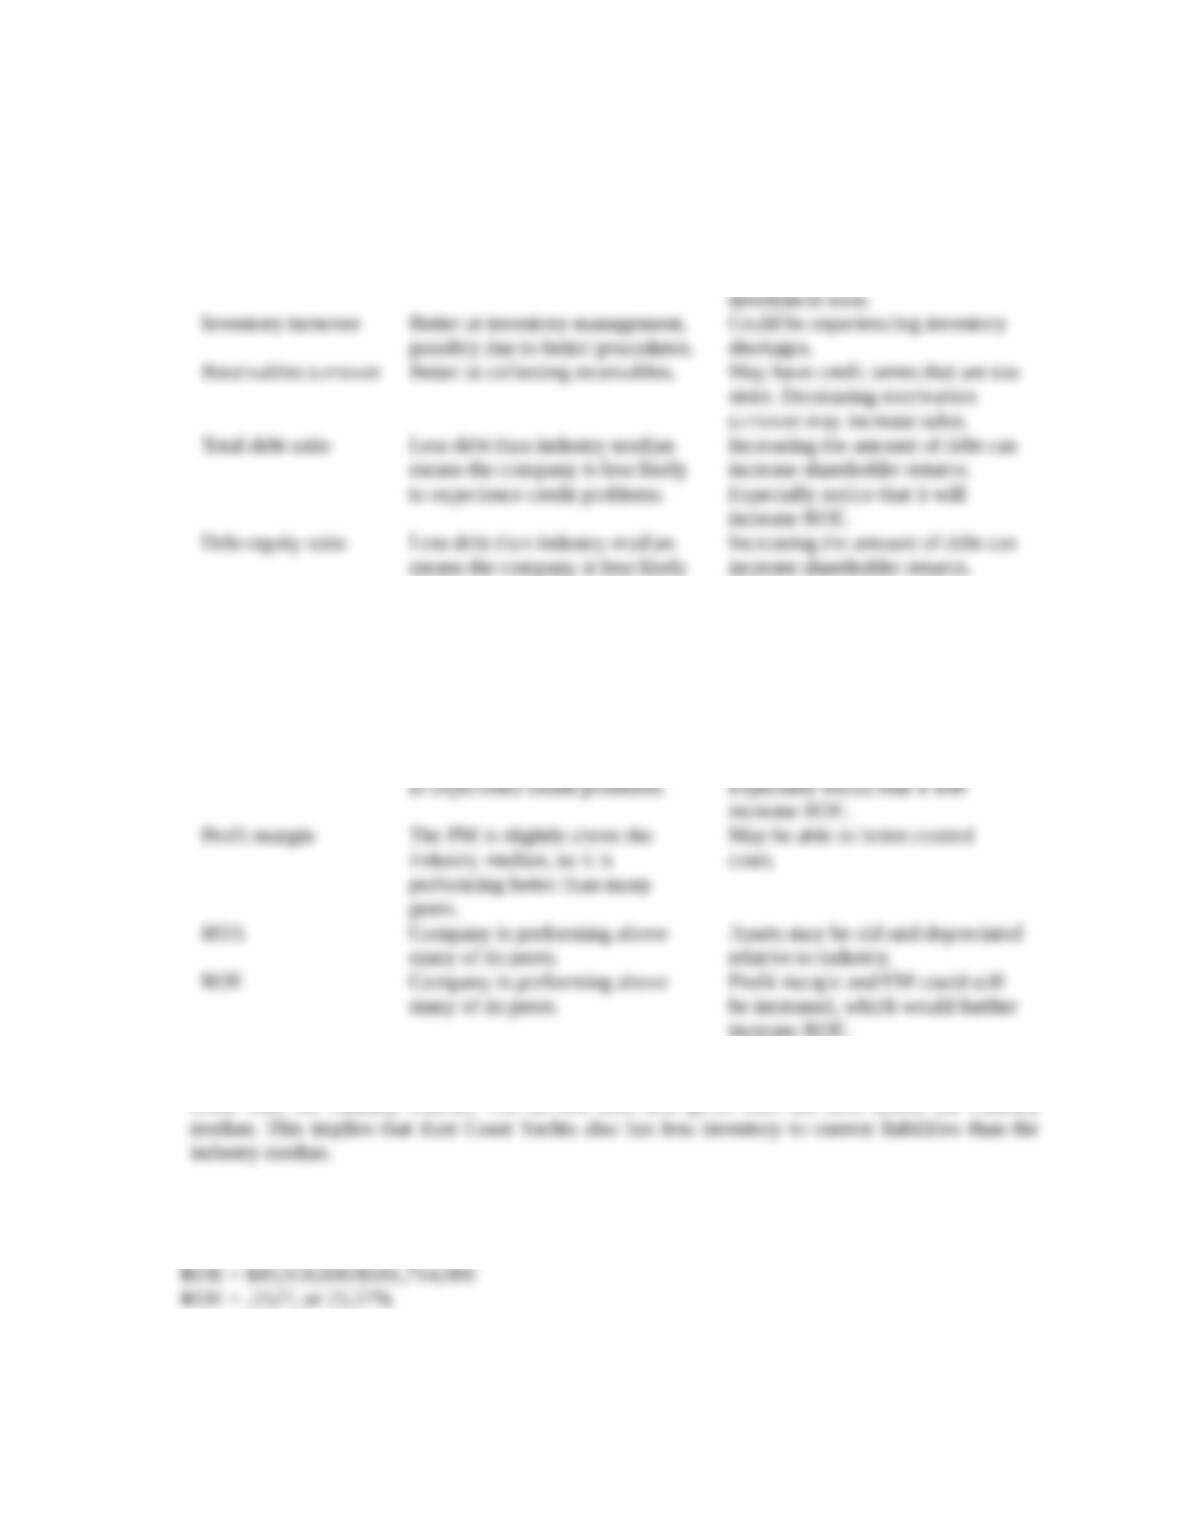
Below is a list of possible reasons why it may be good or bad that each ratio is higher or lower than
the industry. Note that the list is not exhaustive, but merely one possible explanation for each ratio.
Ratio
Good
Bad
CHAPTER 3 C-3
Current ratio
Better at managing current
accounts.
May be having liquidity problems.
Quick ratio
Better at managing current
accounts.
May be having liquidity problems.
Total asset turnover
Better at utilizing assets.
Assets may be older and
depreciated, requiring extensive
investment soon.
Inventory turnover
Better at inventory management,
possibly due to better procedures.
Could be experiencing inventory
shortages.
Receivables turnover
Better at collecting receivables.
May have credit terms that are too
strict. Decreasing receivables
turnover may increase sales.
Total debt ratio
Less debt than industry median
means the company is less likely
to experience credit problems.
Increasing the amount of debt can
increase shareholder returns.
Especially notice that it will
increase ROE.
Debt-equity ratio
Less debt than industry median
means the company is less likely
to experience credit problems.
Increasing the amount of debt can
increase shareholder returns.
Especially notice that it will
increase ROE.
Equity multiplier
Less debt than industry median
means the company is less likely
to experience credit problems.
Increasing the amount of debt can
increase shareholder returns.
Especially notice that it will
increase ROE.
Interest coverage
Less debt than industry median
means the company is less likely
to experience credit problems.
Increasing the amount of debt can
increase shareholder returns.
Especially notice that it will
increase ROE.
Profit margin
The PM is slightly above the
industry median, so it is
performing better than many
peers.
May be able to better control
costs.
ROA
Company is performing above
many of its peers.
Assets may be old and depreciated
relative to industry.
ROE
Company is performing above
many of its peers.
Profit margin and EM could still
be increased, which would further
increase ROE.
If you created an Inventory to Current liabilities ratio, East Coast Yachts would have a ratio that is
lower than the industry median. The current ratio and quick ratio are both below the industry median.
4. To calculate the sustainable growth rate, we first need to find the ROE and the retention ratio, so:
ROE = NI/TE
b = Addition to RE/NI
CHAPTER 3 C-4
b = $28,544,100/$45,918,600
b = .62, or 62%
So, the sustainable growth rate is:
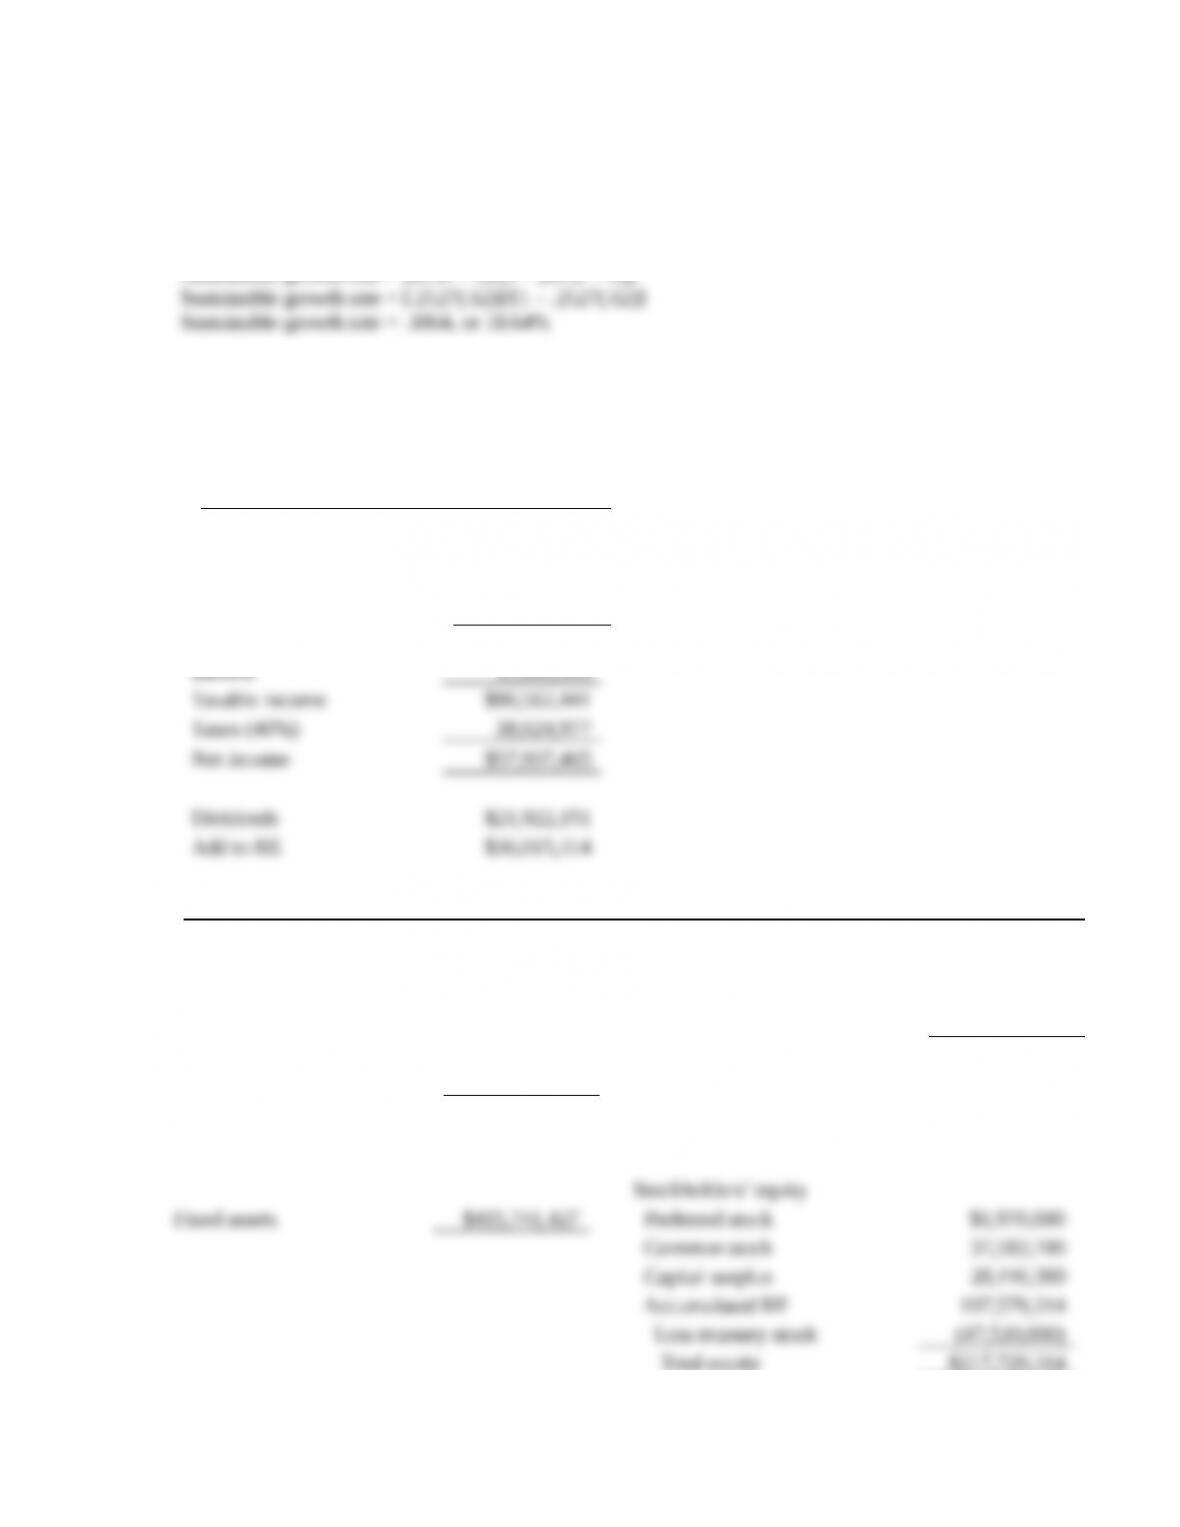
Sustainable growth rate = (ROE × b)/[1 – (ROE × b)]
The sustainable growth rate is the growth rate the company can achieve with no external financing
while maintaining a constant debt-equity ratio.
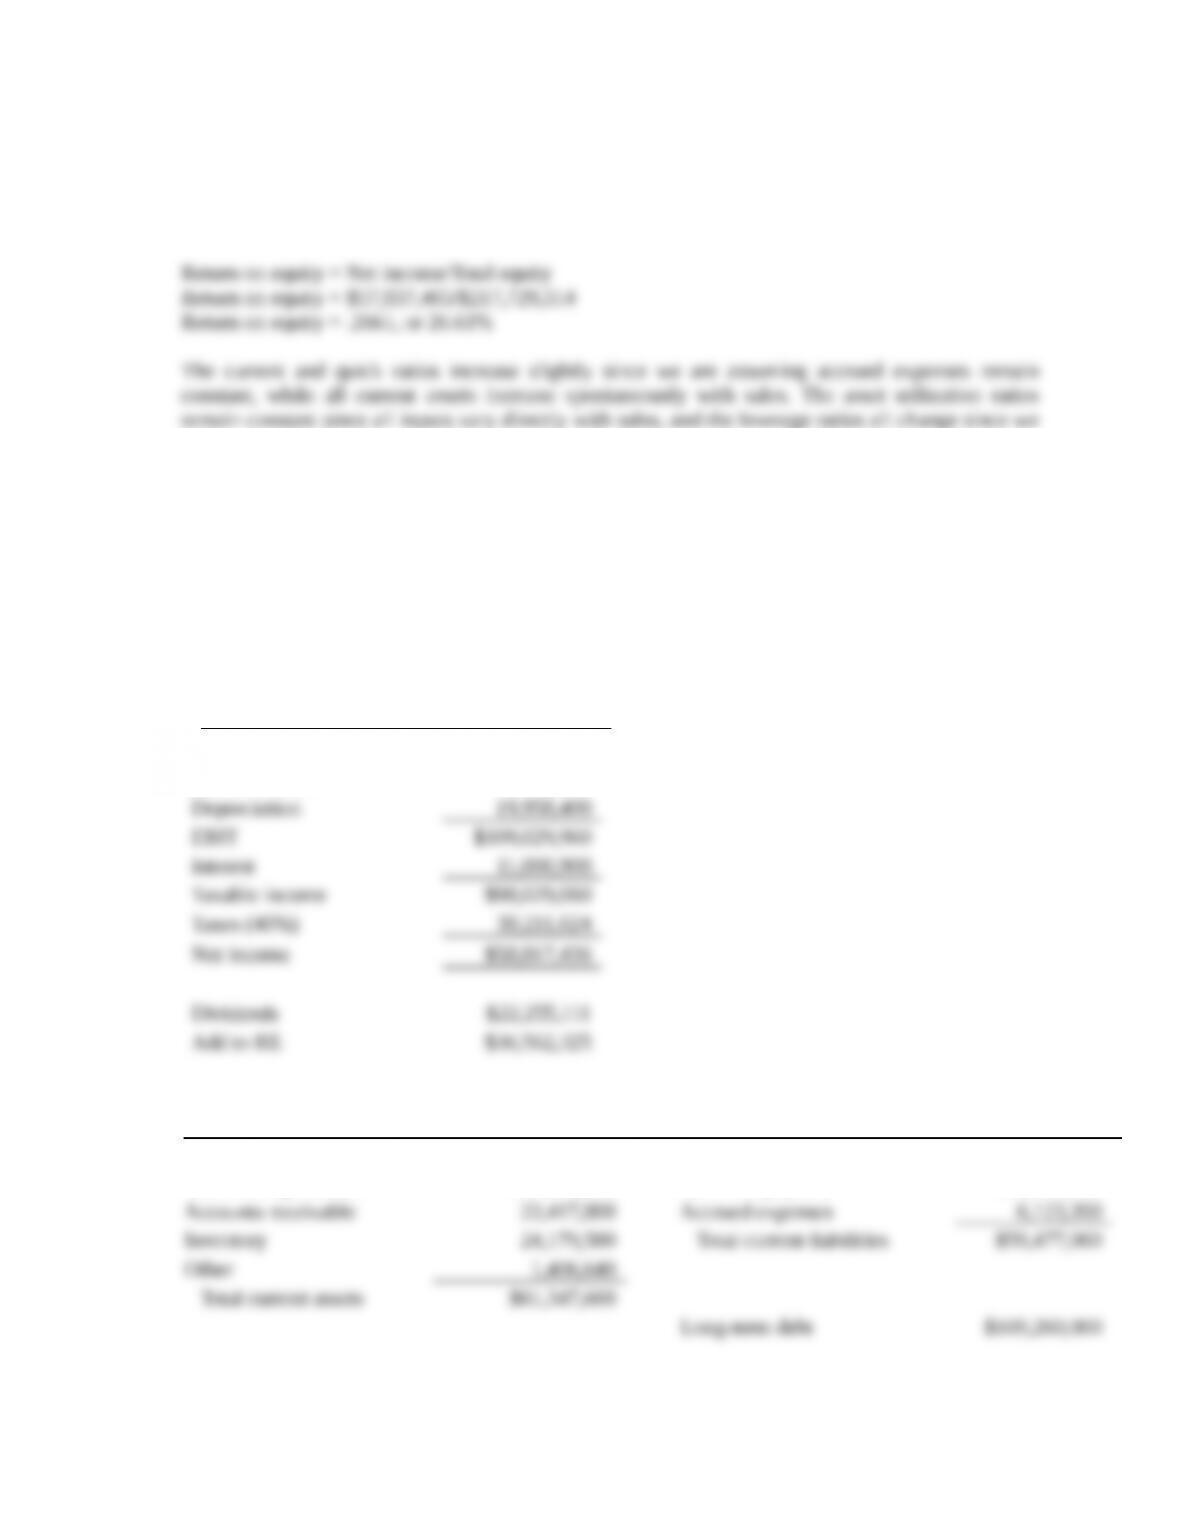
At the sustainable growth rate, the pro forma statements next year will be:
Income statement
Sales
$725,553,856
COGS
511,326,470
Other expenses
86,705,644
Depreciation
19,958,400
EBIT
$107,563,341
Interest
11,000,900
Taxable income
$96,562,441
Taxes (40%)
38,624,977
Net income
$57,937,465
Dividends
$21,922,151
Add to RE
$36,015,314
Balance Sheet
Assets
Liabilities & Equity
Current assets
Current liabilities
Cash and equivalents
$13,191,921
Accounts payable
$52,747,218
Accounts receivable
22,162,906
Accrued expenses
6,123,200
Inventory
23,904,654
Total current liabilities
$58,870,418
Other
1,390,646
Total current assets
$60,650,127
Long-term debt
$169,260,000
Stockholders’ equity
Fixed assets
$415,741,427
Preferred stock
$1,970,000
Common stock
37,583,700
Capital surplus
28,116,300
Accumulated RE
197,579,314
Less treasury stock
(47,520,000)
CHAPTER 3 C-5
Total equity
$217,729,314
Total liabilities and
Total assets
$476,391,554
shareholders’ equity
$445,859,732
So, the EFN is:
EFN = Total assets – Total liabilities and equity
EFN = $476,391,554 – 445,859,732
EFN = $30,531,822
Total asset turnover = 1.52 times
Inventory turnover = COGS/Inventory
Inventory turnover = $511,326,470/$23,904,654
Inventory turnover = 21.39 times
Receivables turnover = Sales/Accounts receivable
Receivables turnover = $725,553,856/$22,162,906
Receivables turnover = 32.74 times
Total debt ratio = (Total assets – Total equity)/Total assets
Profit margin = Net income/Sales
Profit margin = $57,937,465/$725,553,856
CHAPTER 3 C-6
Profit margin = .0799, or 7.99%
Return on assets = Net income/Total assets
Return on assets = $57,937,465/$476,391,554
Return on assets = .1216, or 12.16%
since all inputs vary directly with sales, and the leverage ratios all change since we are assuming debt
and equity do not vary directly with sales. The profitability ratios increase since we are assuming
depreciation and interest expense do not increase spontaneously with sales.
It should be noted that the calculation of the ratios in this case is somewhat problematic since the
balance sheet does not balance. For example, the equity multiplier is no longer one plus the debt-equity
ratio. However, the company can increase both the debt and equity in such a way as to maintain the
ratios at the current levels.
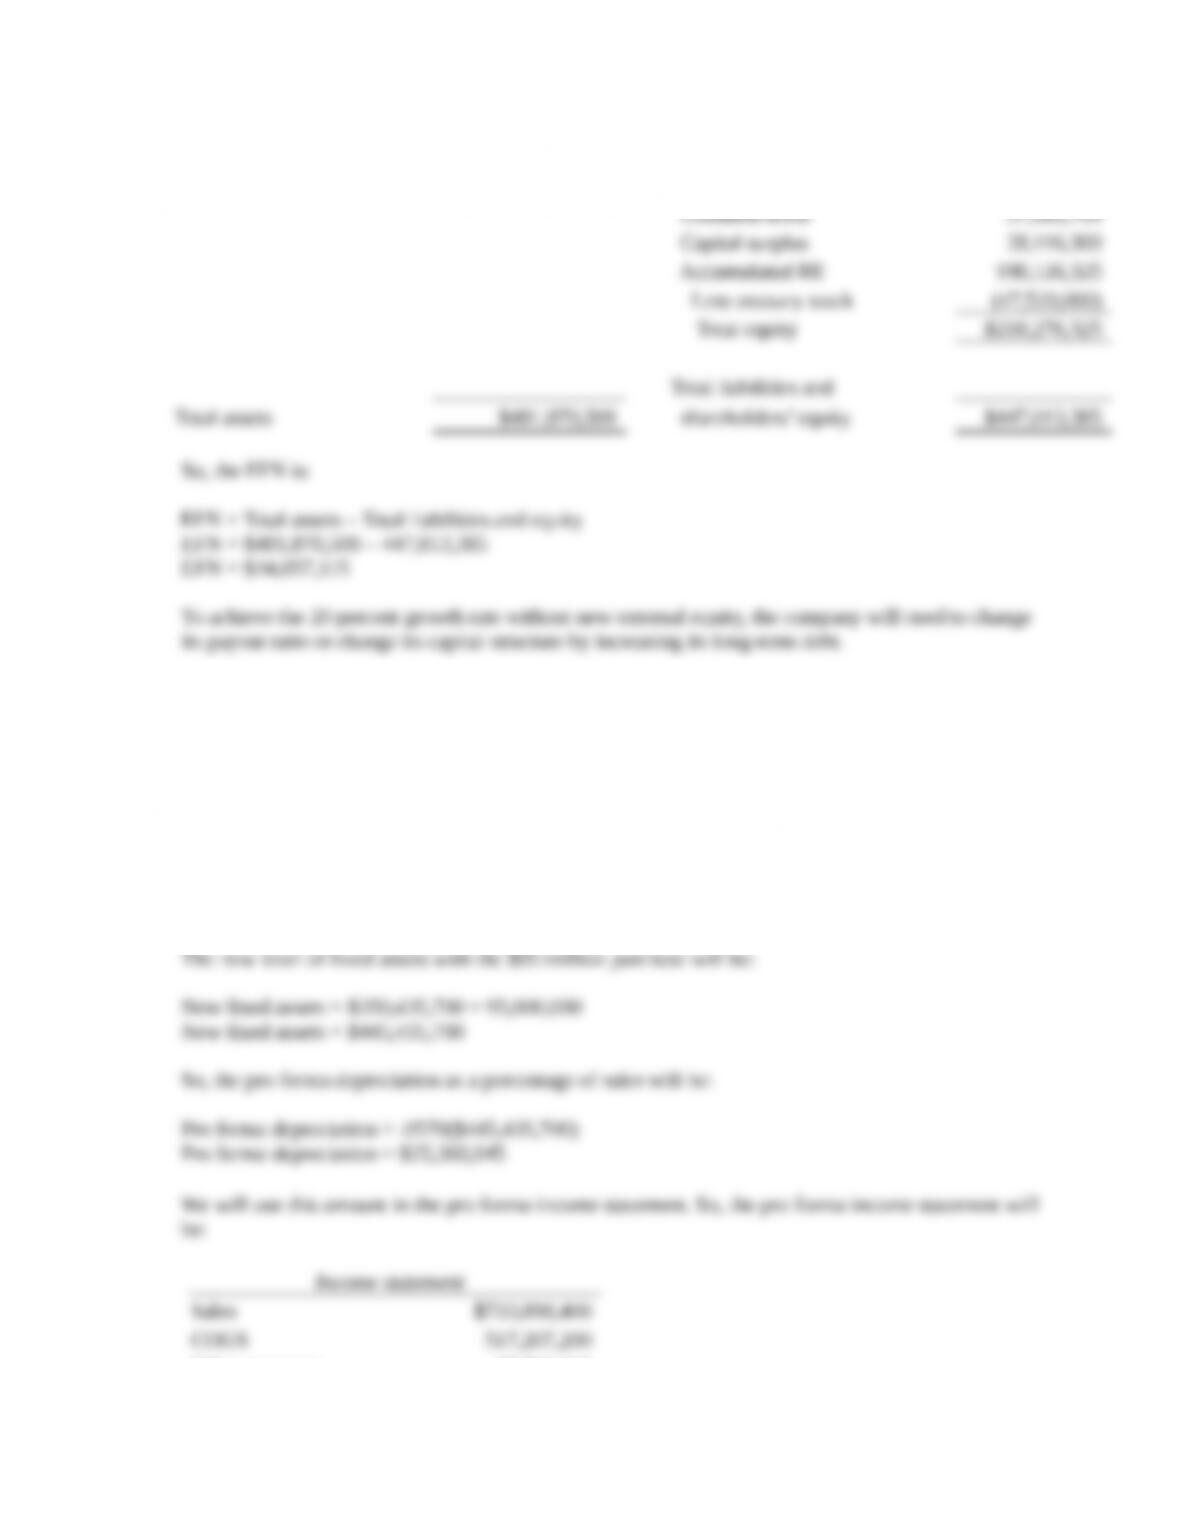
5. Pro forma financial statements for next year at a 20 percent growth rate are:
Income statement
Sales
$733,898,400
COGS
517,207,200
Other expenses
87,702,840
Depreciation
19,958,400
EBIT
$109,029,960
Interest
11,000,900
Taxable income
$98,029,060
Taxes (40%)
39,211,624
Net income
$58,817,436
Dividends
$22,255,111
Add to RE
$36,562,325
Balance Sheet
Assets
Liabilities & Equity
Current assets
Current liabilities
Cash and equivalents
$13,343,640
Accounts payable
$53,353,860
Accounts receivable
22,417,800
Accrued expenses
6,123,200
Inventory
24,179,580
Total current liabilities
$59,477,060
Other
1,406,640
Total current assets
$61,347,660
Long-term debt
$169,260,000
CHAPTER 3 C-7
Stockholders’ equity
Fixed assets
$420,522,840
Preferred stock
$1,970,000
Common stock
37,583,700
Capital surplus
28,116,300
Accumulated RE
198,126,325
Less treasury stock
(47,520,000)
Total equity
$218,276,325
Total liabilities and
Total assets
$481,870,500
shareholders’ equity
$447,013,385
So, the EFN is:
EFN = Total assets – Total liabilities and equity
EFN = $481,870,500 – 447,013,385
EFN = $34,857,115
To achieve the 20 percent growth rate without new external equity, the company will need to change
its payout ratio or change its capital structure by increasing its long-term debt.
6. Now we are assuming the company can only build in amounts of $95 million. We will assume that the
company will go ahead with the fixed asset acquisition. In this case, the pro forma financial statement
calculation will change slightly. Before, we made the assumption that depreciation increased
proportionally with sales, which makes sense if fixed assets increase proportionally with sales. This is
not the case now. To estimate the new depreciation charge, we will find the current depreciation as a
percentage of fixed assets, then apply this percentage to the new fixed assets. The depreciation as a
percentage of assets this year was:
Depreciation percentage = $19,958,400/$350,435,700
Depreciation percentage = .0570, or 5.70%
Income statement
Sales
$733,898,400
COGS
517,207,200
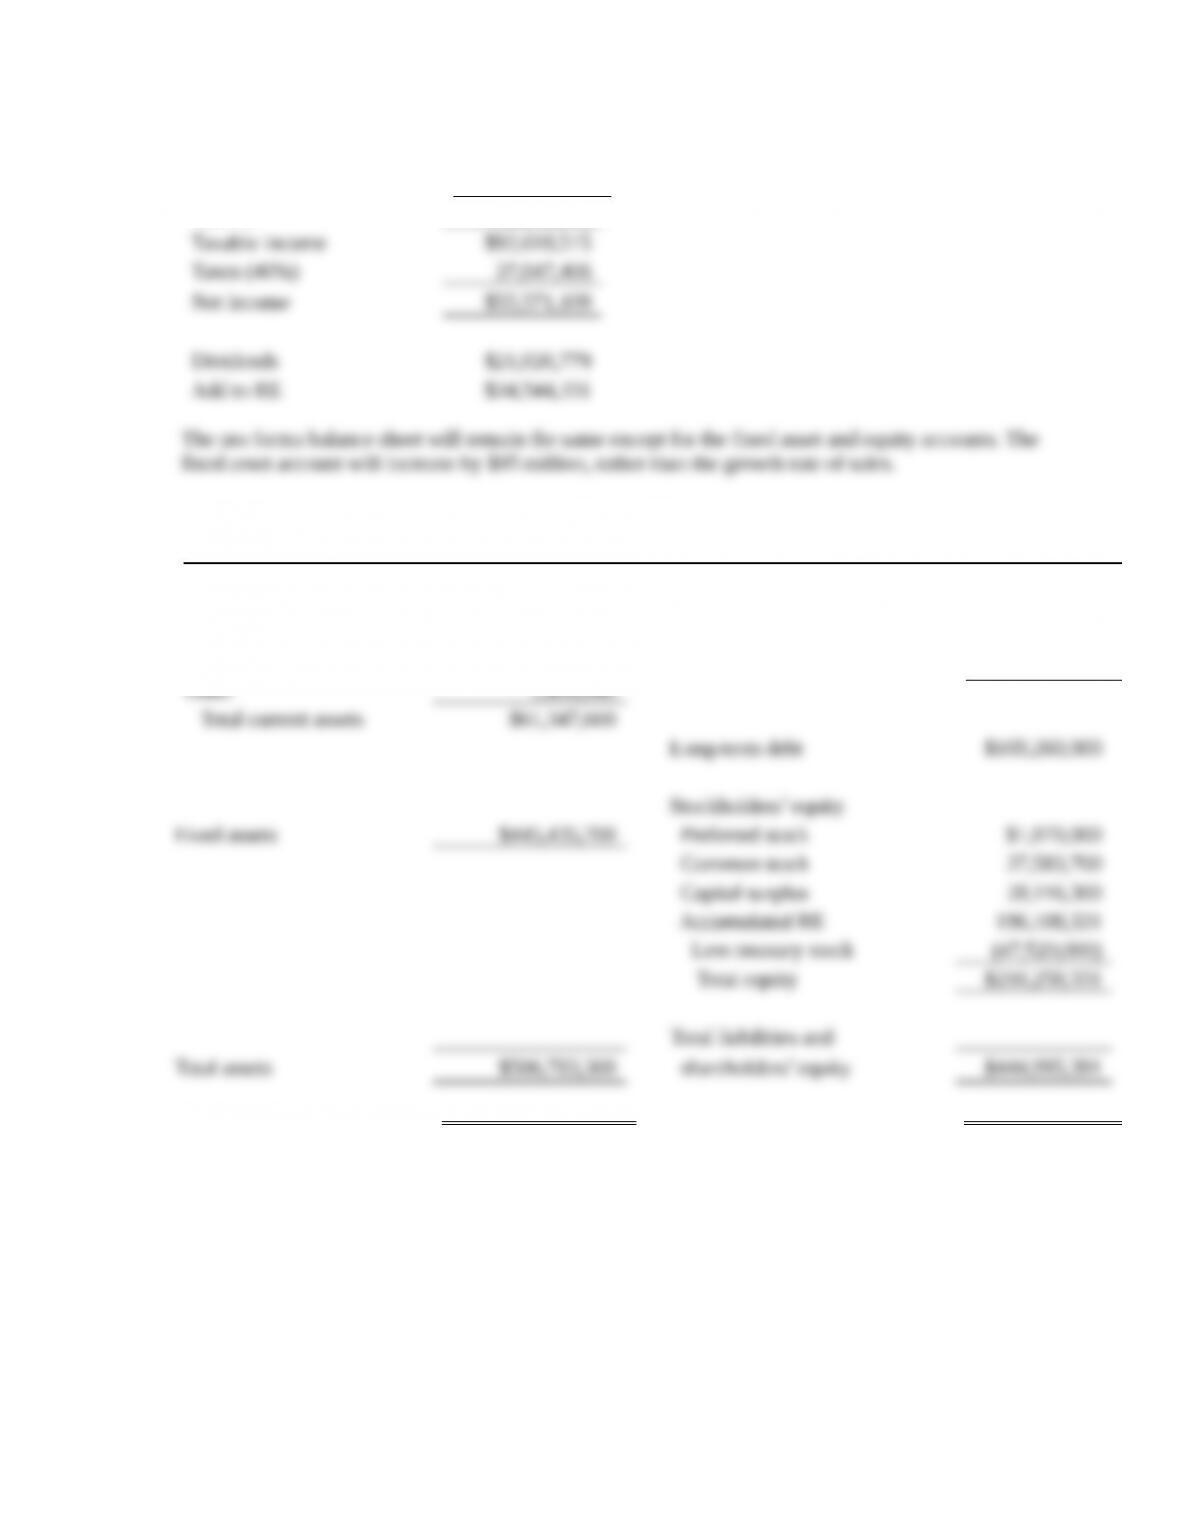
CHAPTER 3 C-8
Other expenses
87,702,840
Depreciation
25,368,945
EBIT
$103,619,415
Interest
11,000,900
Taxable income
$92,618,515
Taxes (40%)
37,047,406
Net income
$55,571,109
Dividends
$21,026,779
Add to RE
$34,544,331
fixed asset account will increase by $95 million, rather than the growth rate of sales.
Balance Sheet
Assets
Liabilities & Equity
Current assets
Current liabilities
Cash and equivalents
$13,343,640
Accounts payable
$53,353,860
Accounts receivable
22,417,800
Accrued expenses
6,123,200
Inventory
24,179,580
Total current liabilities
$59,477,060
Other
1,406,640
Total current assets
$61,347,660
Long-term debt
$169,260,000
Stockholders’ equity
Fixed assets
$445,435,700
Preferred stock
$1,970,000
Common stock
37,583,700
Capital surplus
28,116,300
Accumulated RE
196,108,331
Less treasury stock
(47,520,000)
Total equity
$216,258,331
Total liabilities and
Total assets
$506,783,360
shareholders’ equity
$444,995,391
So, the EFN is:
EFN = Total assets – Total liabilities and equity
EFN = $506,783,360 – 444,995,391
EFN = $61,787,969
Since the fixed assets have increased at a faster percentage than sales, the capacity utilization for
next year will decrease.