CHAPTER 10 B – 1
17. Looking at the long-term corporate bond return history in Table 10.2, we see that the mean return was
6.3 percent, with a standard deviation of 8.4 percent. The range of returns you would expect to see 68
percent of the time is the mean plus or minus 1 standard deviation, or:
18. Looking at the large-company stock return history in Table 10.2, we see that the mean return was 11.9
percent, with a standard deviation of 20.0 percent. The range of returns you would expect to see 68
percent of the time is the mean plus or minus 1 standard deviation, or:
19. To find the best forecast, we apply Blume’s formula as follows:
1 – 5
5 – 90
1 – 5
5 – 30
CHAPTER 10 B – 2
.1035 =
5/R
R
= .5175
22. The arithmetic average return is the sum of the known returns divided by the number of returns, so:
Using the equation for the geometric return, we find:
Geometric average return = [(1 + R1) × (1 + R2) × … × (1 + RT)]1/T – 1
Remember, the geometric average return will always be less than the arithmetic average return if the
returns have any variation.
23. To calculate the arithmetic and geometric average returns, we must first calculate the return for each
year. The return for each year is:
The arithmetic average return was:
And the geometric average return was:
24. To find the real return we need to use the Fisher equation. Re-writing the Fisher equation to solve for
the real return, we get:
r = [(1 + R)/(1 + h)] – 1
So, the real return each year was:
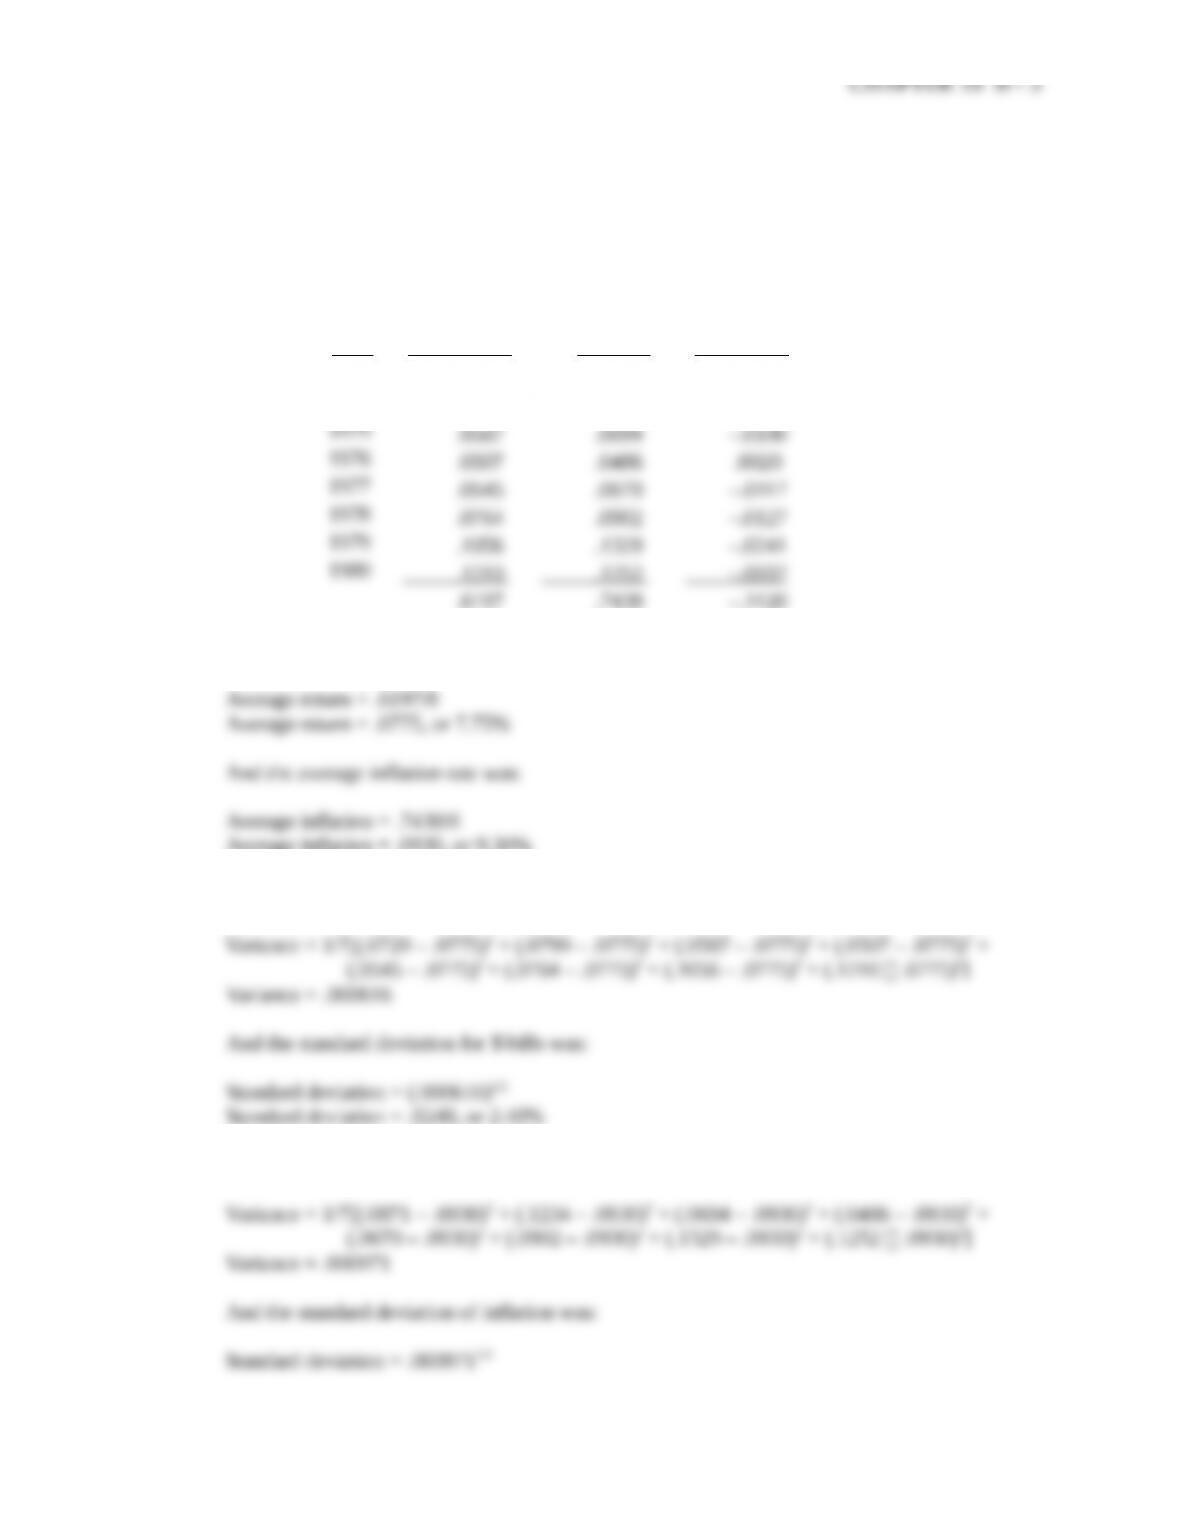
Year
T-bill return
Inflation
Real return
1973
.0729
.0871
–.0131
1974
.0799
.1234
–.0387
1975
.0587
.0694
–.0100
1976
.0507
.0486
.0020
1977
.0545
.0670
–.0117
1978
.0764
.0902
–.0127
1979
.1056
.1329
–.0241
1980
.1210
.1252
–.0037
.6197
.7438
–.1120
a. The average return for T-bills over this period was:
Average inflation = .0930, or 9.30%
b. Using the equation for variance, we find the variance for T-bills over this period was:
The variance of inflation over this period was:
CHAPTER 10 B – 4
c. The average observed real return over this period was:
d. The statement that T-bills have no risk refers to the fact that there is only an extremely small
chance of the government defaulting, so there is little default risk. Since T-bills are short term,
25. To find the return on the coupon bond, we first need to find the price of the bond today. Since one year
has elapsed, the bond now has eight years to maturity, so the price today is:
You received the coupon payments on the bond, so the nominal return was:
26. Looking at the long-term government bond return history in Table 10.2, we see that the mean return
was 6.0 percent, with a standard deviation of 10.0 percent. In the normal probability distribution,
approximately 2/3 of the observations are within one standard deviation of the mean. This means that
1/3 of the observations are outside one standard deviation away from the mean. Or:
But we are only interested in one tail here, that is, returns less than –4 percent, so:

99% level: R ± 3 = 6% ± 3(10%) = –24% to 36%
Challenge
27. The mean return for small company stocks was 16.5 percent, with a standard deviation of 32.0 percent.
Doubling your money is a 100% return, so if the return distribution is normal, we can use the z-statistic.
So:
This corresponds to a probability of (much) less than .5%, or once every 200 years. The actual answer
28. It is impossible to lose more than 100 percent of your investment. Therefore, return distributions are
29. Using the z-statistic, we find:
Pr(R ≤ 0) 27.59%
30. For each of the questions asked here, we need to use the z-statistic, which is:
z = (X – µ)/
a. z1 = (10% – 6.3)/8.4% = .4405
This z-statistic gives us the probability that the return is less than 10 percent, but we are looking
return less than 10 percent. Using the cumulative normal distribution table, we get:
CHAPTER 10 B – 6
Pr(R < 0%) = 1 – Pr(R > 0%) = 1 – .7734 22.66%
b. The probability that T-bill returns will be greater than 10 percent is:
Pr(R ≥ 10%) = 1 – Pr(R ≤ 10%) = 1 – .9820 1.80%
And the probability that T-bill returns will be less than 0 percent is:
c. The probability that the return on long-term corporate bonds will be less than –4.18 percent is:
And the probability that T-bill returns will be greater than 10.56 percent is: