Unlock document.
This document is partially blurred.
Unlock all pages and 1 million more documents.
Get Access
CHAPTER 10
RISK AND RETURN LESSONS FROM
MARKET HISTORY
Answers to Concept Questions
1. They all wish they had! Since they didn’t, it must have been the case that the stellar performance was
2. As in the previous question, it’s easy to see after the fact that the investment was terrible, but it
3. No, stocks are riskier. Some investors are highly risk averse, and the extra possible return doesn’t
4. Unlike gambling, the stock market is a positive sum game; everybody can win. Also, speculators
5. T-bill rates were highest in the early eighties. This was during a period of high inflation and is
6. Before the fact, for most assets the risk premium will be positive; investors demand compensation
over and above the risk-free return to invest their money in the risky asset. After the fact, the observed
unexpectedly high, or if some combination of these two events occurs.
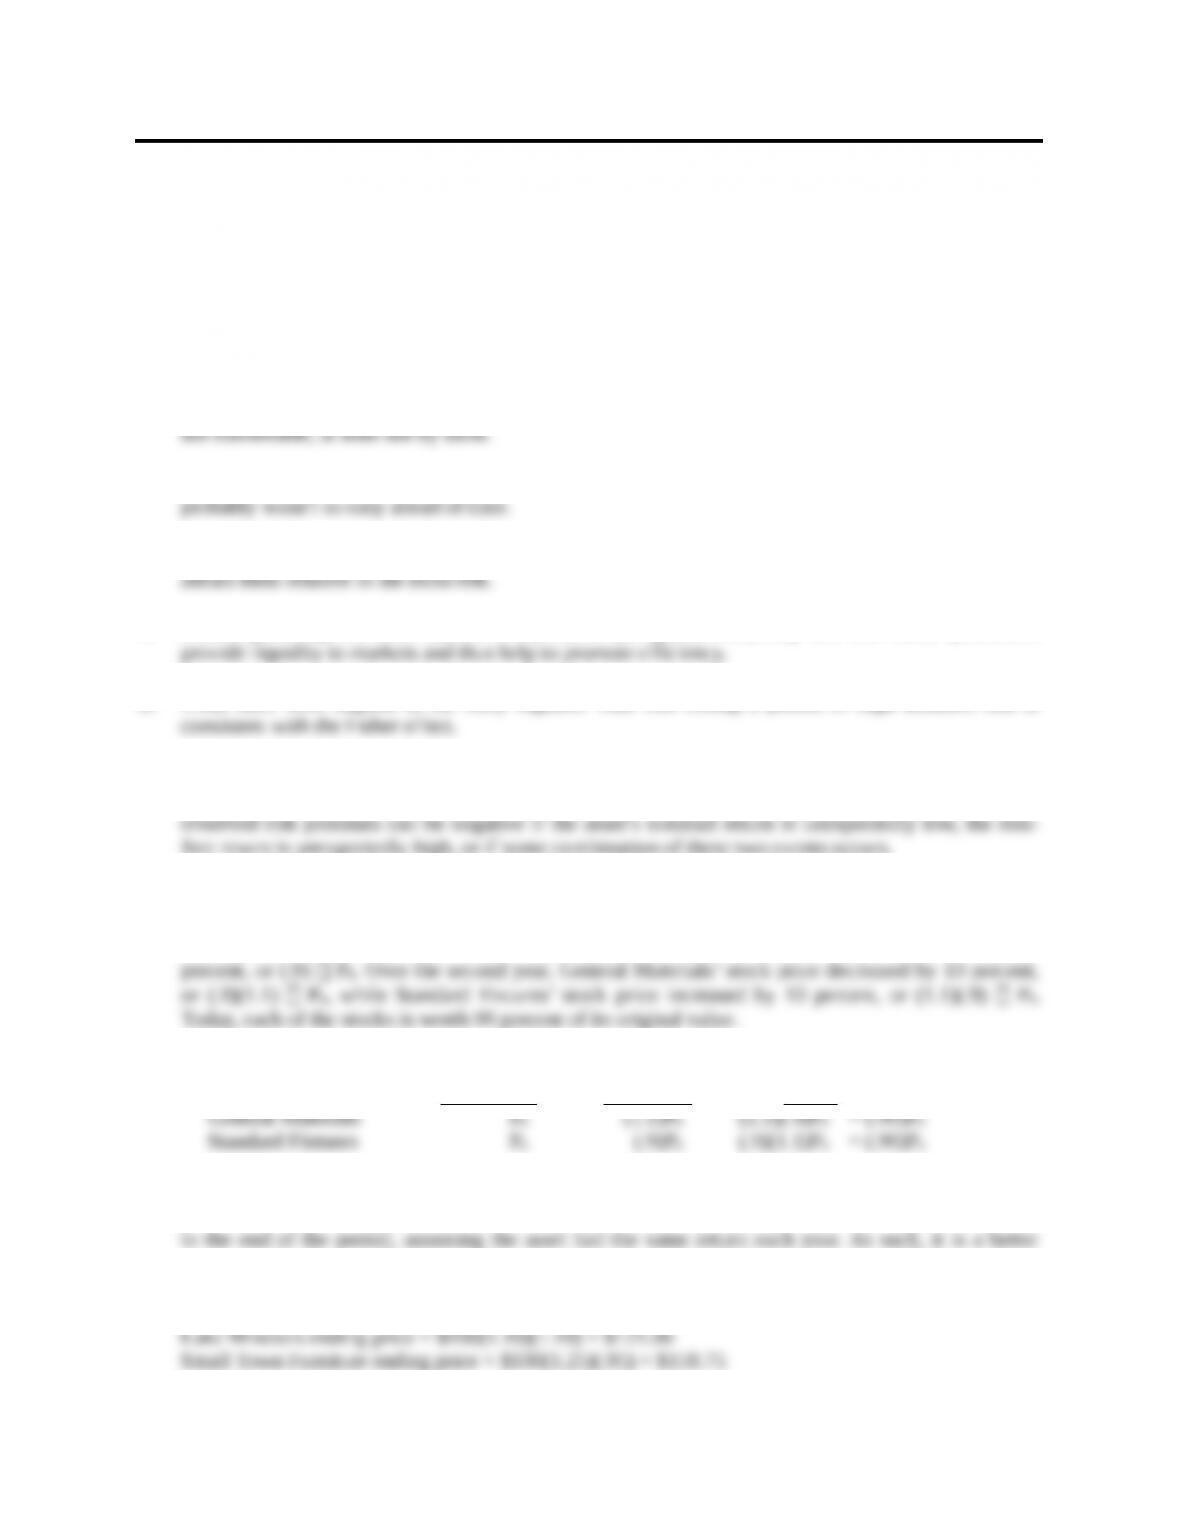
7. Yes, the stock prices are currently the same. Below is a table that depicts the stocks’ price movements.
Two years ago, each stock had the same price, P0. Over the first year, General Materials’ stock price
increased by 10 percent, or (1.1) P0. Standard Fixtures’ stock price declined by 10 percent, or (.9)
stocks is worth 99 percent of its original value.
2 years ago
1 year ago
Today
General Materials
P0
(1.1)P0
(1.1)(.9)P0
= (.99)P0
Standard Fixtures
P0
(.9)P0
(.9)(1.1)P0
= (.99)P0
8. The stock prices are not the same. The return quoted for each stock is the arithmetic return, not the
geometric return. The geometric return tells you the wealth increase from the beginning of the period
to the end of the period, assuming the asset had the same return each year. As such, it is a better
measure of ending wealth. To see this, assuming each stock had a beginning price of $100 per share,
the ending price for each stock would be:
Small Town Furniture ending price = $100(1.25)(.95) = $118.75
9. To calculate an arithmetic return, you sum the returns and divide by the number of returns. As such,
10. Risk premiums are about the same whether or not we account for inflation. The reason is that risk
Solutions to Questions and Problems
NOTE: All end of chapter problems were solved using a spreadsheet. Many problems require multiple
steps. Due to space and readability constraints, when these intermediate steps are included in this solutions
manual, rounding may appear to have occurred. However, the final answer for each problem is found
without rounding during any step in the problem.
Basic
1. The return of any asset is the increase in price, plus any dividends or cash flows, all divided by the
initial price. The return of this stock is:
2. The dividend yield is the dividend divided by the beginning of the period price, so:
And the capital gains yield is the increase in price divided by the initial price, so:
Capital gains yield = .1071, or 10.71%
3. Using the equation for total return, we find:
And the dividend yield and capital gains yield are:
Here’s a question for you: Can the dividend yield ever be negative? No, that would mean you were
4. a. The total dollar return is the change in price plus the coupon payment, so:
Total dollar return = $86
b. The total percentage return of the bond is:
c. Using the Fisher equation, the real return was:
5. The nominal return is the stated return, which is 11.90 percent. Using the Fisher equation, the real
return was:
6. Using the Fisher equation, the real returns for government and corporate bonds were:
1 + R = (1 + r)(1 + h)
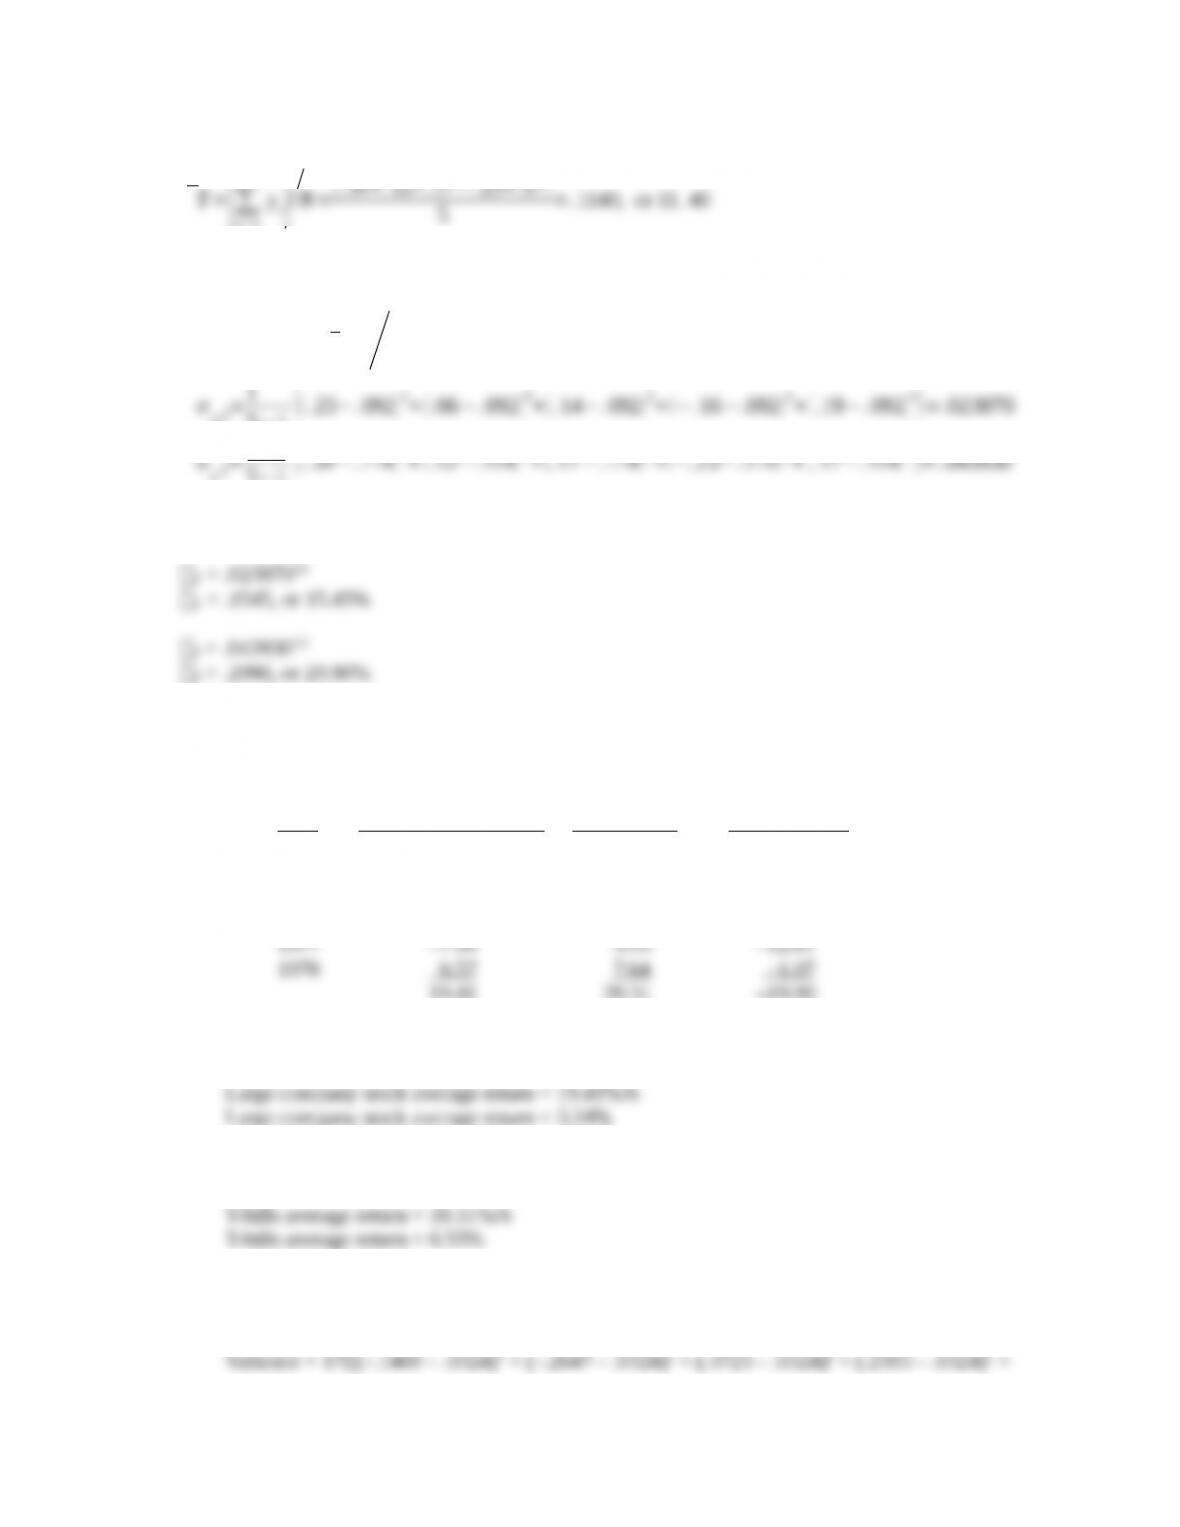
7. The average return is the sum of the returns, divided by the number of returns. The average return for each
stock was:
19.16.14.06.23.
+−++
17.23.17.12.34.
+−++
And the standard deviation for large company stocks over this period was:
Standard deviation = .2411, or 24.11%
Using the equation for variance, we find the variance for T-bills over this period was:
Variance = .000153
And the standard deviation for T-bills over this period was:
c. The average observed risk premium over this period was:
Average observed risk premium = –3.32%
The variance of the observed risk premium was:
And the standard deviation of the observed risk premium was:
9. a. To find the average return, we sum all the returns and divide by the number of returns, so:
b. Using the equation to calculate variance, we find:
10. a. To calculate the average real return, we can use the average return of the asset, and the average
inflation rate in the Fisher equation. Doing so, we find:
(1 + R) = (1 + r)(1 + h)
r
= (1.1080/1.026) – 1
b. The average risk premium is the average return of the asset, minus the average risk-free rate, so,
the average risk premium for this asset would be:
R RP =
–
f
R
RP
= .1080 – .0325
11. We can find the average real risk-free rate using the Fisher equation. The average real risk-free rate
was:
(1 + R) = (1 + r)(1 + h)
f
r
= (1.0325/1.026) – 1
the average real return. So, the average real risk premium was:
r rp =
–
f
r
= 7.99% – .63%
five-year period, we find:
5-year holding-period return = [(1 + R1)(1 + R2)(1 + R3)(1 + R4)(1 + R5)] – 1
5-year holding-period return = [(1 – .1643)(1 + .1581)(1 + .2634)(1 + .0598)(1 + .1843)] – 1
bond now has 19 years to maturity, so the price today is:
P1 = $1,000/1.02438
P1 = $406.07
R = ($406.07 – 385.27)/$385.27
R = .0540, or 5.40%
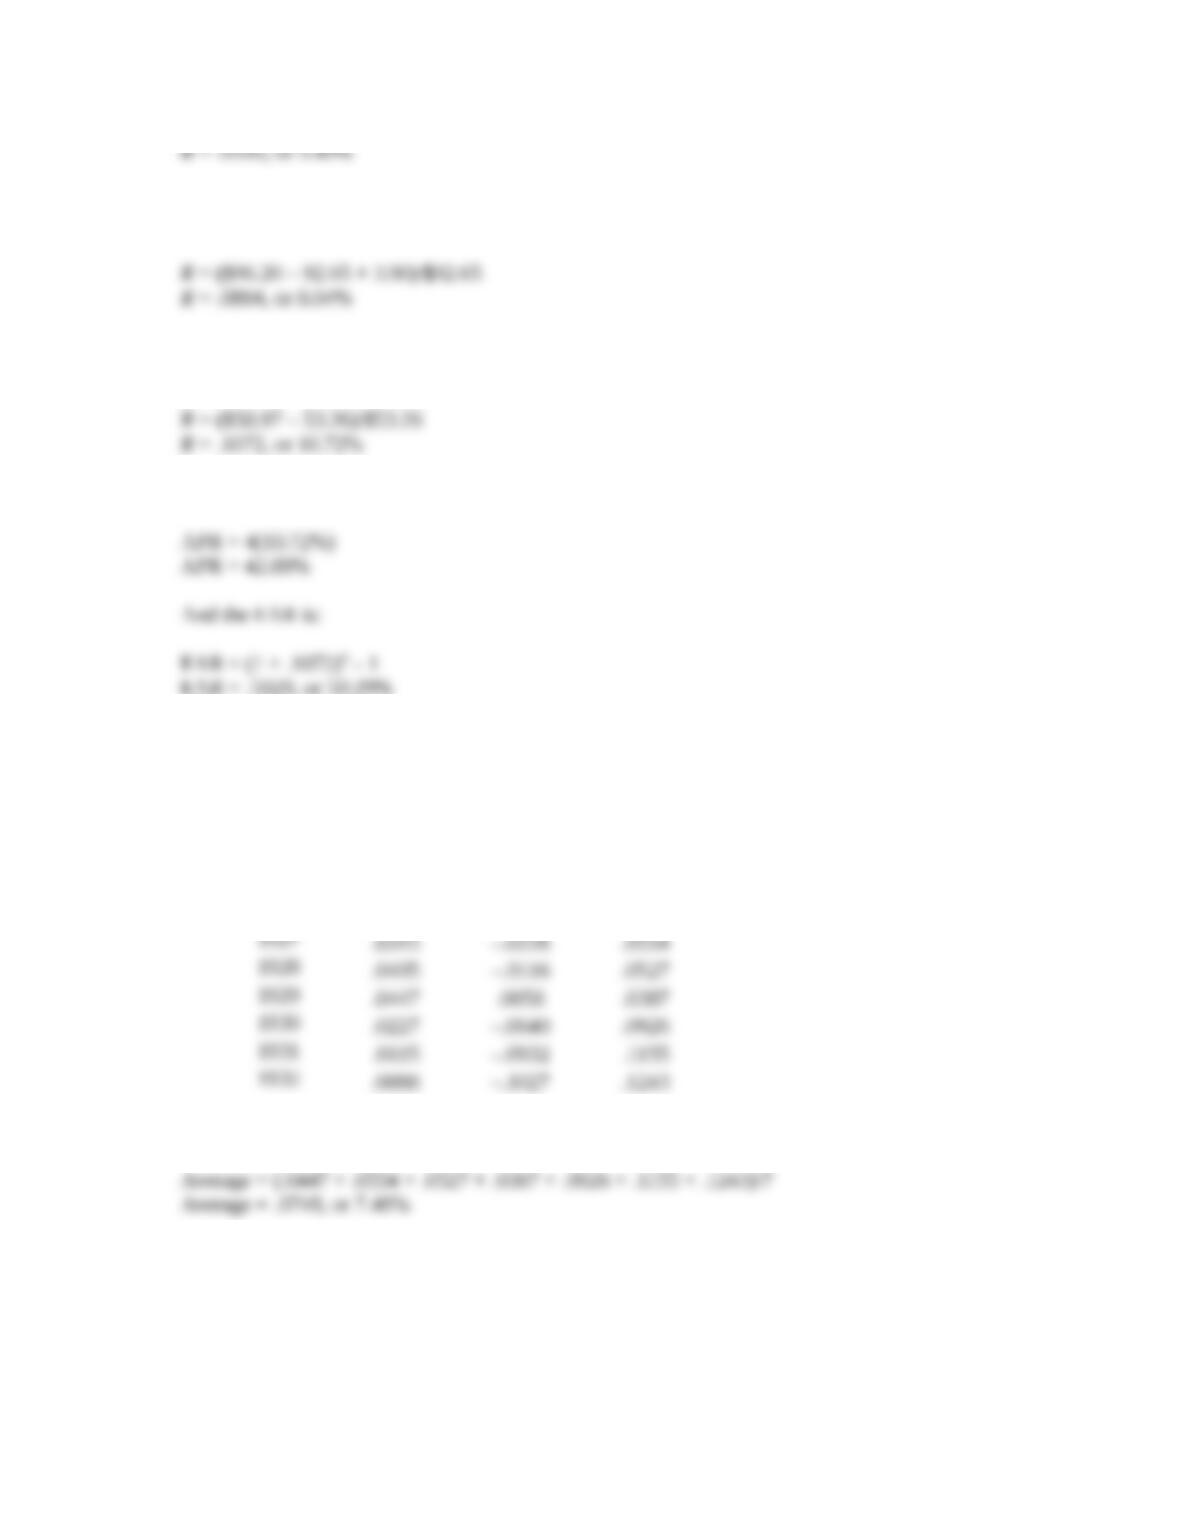
initial price. This preferred stock paid a dividend of $3.90, so the return for the year was:
R = ($96.20 – 92.65 + 3.90)/$92.65
initial price. This stock paid no dividend, so the return was:
R = ($58.97 – 53.26)/$53.26
R = .1072, or 10.72%
APR = 4(10.72%)
APR = 42.88%
16. To find the real return each year, we will use the Fisher equation, which is:
1 + R = (1 + r)(1 + h)
Using this relationship for each year, we find:
T-bills
Inflation
Real Return
1926
.0330
–0112
.0447
1927
.0315
–.0226
.0554
1928
.0405
–.0116
.0527
1929
.0447
.0058
.0387
1930
.0227
–.0640
.0926
1931
.0115
–.0932
.1155
1932
.0088
–.1027
.1243
Average = (.0447 + .0554 + .0527 + .0387 + .0926 + .1155 + .1243)/7
Average = .0748, or 7.48%
negative inflation.


