Data Exploration
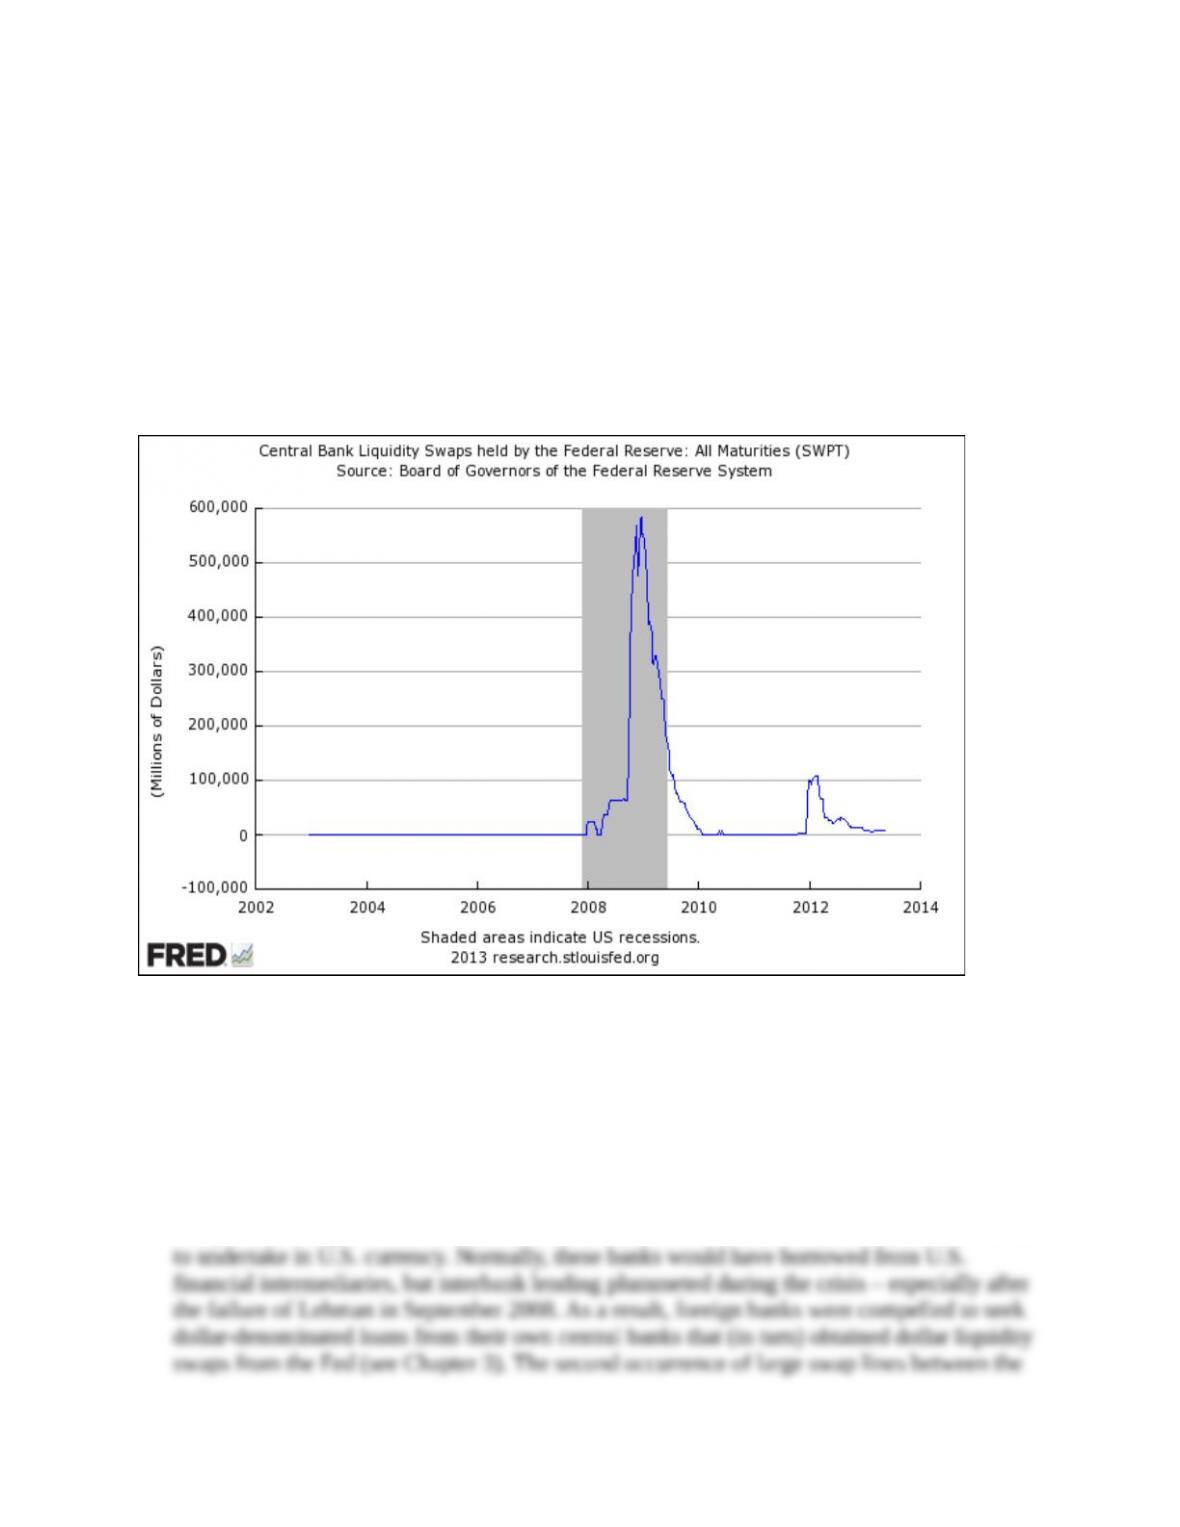
1. Central banks occasionally engage in “liquidity swaps” with each other. Plot and interpret the
Fed’s provision of dollar liquidity swaps (FRED code: SWPT) to other central banks since
2007. To facilitate your interpretation, view the FRED “Notes” about this data series. (LO4)
(Hints: At the FRED Web site, enter the code for Fed liquidity swaps (FRED code: SWPT) in
the search box at the top right of the page. Using the plot and the description below it in the
“Notes” section, explain briefly the observed pattern of liquidity swaps.)
Answer: The data plot is:
These liquidity swaps occur when foreign banks need additional U.S. dollars to fund their
dollar-denominated activities. The Fed exchanges dollars with the foreign central banks,
which then in turn lend them to their member banks. The Fed supplies dollars and accepts
foreign currency at the current exchange rate. The swap agreement includes an arrangement
to reverse the transaction at a later date, when the dollars are returned to the Fed (with
interest) at the initial exchange rate (so there is no currency risk to the Fed).
The data plot shows that these swaps occurred first in the financial crisis of 2007-2009. In
that period, foreign commercial banks needed dollars for transactions their customers wanted
Fed and foreign central banks occurred in 2012 at an acute stage of the sovereign and
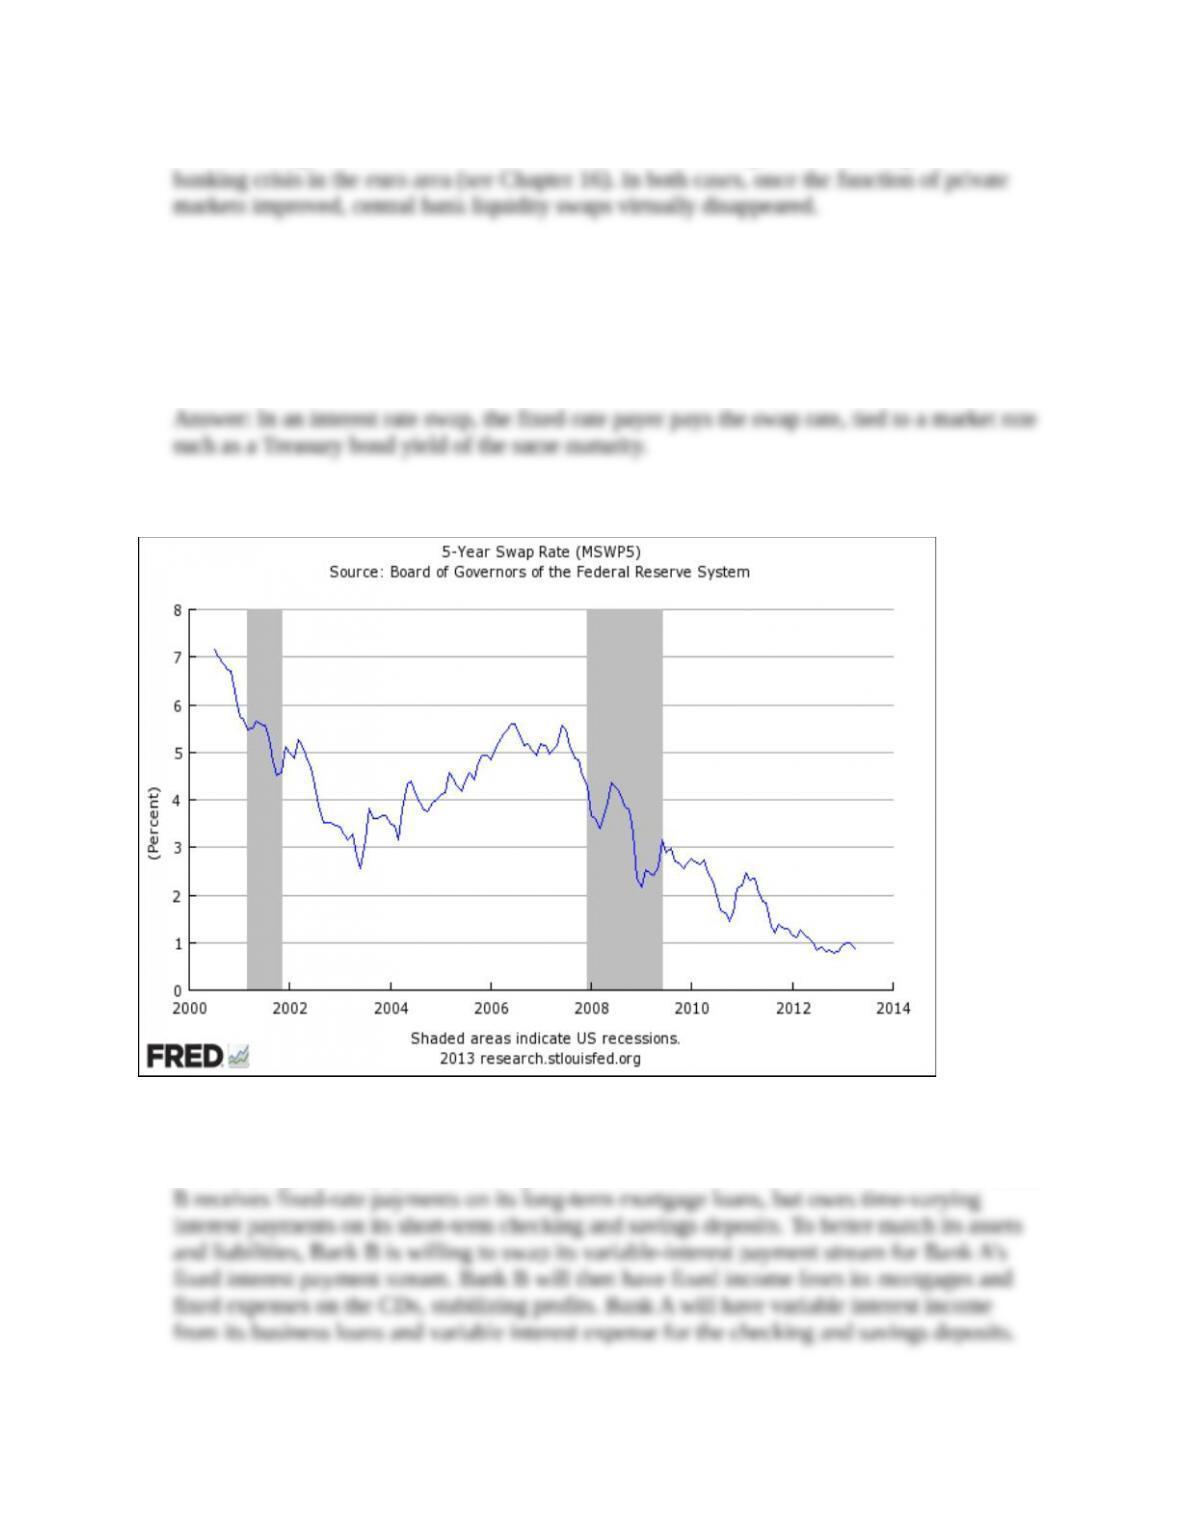
2. Define the swap rate and then plot the five-year swap rate (FRED code: MSWP5). Describe a
transaction involving the swap rate and the actions of the participating parties. (LO4) (Hints:
At the FRED Web site, select “Data Tools,” and then “Create Your Own Graphs.” At the
search box, type in the swap rate code (FRED code: MSWP5).)
The data plot is:
As an example of an interest rate swap, consider a commercial bank (Bank A), that has issued
five-year certificates of deposit on which it pays a fixed interest rate. But it receives
time-varying interest payments on its portfolio of short-term business loans. In contrast, Bank
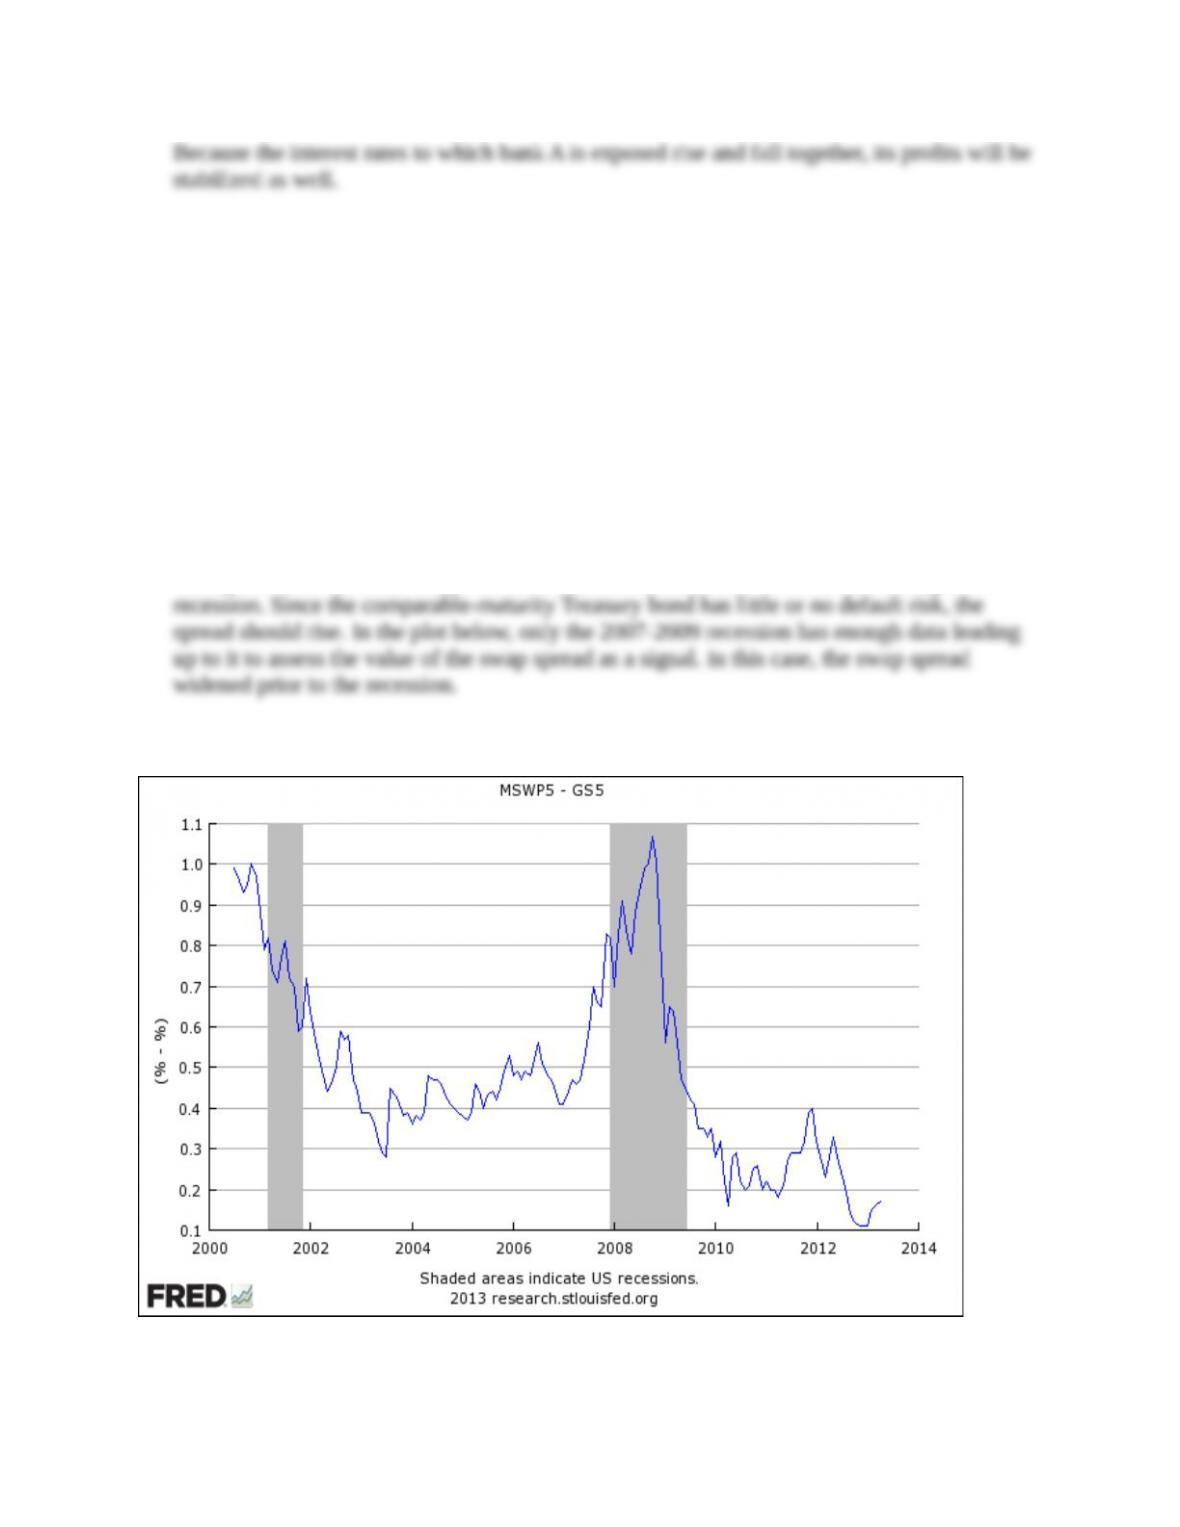
3. The swap spread is the difference between the swap rate and the equivalent-maturity
Treasury bond yield. Explain why a widening swap spread may be a signal of deteriorating
economic conditions. Plot since 2000 the difference between the five-year swap rate (FRED
code: MSWP5) and the five-year Treasury yield (GS5). Interpret the evolution of this
five-year swap spread since July 2007. (LO4) (Hints: At the FRED Web site, select “Data
Tools” and then “Create Your Own Graphs.” In the “Add Data Series” box, type in the code
for the swap rate (FRED code: MSWP5). Choose “Add Data Series” again, select the “Line
1” button, and type in the code for the five-year Treasury bond yield (FRED code: GS5). In
the formula box, input “a – b” (without the quotes). Set the Observation Date Range to begin
at 2000-07-01 and then “Redraw Graph.”)
Answer: The ability of the fixed-rate payer to make the scheduled payments may be impaired
during a recession, so the swap rate should reflect increased risk if investors anticipate a
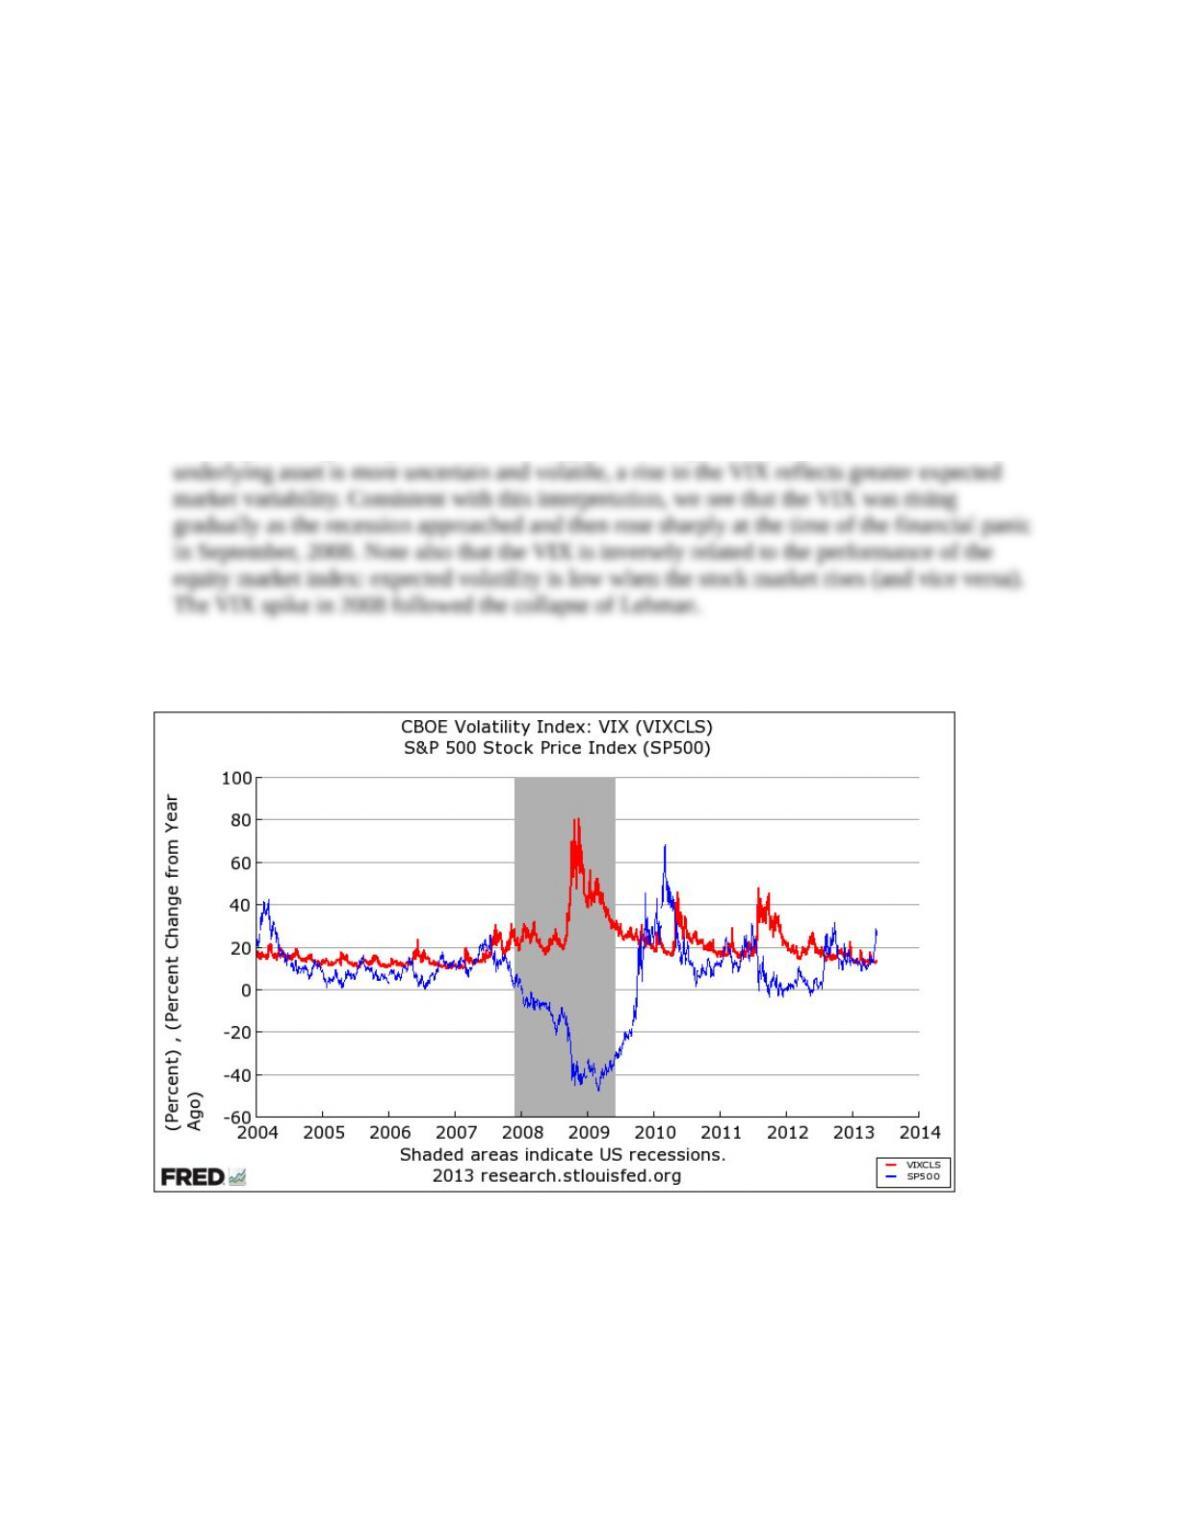
4. Risk-averse investors care greatly about asset price volatility. Using the FRED “Notes” about
the data series, briefly define the (VIX) Volatility Index (FRED code:VIXCLS) of the
Chicago Board Options Exchange (CBOE). Plot since 2004 the VIX and the percent change
from a year ago of the S&P 500 stock market index(FRED code: SP500). Interpret the graph
(LO3) (Hints: At the FRED Web site, input the code for the VIX (FRED code: VIXCLS) in the
search box at the top right. A brief definition appears below the plot. Then, select “Edit
Graph” and “Add Data Series.” Add the code for the stock index (FRED code: SP500),
change the start date to January 2004, and the units to “Percent Change from Year Ago.”
Select “Redraw Graph.”)
Answer: The VIX infers stock market participants’ collective expectation of stock price
volatility from options prices. Because the price of an option increases as the value of the
The data plot is:
5. Commercial banks trade trillions of dollars of derivative contracts, but what is their net
exposure in derivatives markets? Plot the difference between what commercial banks are
owed (FRED code: DFVACBW027SBOG) and what they owe (FRED code:
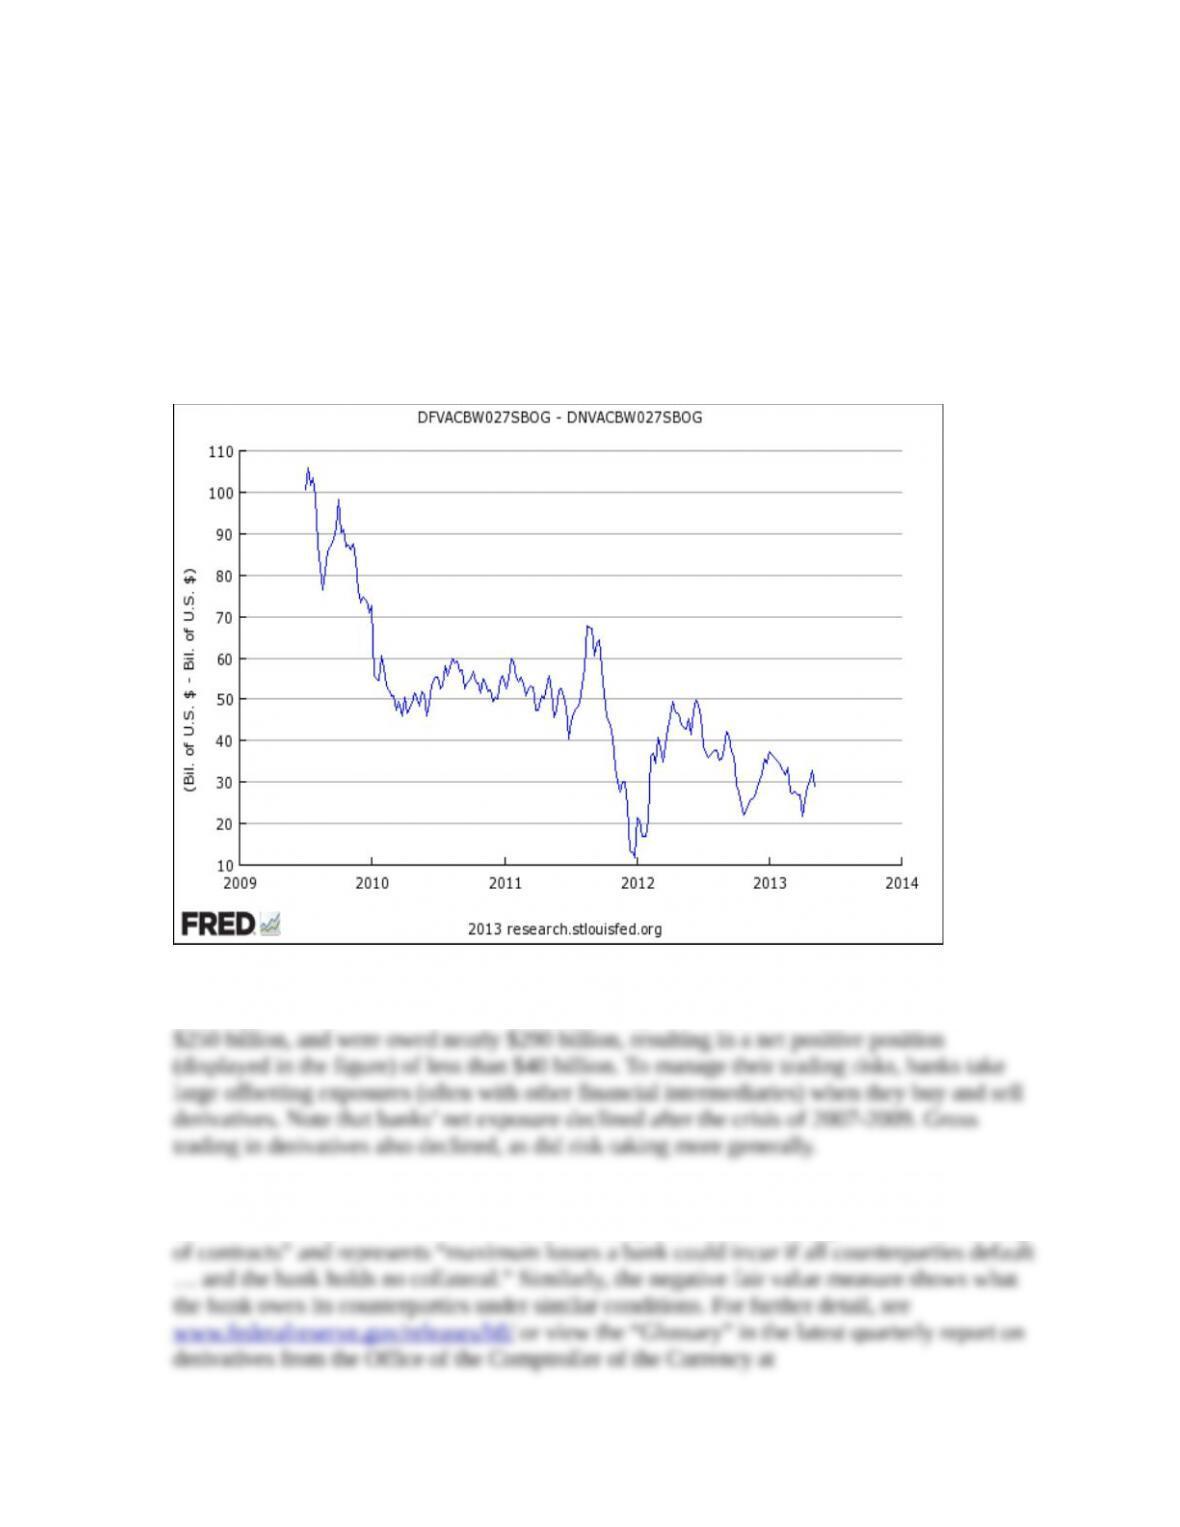
DNVACBW027SBOG) on their derivative positions.(LO1) (Hints: At the FRED Web site,
select “Data Tools” and the “Create Your Own Graph.” In the search box, enter the code for
what banks are owed (FRED code: DFVACBW027SBOG) , then select “Add Data Series,”
choose the “Line 1” button, and enter the code for what banks owe (FRED code:
DNVACBW027SBOG). At the formula box, type in “a – b (without the quotes) and then
“Redraw Graph.”)
Answer: The data plot is:
The plot shows that banks on balance are owed billions, rather than trillions, of dollars by
counterparties on their derivative trades. On average in 2012, banks owed a bit more than
Note: According to the Office of the Comptroller of the Currency, the positive fair value
measure is what a bank is “owed … by its counterparties without taking into account netting

* indicates more difficult problems