
Chapter 08 – Stocks, Stock Markets, and Market Efficiency
Chapter 8
Stocks, Stock Markets, and Market Efficiency
Conceptual and Analytical Problems
1. Explain why being a residual claimant makes stock ownership risky. (LO1)
Answer: Stockholders do not receive dividends unless all of the firm’s creditors
2. Do individual shareholders have an effective say in corporate governance matters? (LO1)
Answer: In principle, shareholders have a say on corporate affairs. They elect
members of the company’s board of directors and can vote on important issues
raised at the company’s annual meeting. Furthermore, they can offer resolutions
3. Consider the following information on the stock market in a small economy. (LO2)
Company Shares
Outstanding
Price,
beginning
of year
Price, end
of year
1 100 $100 $94
2 1000 $20 $25
3 10,000 $3 $6
a. Compute a price-weighted stock price index for the beginning of the year and
the end of the year. What is the percentage change?
b. Compute a value-weighted stock price index for the beginning of the year and
the end of the year. What is the percentage change?
Answer:
a. For a price-weighted index, we find the cost of buying one share of each
8-1
© 2015 by McGraw-Hill Education. This is proprietary material solely for authorized instructor use. Not authorized for sale or distribution in
any manner. This document may not be copied, scanned, duplicated, forwarded, distributed, or posted on a website, in whole or part.

Chapter 08 – Stocks, Stock Markets, and Market Efficiency
b. The percentage change in a value-weighted index is given by percentage
change in the sum of the values of the companies. At the beginning of the
year, the value of the companies is given by
At the end of the year, the value is
4. To raise wealth and stimulate private spending, suppose the central bank lowers interest
rates, making stock market investment relatively attractive. Which stock market index
would you monitor to judge the effectiveness of the policy: the Dow Jones Industrial
Average or the S&P 500? Why? (LO2)
Answer: Since the S&P 500 is a value-weighted index, it tracks the value of
5. Suppose you see evidence that the stock market is efficient. Would that make you more or
less likely to invest in stocks for your 401(k) retirement plan when you get your first job?
(LO4)
Answer: Efficient markets suggest that all relevant information is incorporated
into stock prices, and that changes in prices on a particular day reflect that day’s
6. Professor Siegel argues that investing in stocks for retirement may be less risky than
investing in bonds. Would you recommend this approach to an individual in his or her
early 60s? (LO4)
Answer: The closer an individual is to retirement, the less time for a portfolio to
overcome downward shocks to its value. Consequently. allocating retirement
8-2
© 2015 by McGraw-Hill Education. This is proprietary material solely for authorized instructor use. Not authorized for sale or distribution in
any manner. This document may not be copied, scanned, duplicated, forwarded, distributed, or posted on a website, in whole or part.

Chapter 08 – Stocks, Stock Markets, and Market Efficiency
7. How do venture capital firms, which specialize in identifying and financing promising
but high-risk businesses, help the economy grow? (LO5)
Answer: New companies often have difficulty finding financing to put their plans
into action. Venture capital firms specialize (say, in one particular industry) in
8. *What are the advantages of holding stock in a company versus holding bonds issued by
the same company? (LO1)
Answer: Stocks represent a share of ownership in the company and give the
holder a share in the future profits of the company. If the company, for example,
makes a great discovery, invents the next great product etc., stock holders get to
9. If Professor Siegel is correct that stocks are less risky than bonds, then the risk premium
on stock may be zero. Assuming that the risk-free interest rate is 2½ percent, the growth
rate of dividends is 1 percent and the current level of dividends is $70, use the
dividend-discount model to compute the level of the S&P 500 that is warranted by the
fundamentals. Compare the result to the current S&P 500 level, and comment on it.
(LO4)
Answer:
10. *Why is a booming stock market not always a good thing for the economy? (LO5)
Answer: If stock prices are rising for reasons that are not related to economic
fundamentals, there may be a misallocation of resources in the economy.
8-3
© 2015 by McGraw-Hill Education. This is proprietary material solely for authorized instructor use. Not authorized for sale or distribution in
any manner. This document may not be copied, scanned, duplicated, forwarded, distributed, or posted on a website, in whole or part.

Chapter 08 – Stocks, Stock Markets, and Market Efficiency
11. The financial press tends to become excited when the Dow Jones Industrial Average rises
or falls sharply. After a particularly steep rise or fall, newspapers may publish tables
ranking the day’s results with other large advances or declines. What do you think of
such reporting? If you were asked to construct a table of the best and worst days in stock
market history, how would you do it, and why? (LO2)
Answer: This type of reporting can be misleading because it ignores the level of
12. You are thinking about investing in stock in a company which paid a dividend of $10 this
year and whose dividends you expect to grow at 4 percent a year. The risk free rate is 3
percent and you require a risk premium of 5 percent. If the price of the stock in the
market is $200 a share, should you buy it? (LO3)
13. *Consider again the stock described in Problem 12. What might account for the
difference in the market price of the stock and the price you are willing to pay for the
stock? (LO3)
Answer: The difference could reflect the fact that you require a lower risk
14. You are trying to decide whether to buy stock in Company X or Company Y. Both
companies need $1000 capital investment and will earn $200 in good years (with
probability 0.5) and $60 in bad years. The only difference between the companies is that
Company X is planning to raise all of the $1000 needed by issuing equity while
Company Y plans to finance $500 through equity and $500 through bonds on which 10%
interest must be paid.
Construct a table showing the expected value and standard deviation of the equity
return for each of the companies. (You could use Table 8.3 as a guide.) Based on
this table, in which company would you buy stock? Explain your choice. (LO3)
Answer:
% equity % bonds Pay on Pay to Equity Expected Standard
8-4
© 2015 by McGraw-Hill Education. This is proprietary material solely for authorized instructor use. Not authorized for sale or distribution in
any manner. This document may not be copied, scanned, duplicated, forwarded, distributed, or posted on a website, in whole or part.

Chapter 08 – Stocks, Stock Markets, and Market Efficiency
bonds equity
holders
return Value Deviatio
n
(Remember, the expected value of the equity return is calculated as a % of 500 –
the amount put into equity.)
Which company you choose depends on your attitude toward risk. If you are
15. Your brother has a $1000 and a one-year investment horizon and asks your advice about
whether he should invest in a particular company’s stock. What information would you
suggest he analyze when making his decision? Is there an alternative investment strategy
to gain exposure to the stock market you might suggest he consider? (LO4)
Answer: You should explain that the return on his investment will depend on the
dividend he may be paid and the movement in the stock price over the year. You
16. Given that many stock market indices across the world fell and rose together during the
financial crisis of 2007-2009, do you think investing in global stock markets is an
effective way to reduce risk? Why or why not? (LO2)
Answer: While it is true that movements in stock market indices across the world
have become more highly correlated over time, as long as they are not perfectly
correlated, there are benefits from spreading your investments. (Recall how
spreading reduces risk from chapter 5.)
17. Do you think a proposal to abolish limited liability for stockholders would be supported
by companies issuing stock? (LO1)
Answer: No. The obvious downside would be that stocks would become much
less attractive as an investment, making it much costlier for firms to raise funds
8-5
© 2015 by McGraw-Hill Education. This is proprietary material solely for authorized instructor use. Not authorized for sale or distribution in
any manner. This document may not be copied, scanned, duplicated, forwarded, distributed, or posted on a website, in whole or part.

Chapter 08 – Stocks, Stock Markets, and Market Efficiency
18. You peruse the available records of some public figures in your area and notice that they
persistently gain higher returns on their stock portfolios than the market average. As a
believer in efficient markets, what explanation for these rates of returns seems most likely
to you? (LO5)
Answer: Your first instinct is that the public officials have access to inside
19. Do you think that widespread belief in the efficient markets theory was a significant
contributor to the 2007-2009 financial crisis? Why or why not? (LO5)
Answer: The efficient market hypothesis does not postulate that market prices of
securities are always correct, but that they reflect all known information that
20. Based on the dividend-discount model, what do you think would happen to stock prices if
there were an increase in the perceived riskiness of bonds? (LO3)
Answer: If investors perceive bonds are more risky, then the relative riskiness of
stocks will fall. Stocks would become relatively more attractive, requiring a
21. *Use the dividend-discount model to explain why an increase in stock prices is often a
good indication that the economy is expected to do well. (LO3)
Answer: How well investors expect the economy to do is reflected in the expected
growth rate of dividends, g. When investors are optimistic about the future, they
Data Exploration:
8-6
© 2015 by McGraw-Hill Education. This is proprietary material solely for authorized instructor use. Not authorized for sale or distribution in
any manner. This document may not be copied, scanned, duplicated, forwarded, distributed, or posted on a website, in whole or part.
Chapter 08 – Stocks, Stock Markets, and Market Efficiency
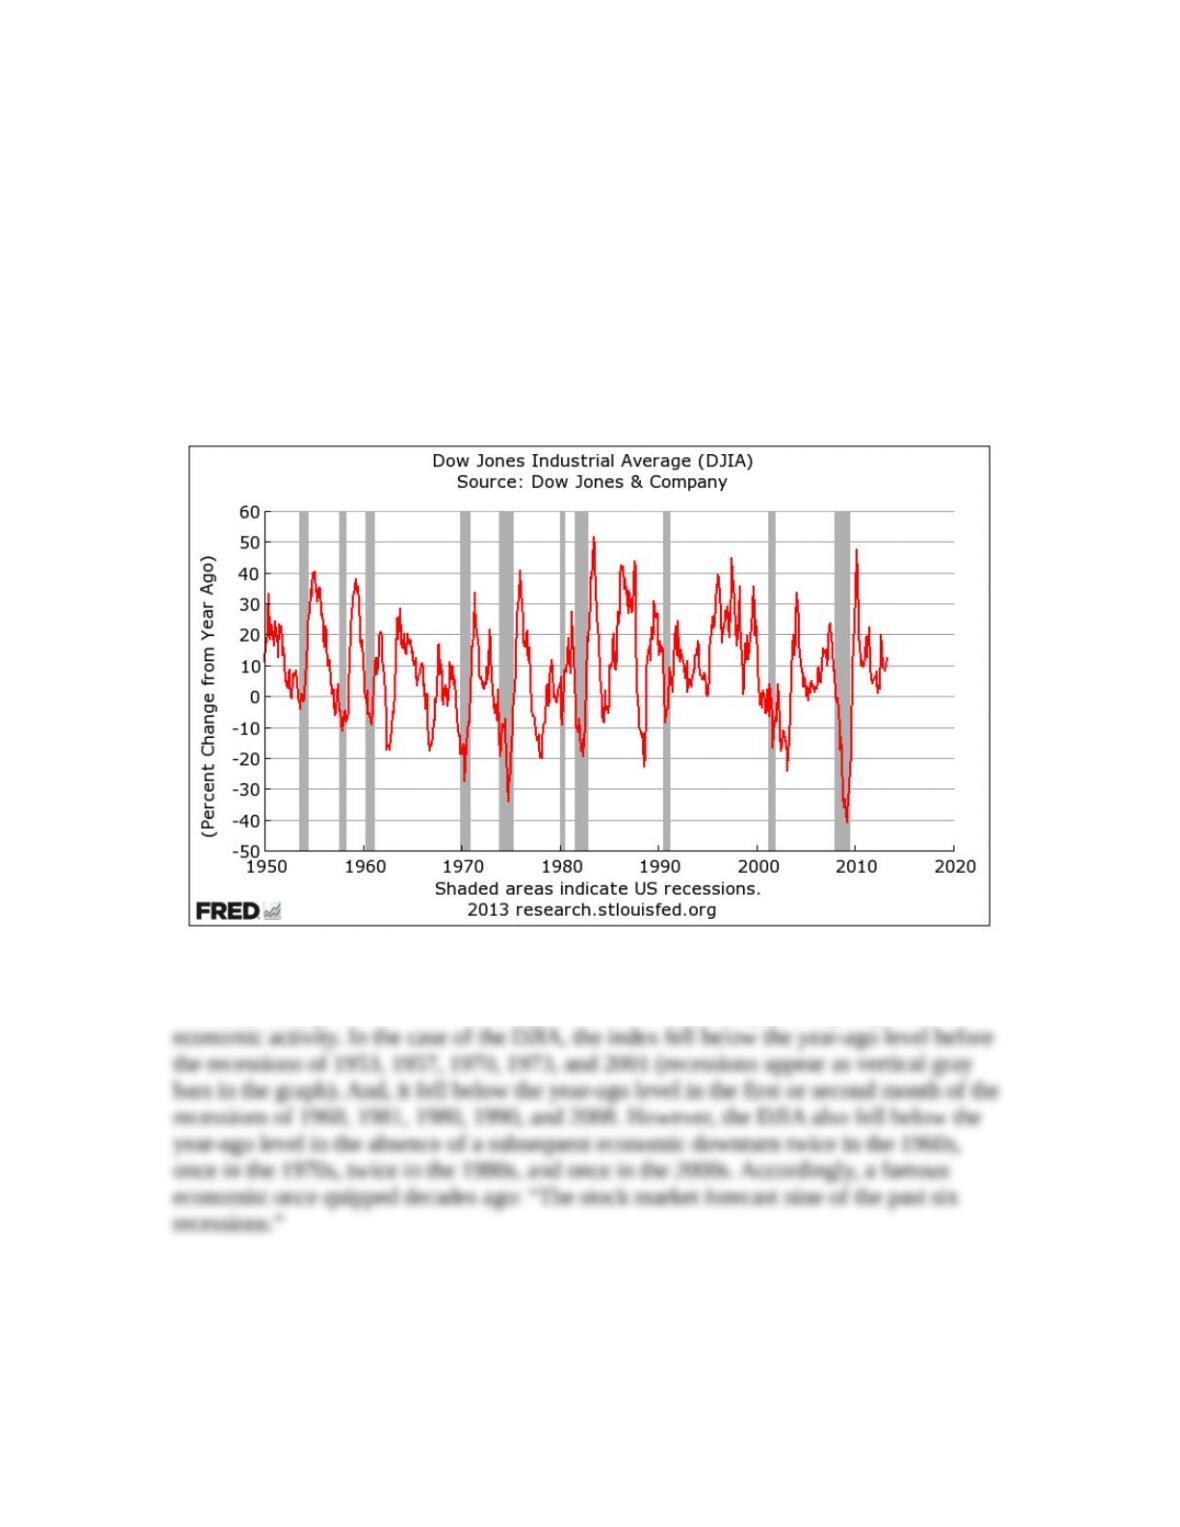
1. How well does the stock market anticipate the behavior of the economy? Plot since 1950
the percentage change from a year ago of the Dow Jones Industrial Average. Is the index
a reliable predictor of business cycle downward turns (depicted by the graph by vertical,
shaded bars)? (LO5) (Hints: At the FRED Web site, click on “Data Tools” and then
“Create Your Own Graphs.” In the “Add Data Series” box, input the code for Dow
Jones Industrial Average (DJIA). Change the “Frequency” to monthly, set the start date
in the “Observation Date Range” to January 1950, and change the “Units” to “Percent
Change from Year Ago.”)
Answer: The data plot is:
Among various measures of financial conditions, a broad index of the stock market is one
of the best predictors of economic downturns and upturns because investors are
forward-looking and know that future profits and dividends depend on prospective
2. Why might the stocks of small firms outperform large firms over long periods of time?
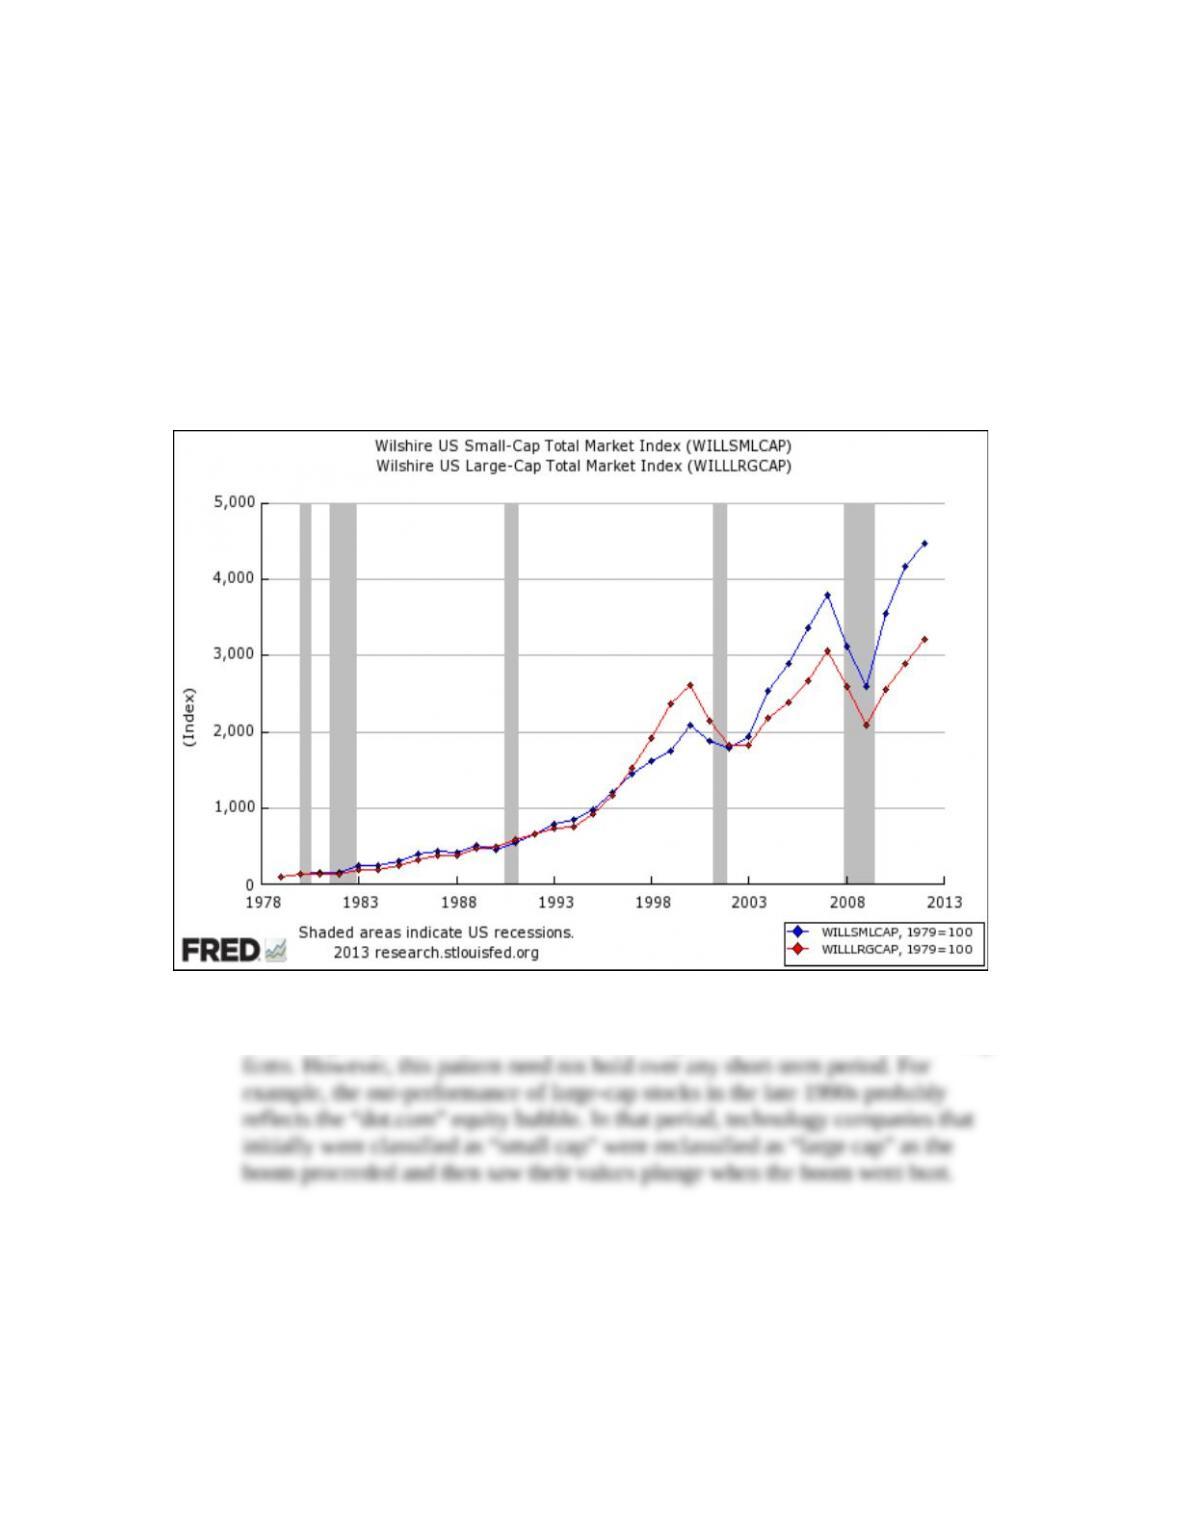
Will this hold over short periods of time, too? Plot since 1979 the stock indexes for small
firms (FRED code: WILLSMLCAP) and large firms (FRED code: WILLLRGCAP) using
annual data scaled to a common base year of 1979=100. (LO3) (Hints: At the FRED Web
8-7
© 2015 by McGraw-Hill Education. This is proprietary material solely for authorized instructor use. Not authorized for sale or distribution in
any manner. This document may not be copied, scanned, duplicated, forwarded, distributed, or posted on a website, in whole or part.
Chapter 08 – Stocks, Stock Markets, and Market Efficiency
site, click on “Data Tools” and then “Create Your Own Graphs.” In the “Add Data
Series” box, input the code for the Wilshire U.S. Small Cap Total Market Index (FRED
code: WILLSMLCAP) and select “Annual” from the Frequency dropdown box. At the
Units box, select “Index (Scale value to 100 for chosen period).” At “Enter an
Observation Date” type “1979-01-01” to start the scale at 100 in 1979. Next, at “Add
Data Series,” add the Wilshire U.S. Large Cap Total Market Index (FRED code:
WILLLRGCAP), specify the frequency as annual, and then “Redraw Graph.” Note that
both indexes start at the same value of 100 in 1979.)
Answer: The data plot is:
Because risk requires compensation, we expect the stocks of small firms (that
have a higher probability of failure) to offer higher returns than the stocks of large
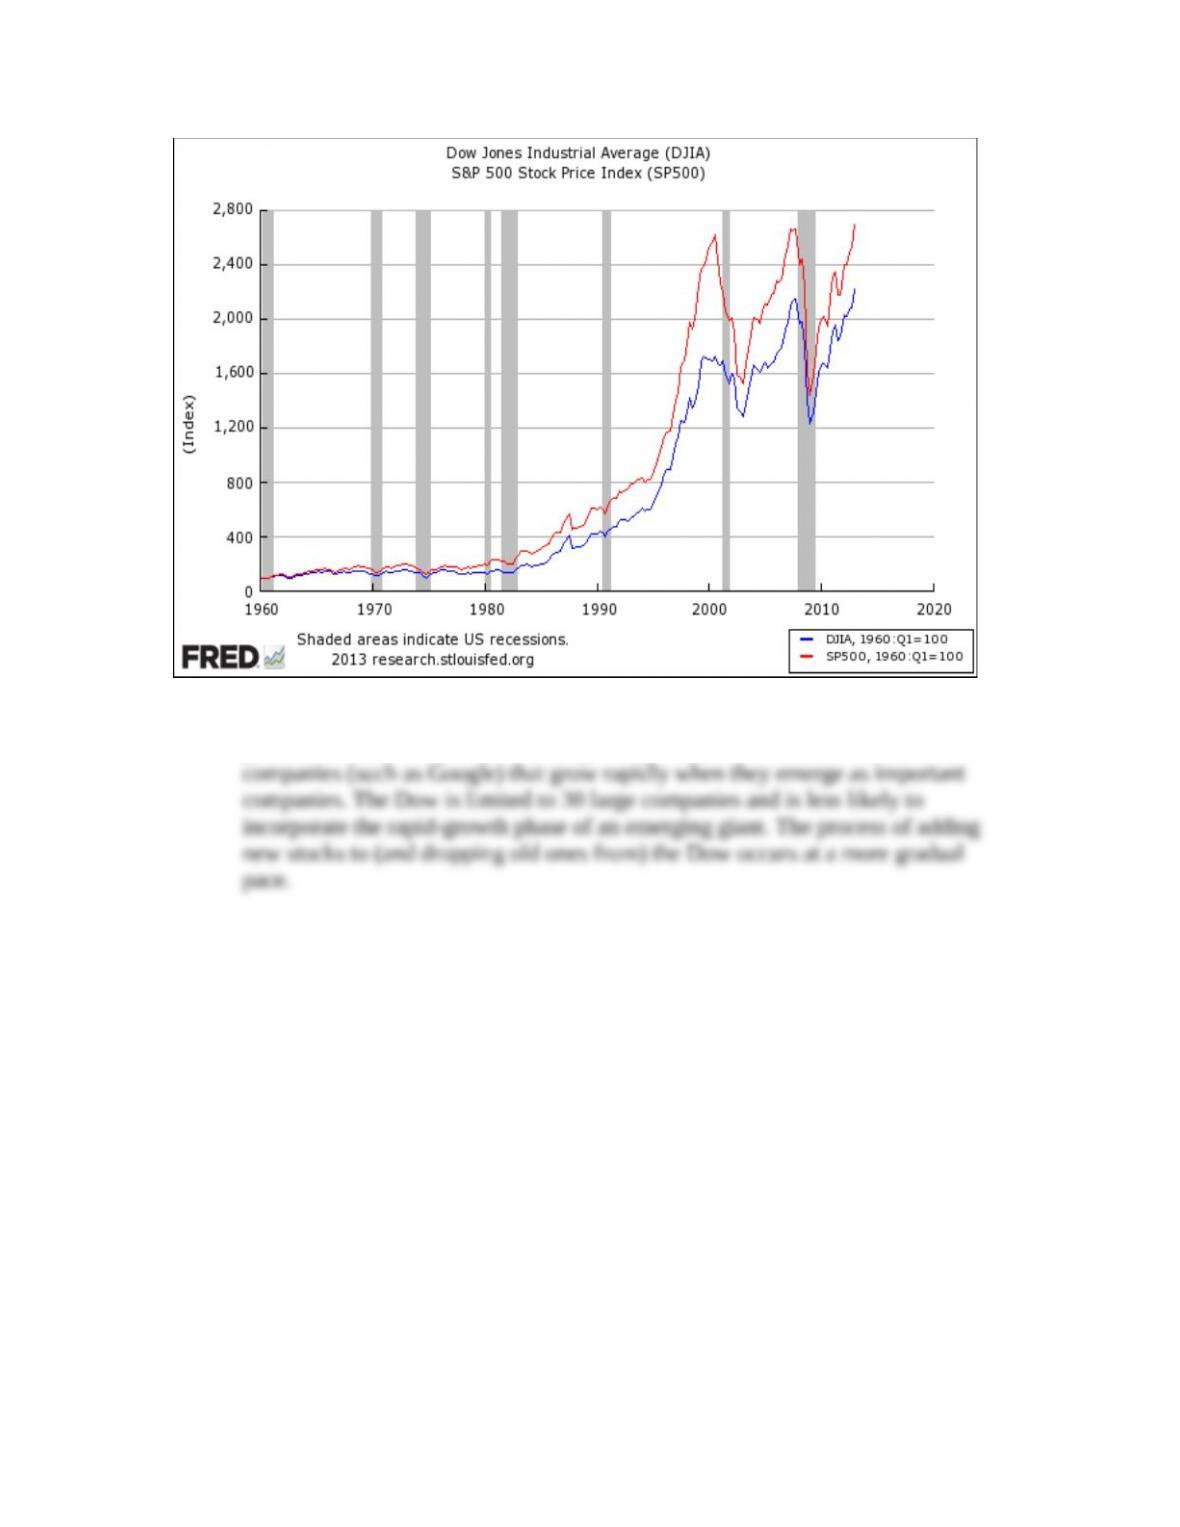
3. Compare and contrast the evolution of two leading stock indexes. Plot since 1960 on a
quarterly basis the Dow Jones Industrial Average (FRED code: DJIA) and the S&P 500
(FRED code: SP500) scaled to a common base quarter of 1960 Q1=100 (LO2)
Answer: The data plot is:
8-8
© 2015 by McGraw-Hill Education. This is proprietary material solely for authorized instructor use. Not authorized for sale or distribution in
any manner. This document may not be copied, scanned, duplicated, forwarded, distributed, or posted on a website, in whole or part.
Chapter 08 – Stocks, Stock Markets, and Market Efficiency
Scaling each index to begin at 100 in 1960 shows the rise in the S&P 500 has
greater than on the Dow Jones average. Over time, the S&P index includes newer
4. The Dow Jones Industrial Average (FRED code: DJIA) is a price-weighted index of 30
stocks and the S&P 500 index (FRED code: SP500) is a value-weighted average of 500
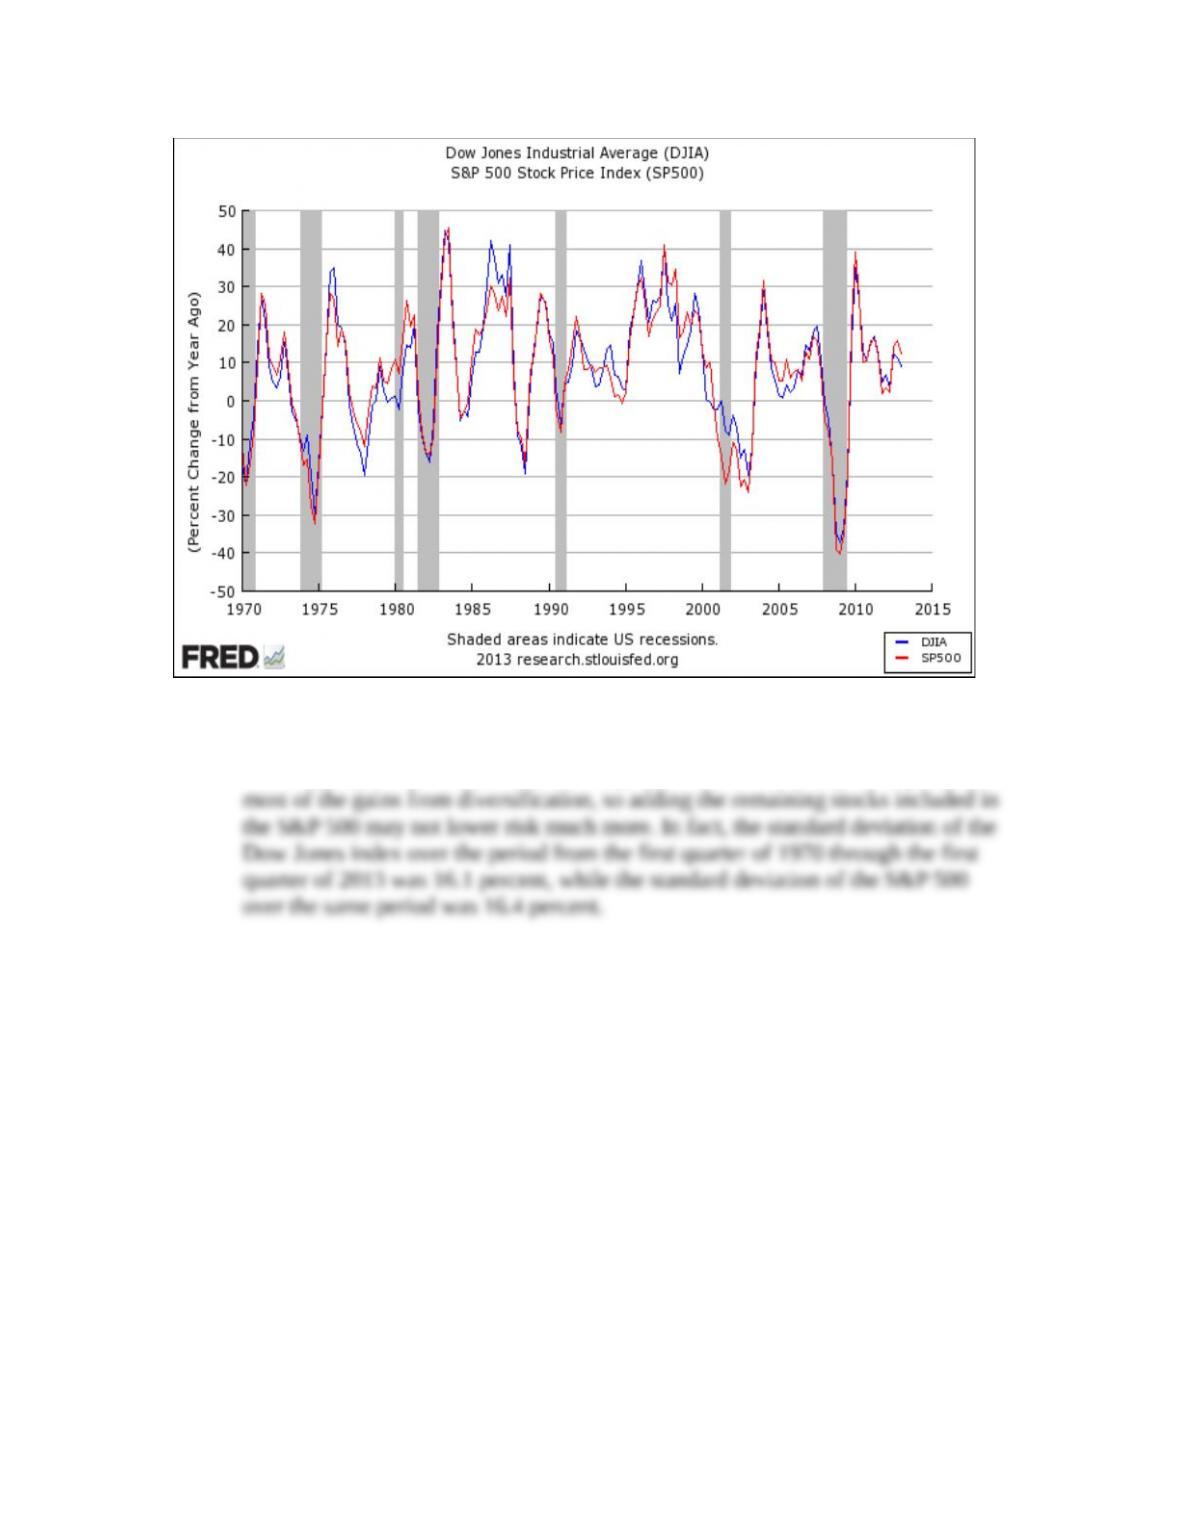
stocks. Find out which is more volatile. Plot on a quarterly basis since 1970 the percent
change from a year ago of each index. Download the data and compute the standard
deviation for each series over the period. (LO3) (Hints: At the FRED Web site, click on
“Data Tools” and then “Create Your Own Graphs.” In the “Add Data Series” box, input
the code for the Dow (FRED code: DJIA). Next, set the start date to January 1970 in the
“Observation Date Range” box, select “Quarterly” in the Frequency box, choose
“Percent Change from Year Ago” in the Units box, and click “Redraw Graph.” Next, at
“Add Data Series,” repeat these procedures for the S&P500 (FRED code: SP500). Then,
download the data to a spreadsheet.)
Answer: The plot is:
8-9
© 2015 by McGraw-Hill Education. This is proprietary material solely for authorized instructor use. Not authorized for sale or distribution in
any manner. This document may not be copied, scanned, duplicated, forwarded, distributed, or posted on a website, in whole or part.
Chapter 08 – Stocks, Stock Markets, and Market Efficiency
The principle of diversification (“spreading of risks”) might encourage you to
expect the variability of the S&P 500 to be lower than that of the Dow Jones.
However, a portfolio of 20 to 30 stocks spread across industries probably captures
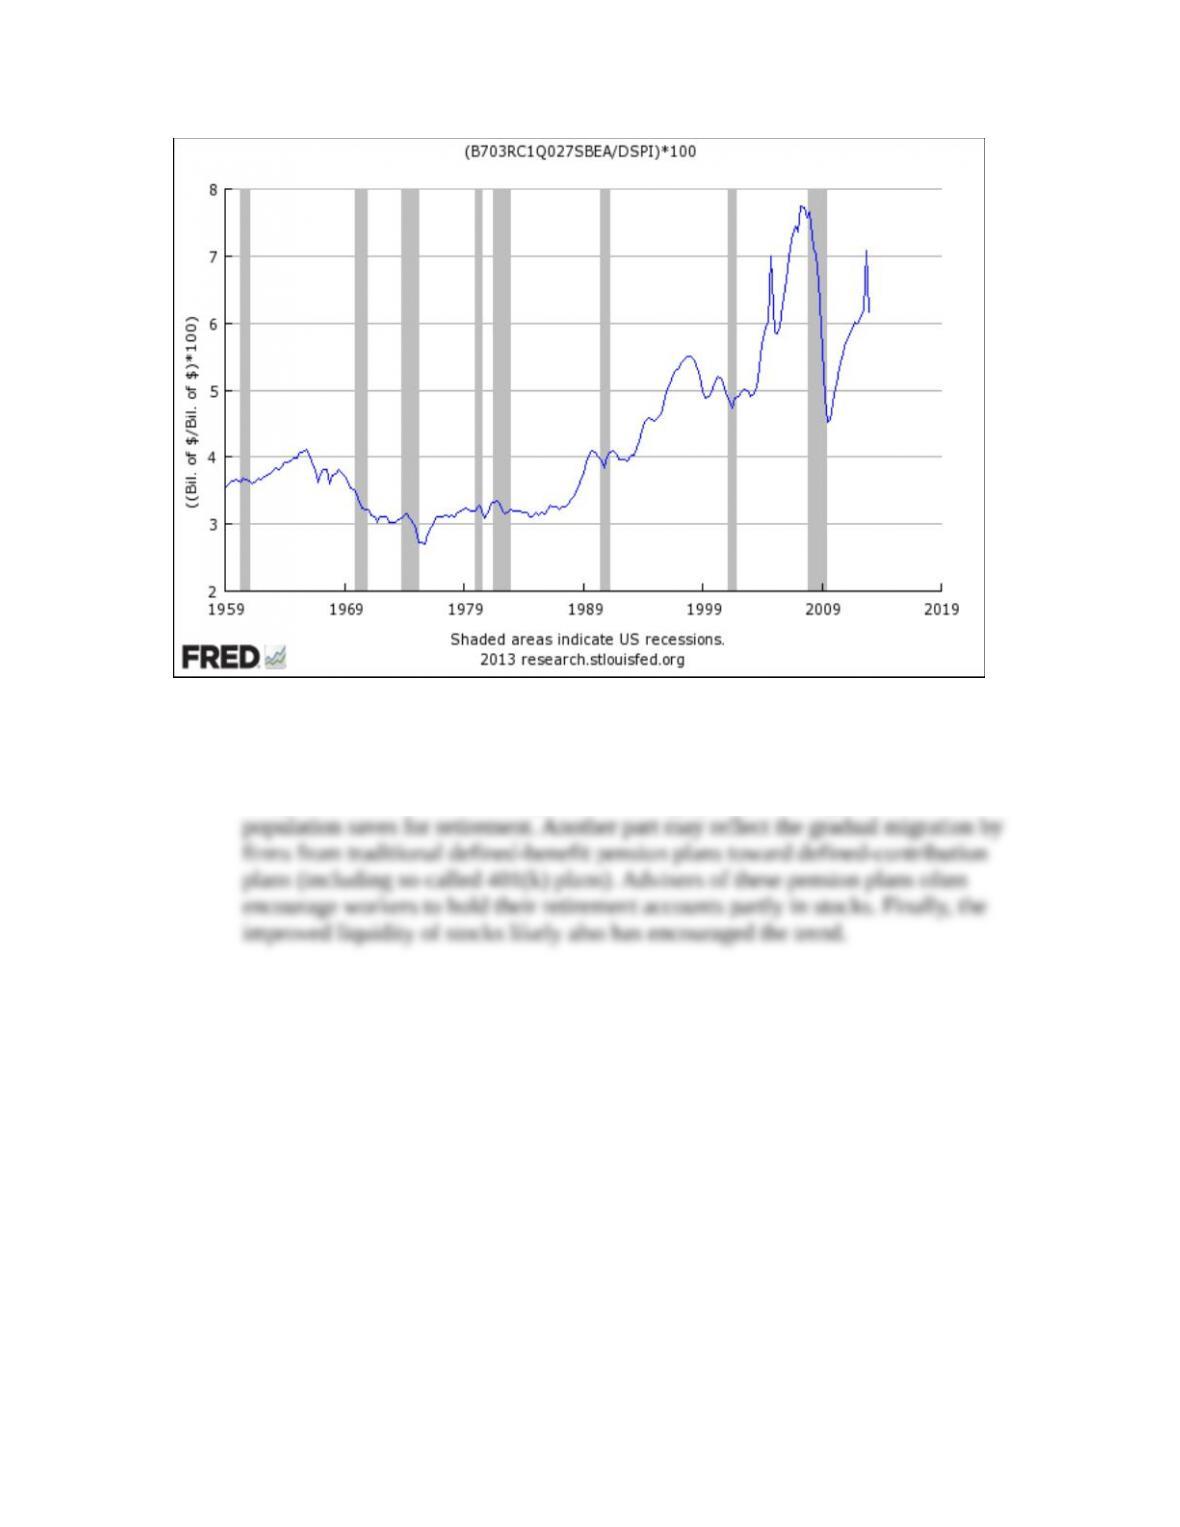
5. Have stock dividends become a more important source of income to U.S. households?
Plot since 1959 the share of dividend income (FRED code: B703RC1Q027SBEA) in
personal disposable income (FRED code: DSPI). Can you explain the 50-year trend?
(LO5) (Hints: At the FRED Web site, click on “Data Tools” and then “Create Your Own
Graphs.” In the “Add Data Series” box, input the code for personal dividend income
(FRED code: B703RC1Q027SBEA). Change the start observation to January 1959 at the
“Observation Date Range” box. Go to the “Add Data Series” box again, click on the
“Line 1” button, and then input the code for disposable personal income (FRED code:
DSPI). At the Formula box, input “(a / b)*100” (without the quotes) and then select
“Redraw Graph.”)
Answer: The data plot is:
8-10
© 2015 by McGraw-Hill Education. This is proprietary material solely for authorized instructor use. Not authorized for sale or distribution in
any manner. This document may not be copied, scanned, duplicated, forwarded, distributed, or posted on a website, in whole or part.
Chapter 08 – Stocks, Stock Markets, and Market Efficiency
Several factors may explain the rise in dividend income as a proportion of
disposable income. Ownership of equity has become much more widespread over
this period. Part of that shift may reflect demographics, as a larger share of the
* indicates more difficult problems
8-11
© 2015 by McGraw-Hill Education. This is proprietary material solely for authorized instructor use. Not authorized for sale or distribution in
any manner. This document may not be copied, scanned, duplicated, forwarded, distributed, or posted on a website, in whole or part.