Chapter 07 – The Risk and Term Structure of Interest Rates
Chapter 7
The Risk and Term Structure of Interest Rates
Conceptual and Analytical Problems
1. Consider a firm that issued a large quantity of commercial paper in the period leading
to a financial crisis. (LO1)
a. How would you expect the credit rating of the commercial paper to evolve as
the crisis unfolds?
b. Would you alter your prediction if, rather than commercial paper, the firm was
instead issuing asset-backed commercial paper?
Answer:
a. Commercial paper is generally issued without collateral, so that its rating will
2. Suppose that a major foreign government defaults on its debt. What, if anything, will
happen to the position and slope of the U.S. yield curve? (LO2)
Answer: If Treasury debt is a substitute for the foreign government debt, then U.S.
yield curve would shift downward, reflecting a flight to quality. If the holders of the
3. What was the connection between house price movements, the growth in subprime
mortgages, and securities backed by these mortgages—on the one hand—and on the
other hand—the difficulties encountered by some financial institutions during the
2007-2009 financial crisis? (LO1)
Answer: The viability of many subprime mortgages – and in particular ARMs –
depended on being able to refinance the loan before the interest rate reset to a higher
level. When house prices began to fall in 2006, pushing home values below the loan
7-1
Copyright © 2015 McGraw-Hill Education. All rights reserved. No reproduction or distribution without the prior written consent of
McGraw-Hill Education.
Chapter 07 – The Risk and Term Structure of Interest Rates
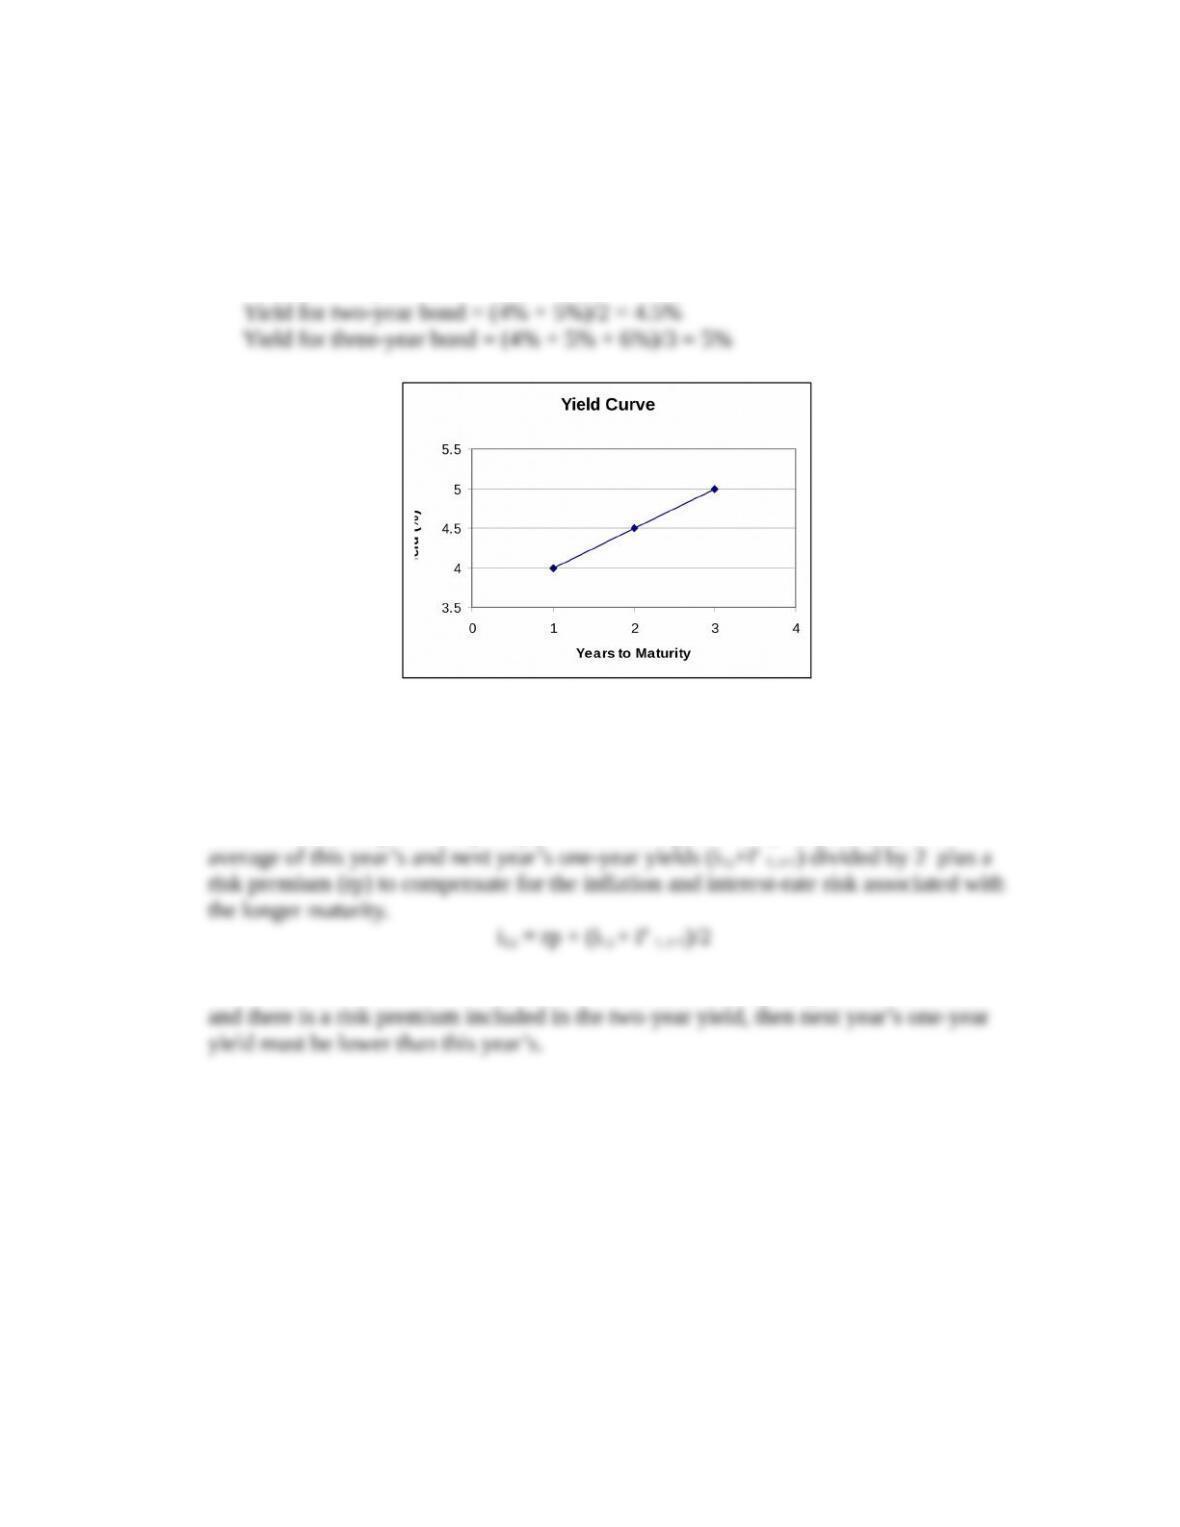
4. Suppose that the interest rate on one-year bonds is currently 4 percent and is expected
to be 5 percent in one year and 6 percent in two years. Using the Expectations
Hypothesis, compute the yield curve for the next three years. (LO2)
Answer:
Yield for one-year bond = 4%
5. *According to the liquidity premium theory, if the yield on both one-and two-year
bonds are the same, would you expect the one-year yield in one-year’s time to be
higher, lower or the same? Explain your answer. (LO2)
Answer: According to the liquidity premium theory, the two-year yield (i2,t) is an
As we can see from the formula, if the current one-and two-year yields are the same
6. You have $1,000 to invest over an investment horizon of three years. The bond
market offers various options. You can buy (i) a sequence of three one-year bonds;
(ii) a three-year bond; or (iii) a two-year bond followed by a one-year bond. The
current yield curve tells you that the one-year, two-year, and three-year yields to
maturity are 3.5 percent, 4.0 percent, and 4.5 percent respectively. You expect that
one-year interest rates will be 4 percent next year and 5 percent the year after that.
Assuming annual compounding, compute the return on each of the three investments,
and discuss which one you would choose. (LO2)
Answer:
7-2
Copyright © 2015 McGraw-Hill Education. All rights reserved. No reproduction or distribution without the prior written consent of
McGraw-Hill Education.
Chapter 07 – The Risk and Term Structure of Interest Rates
Expected return for (i) = (1.035)*(1.04)*(1.05) – 1 = 13.02%
The second and third options have higher expected returns than the first, but both
options involve investing in longer-term bonds (3-year and 2-year bonds,
respectively). Long-term bonds have higher inflation risk and interest-rate risk;
7. Suppose that the yield curve shows that the one-year bond yield is 3 percent, the
two-year yield is 4 percent, and the three-year yield is 5 percent. Assume that the risk
premium on the one-year bond is zero, the risk premium on the two-year bond is 1
percent, and the risk premium on the three-year bond is 2 percent. (LO2)
a. What are the expected one-year interest rates next year and the following
year?
b. If the risk premiums were all zero, as in the Expectations Hypothesis, what
would the slope of the yield curve be?
Answer:
which implies that the one-year interest rate next year will be 0.03. Using this
result, with a risk premium on the three-year bond of 0.02, we have:
8. *If inflation and interest rates become more volatile, what would you expect to see
happen to the slope of the yield curve? (LO2)
Answer: Investors are likely to demand a higher risk premium in the face of increased
7-3
Copyright © 2015 McGraw-Hill Education. All rights reserved. No reproduction or distribution without the prior written consent of
McGraw-Hill Education.
Chapter 07 – The Risk and Term Structure of Interest Rates
9. As economic conditions improve in countries with emerging markets, the cost of
borrowing funds there tends to fall. Explain why. (LO3)
Answer: As economic conditions improve, the chance that businesses will default on
10. Suppose your local government, threatened with bankruptcy, decided to tax the
interest income on its own bonds as part of an effort to rectify serious budgetary
woes. What would you expect to see happen to the yields on these bonds? (LO1)
Answer: You would expect the yields to rise to compensate investors for the loss of
11. *If, before the change in tax status, the yields on the bonds described in question 10
were below the Treasury yield of the same maturity, would you expect this spread to
narrow, to disappear, or to change sign after the policy change? Explain your answer.
(LO1)
Answer: We can attribute the lower yields on the local government bonds versus
Treasury issues to their tax-exempt status, as investors would view the federal
12. Suppose the risk premium on U.S. corporate bonds increases. How would the change
affect your forecast of future economic activity, and why? (LO3)
Answer: An increasing risk premium can be a sign of an impending recession, so you
13. If regulations restricting institutional investors to investment grade bonds were lifted,
what do you think would happen to the spreads between yields on investment grade
and speculative grade bonds? (LO1)
Answer: If institutional investors were willing to hold speculative-grade bonds in the
7-4
Copyright © 2015 McGraw-Hill Education. All rights reserved. No reproduction or distribution without the prior written consent of
McGraw-Hill Education.
Chapter 07 – The Risk and Term Structure of Interest Rates
14. Suppose a country with a struggling economy suddenly discovered vast quantities of
valuable minerals under government-owned land. How might the government’s bond
rating be affected? Using the model of demand and supply for bonds, what would
you expect to happen to the bond yields of that country’s government bonds? (LO3)
Answer: The ratings of the bonds would likely be upgraded, as the economic outlook
for the economy would improve and the reduction in the perceived riskiness of the
15. The misrating of mortgage-backed securities by rating agencies contributed to the
financial crisis of 2007-2009. List some recommendations you would make to avoid
such mistakes in the future. (LO1)
Answer: In the run-up to the 2007-2009 crisis, the absence of data capturing a period
of falling house prices at a national level caused models to underestimate the default
risk of the mortgages underlying the mortgage-backed securities. Running tests to
16. How do you think the abolition of investor protection laws would affect the risk
spread between corporate and government bonds? (LO1)
Answer: These laws were likely to be much more important in protecting purchasers
17. You and a friend are reading The Wall Street Journal and notice that the Treasury
yield curve is slightly upward sloping. Your friend comments that all looks well for
the economy but you are concerned that the economy is heading for trouble.
Assuming you are both believers in the liquidity premium theory, what might account
for your difference of opinion? (LO3)
7-5
Copyright © 2015 McGraw-Hill Education. All rights reserved. No reproduction or distribution without the prior written consent of
McGraw-Hill Education.
Chapter 07 – The Risk and Term Structure of Interest Rates
Answer: The difference in opinion could reflect different views on the size of the risk
premium. If the risk premium is large enough, a slightly upward-sloping yield curve
18. Do you think the term spread was an effective predictor of the recession that started in
December 2007? Why or why not? (LO3)
Answer: An inverted yield curve (negative term spread) is often a sign that the
economy is about to go into recession. Looking at the term spread (10-year yield
19. *Given the data in the accompanying table, would you say that this economy is
heading for a boom or for a recession? Explain your choice. (LO3)
3-month
Treasury-bill
10-year
Treasury bond
Baa corporate
10-year bond
January 1.00% 3.0% 7.0%
Answer: The information in both the term structure and the risk structure point to a
healthy economy. The term spread (the gap between the 10-year Treasury bond yield
The risk spread (the gap between the Treasury and corporate 10 year bonds) is
Data Exploration
7-6
Copyright © 2015 McGraw-Hill Education. All rights reserved. No reproduction or distribution without the prior written consent of
McGraw-Hill Education.
Chapter 07 – The Risk and Term Structure of Interest Rates
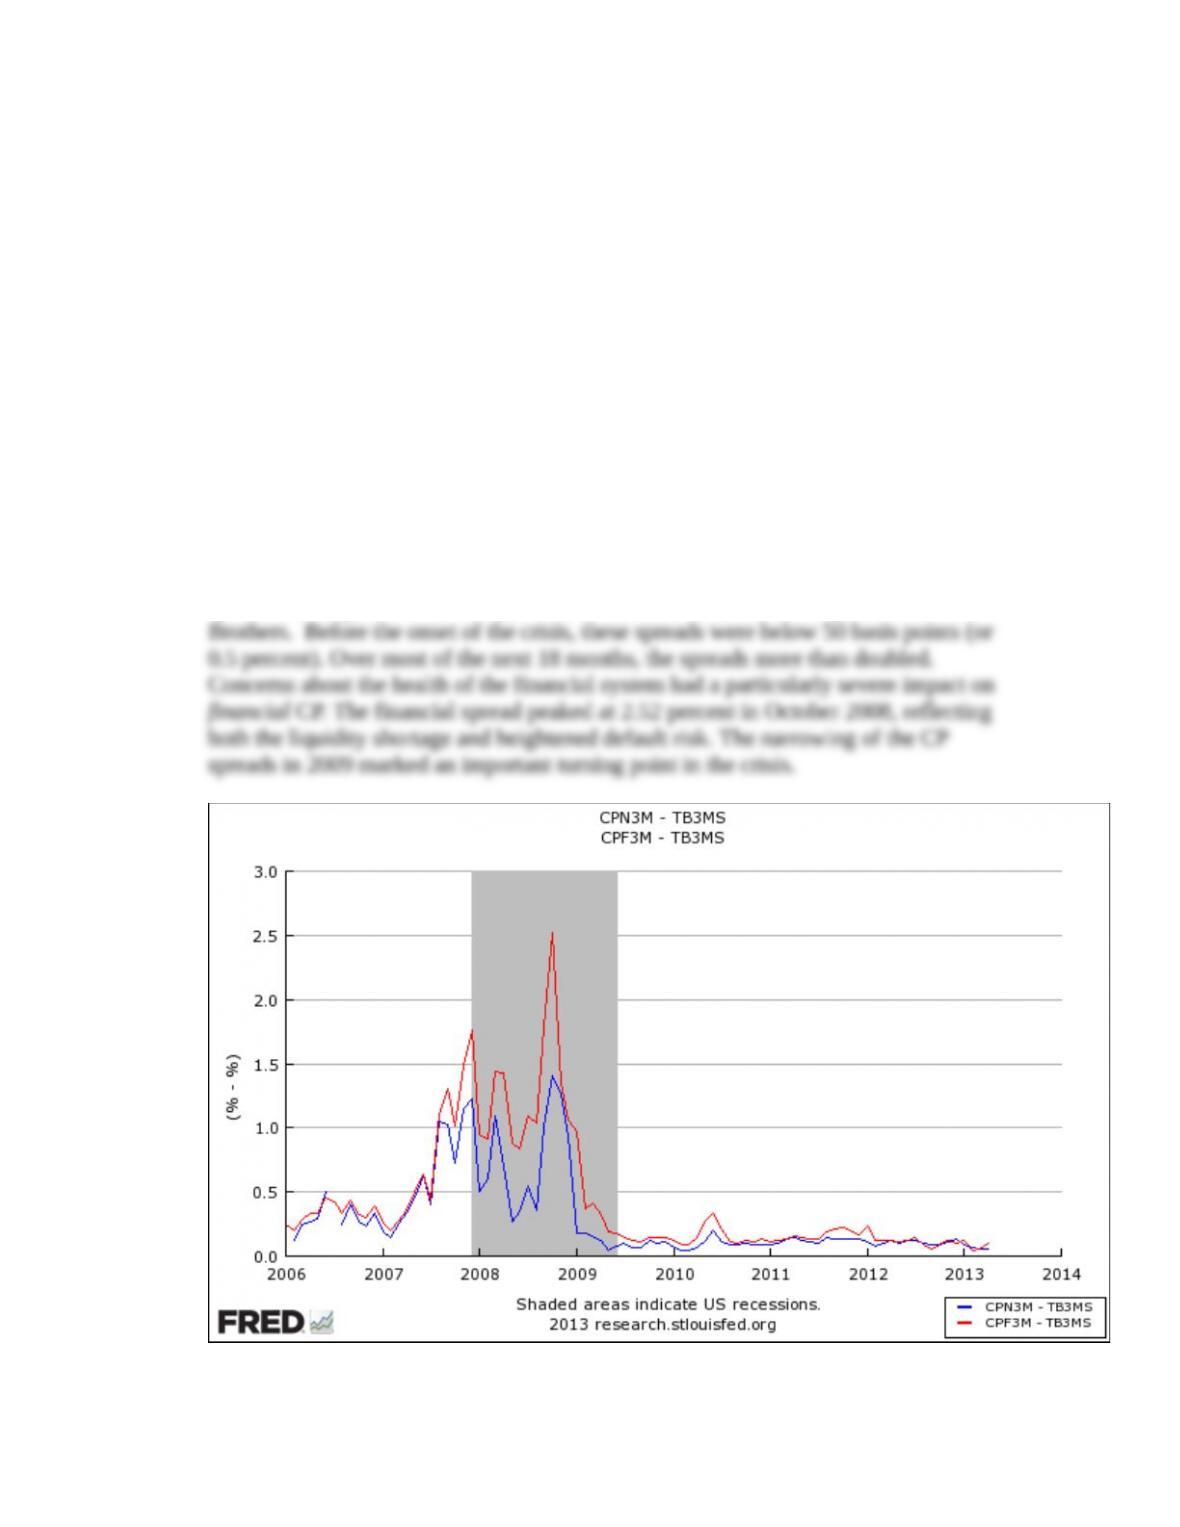
1. Did the financial crisis of 2007-2009 affect financial and nonfinancial firms to the
same extent? For the period beginning in 2006, plot the spread between the interest
rates on three-month non-financial commercial paper (FRED code: CPN3M) and
three-month Treasury bills (FRED code: TB3MS). Plot a similar spread using the
interest rates on three-month financial commercial paper (FRED code: CPF3M) and
Treasury bills (FRED code: TB3MS). Compare the evolution of these two spreads.
(LO1) (Hints: At the FRED Web site, select “Data Tools” and then “Create Your
Own Graph.” Type in the code for the non-financial commercial paper (FRED code:
CPN3M) and then set the “Observation Date Range” to begin in January 2006. Go
to “Add Data Series,” select the “Line 1” button, and then type in the code for the
Treasury bill rate (FRED code: TB3MS). At the formula box type in “a – b” (without
the quotes) and then select “Redraw Graph.” Repeat this process for financial
commercial paper (FRED code: CPF3M), but use the “Line 2” button when you
enter TB3MS again.)
Answer: The spreads between commercial paper (CP) rates and the Treasury bill rate
rose significantly in the second half of 2007 as the financial crisis began to unfold and
spiked even higher in the latter part of 2008 in the wake of the collapse of Lehman
7-7
Copyright © 2015 McGraw-Hill Education. All rights reserved. No reproduction or distribution without the prior written consent of
McGraw-Hill Education.
Chapter 07 – The Risk and Term Structure of Interest Rates
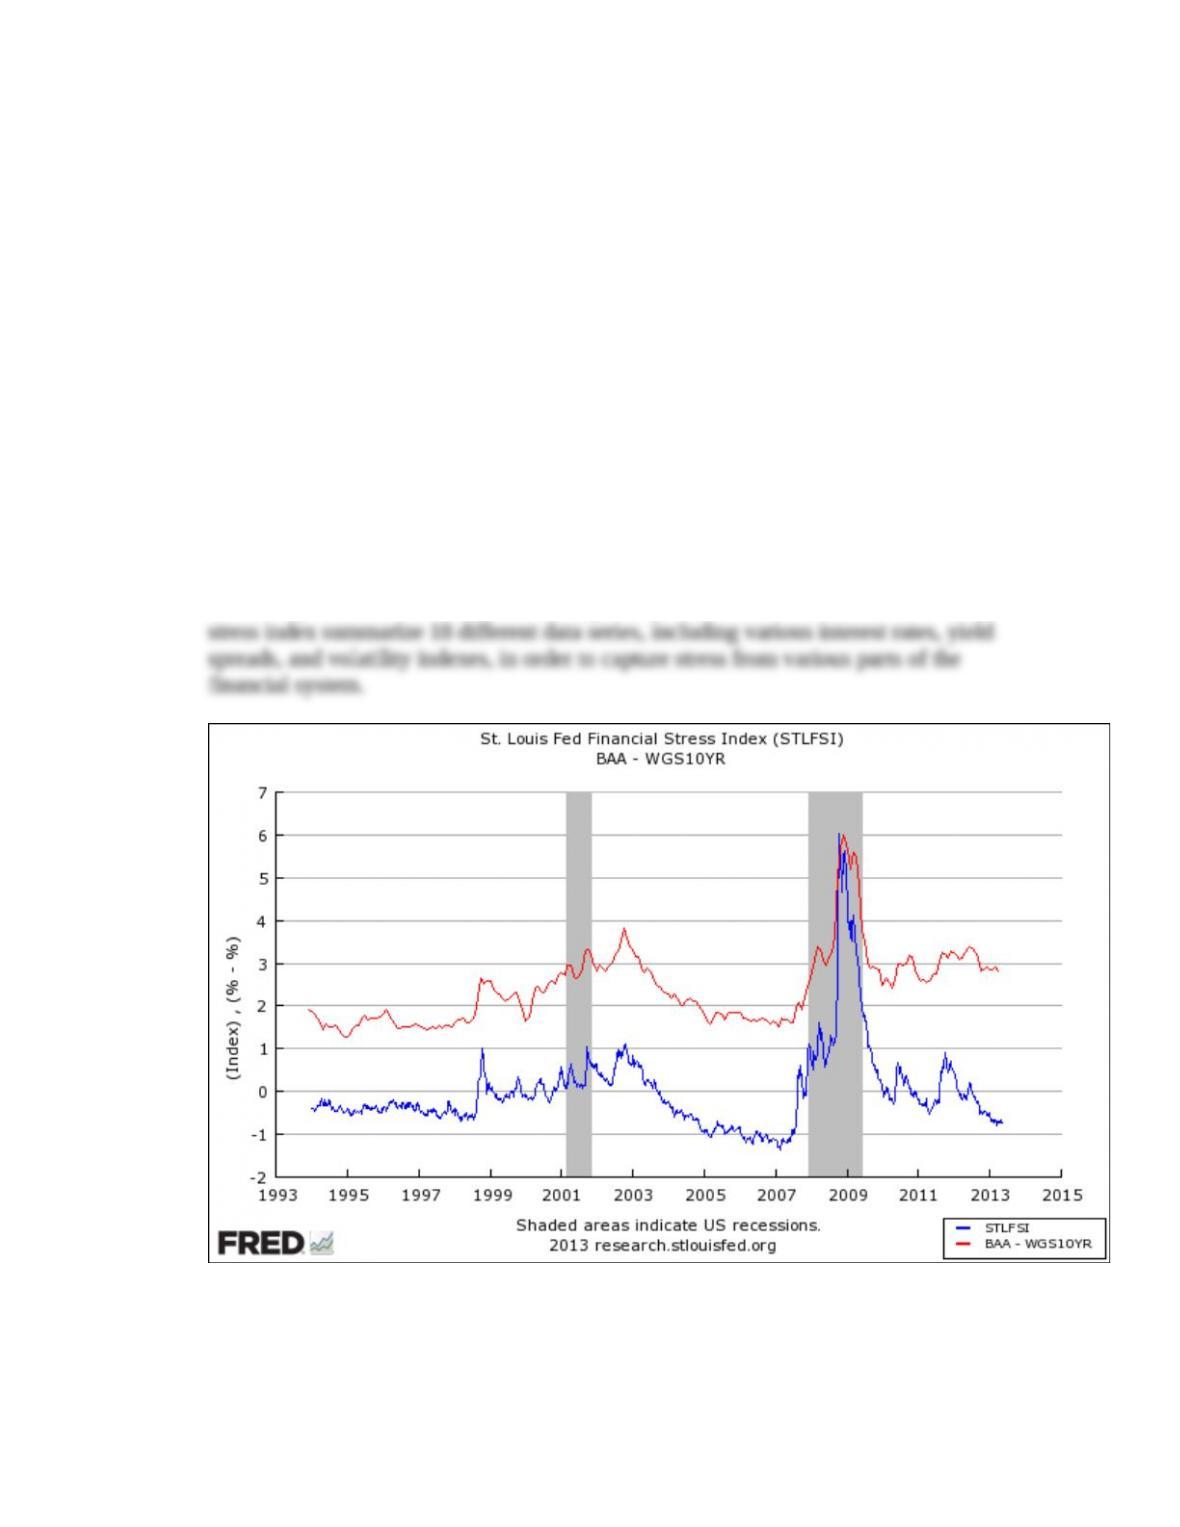
2. The Federal Reserve Bank of St. Louis publishes a weekly index of financial stress
(FRED code: STLFSI) that summarizes strains in financial markets, including
liquidity problems. For the period beginning in 1994, plot this index and, as a second
line, the difference between the Baa bond yield (FRED code: WBAA) and the
10-year U.S. Treasury bond yield (FRED code: WGS10YR). Does the index STLFSI
provide an early warning of stress? (LO3) (Hints: At the FRED Web site, select
“Data Tools” and then “Create Your Own Graph.” Type in the code for the Baa
bonds (FRED code: WBAA). Select “Add Data Series” and the “Line 1” button and
insert the code for the Treasury bond yield (FRED code: WGS10YR). At the formula
box, type in “a – b” (without the quotes) and then select “Redraw Graph.” Go again
to “Add Data Series” and type in the code for the financial stress index (FRED code:
STLFSI). Click “Copy to All Lines” next to the Observation Date Range for this
index. Finally, select “Redraw Graph.”)
Answer: The stress index deteriorated in 2007 before the bond yield spread widened.
It also improved in 2009 before the bond yield spread narrowed. Movements in this
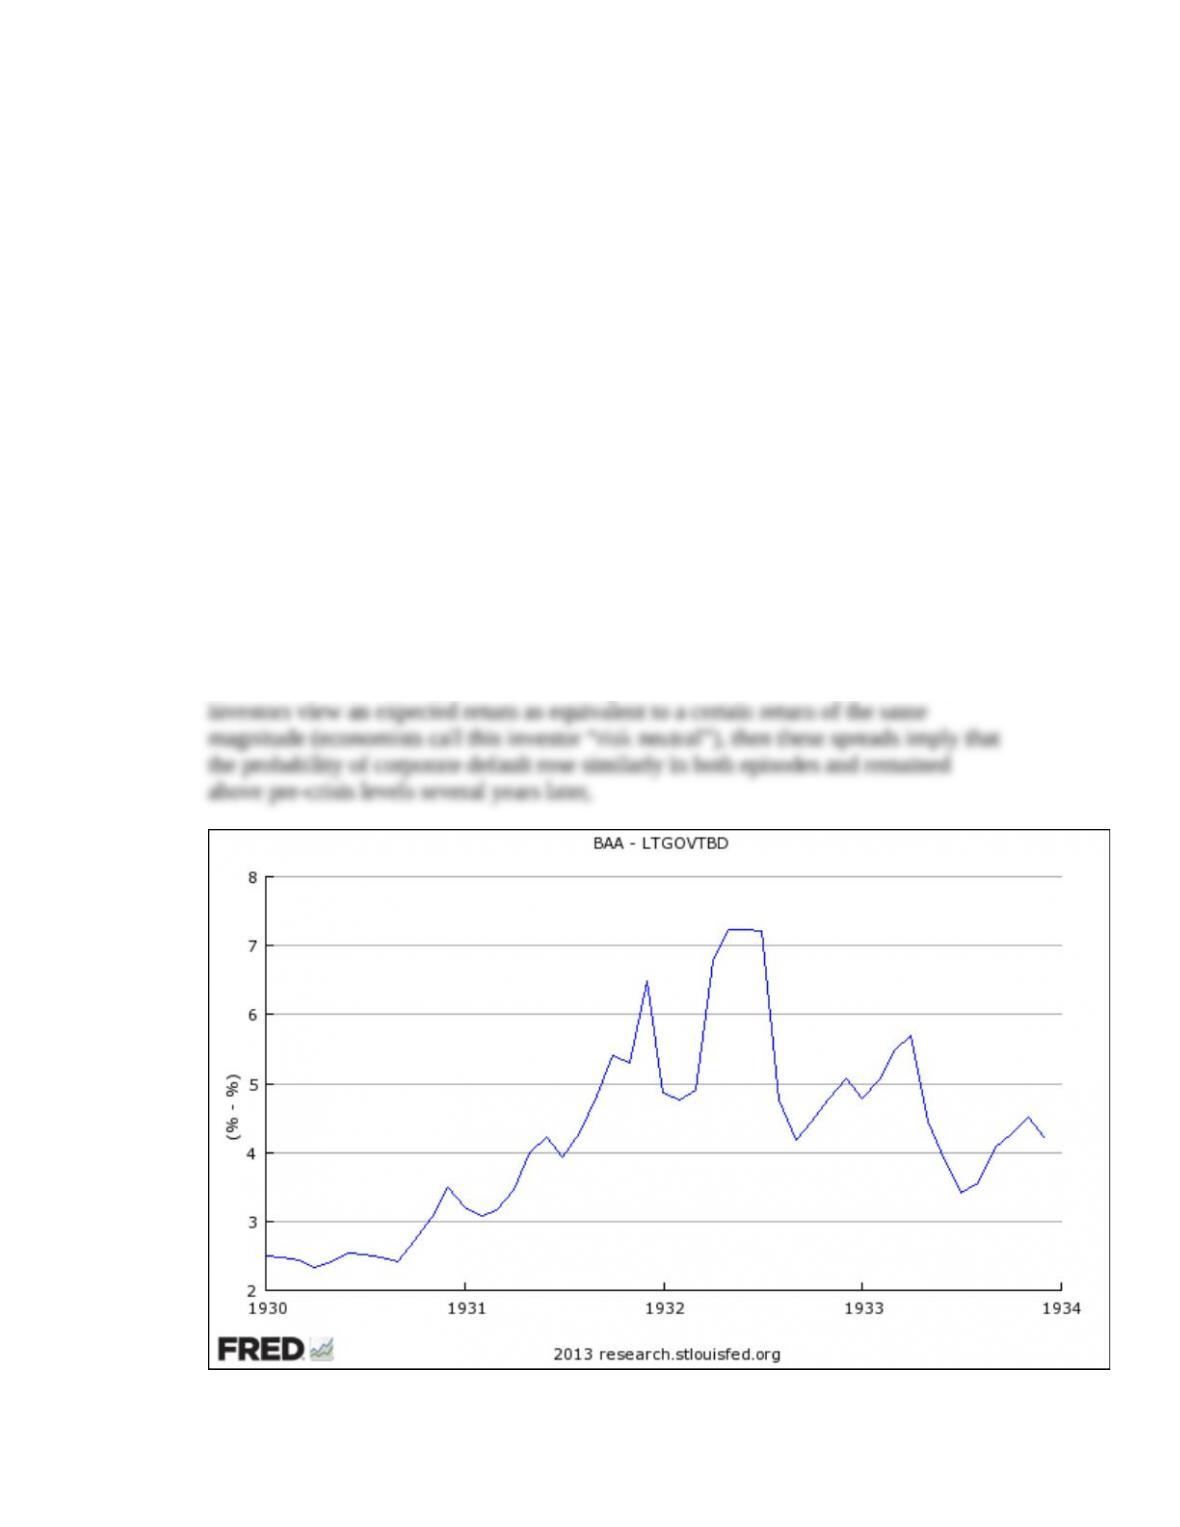
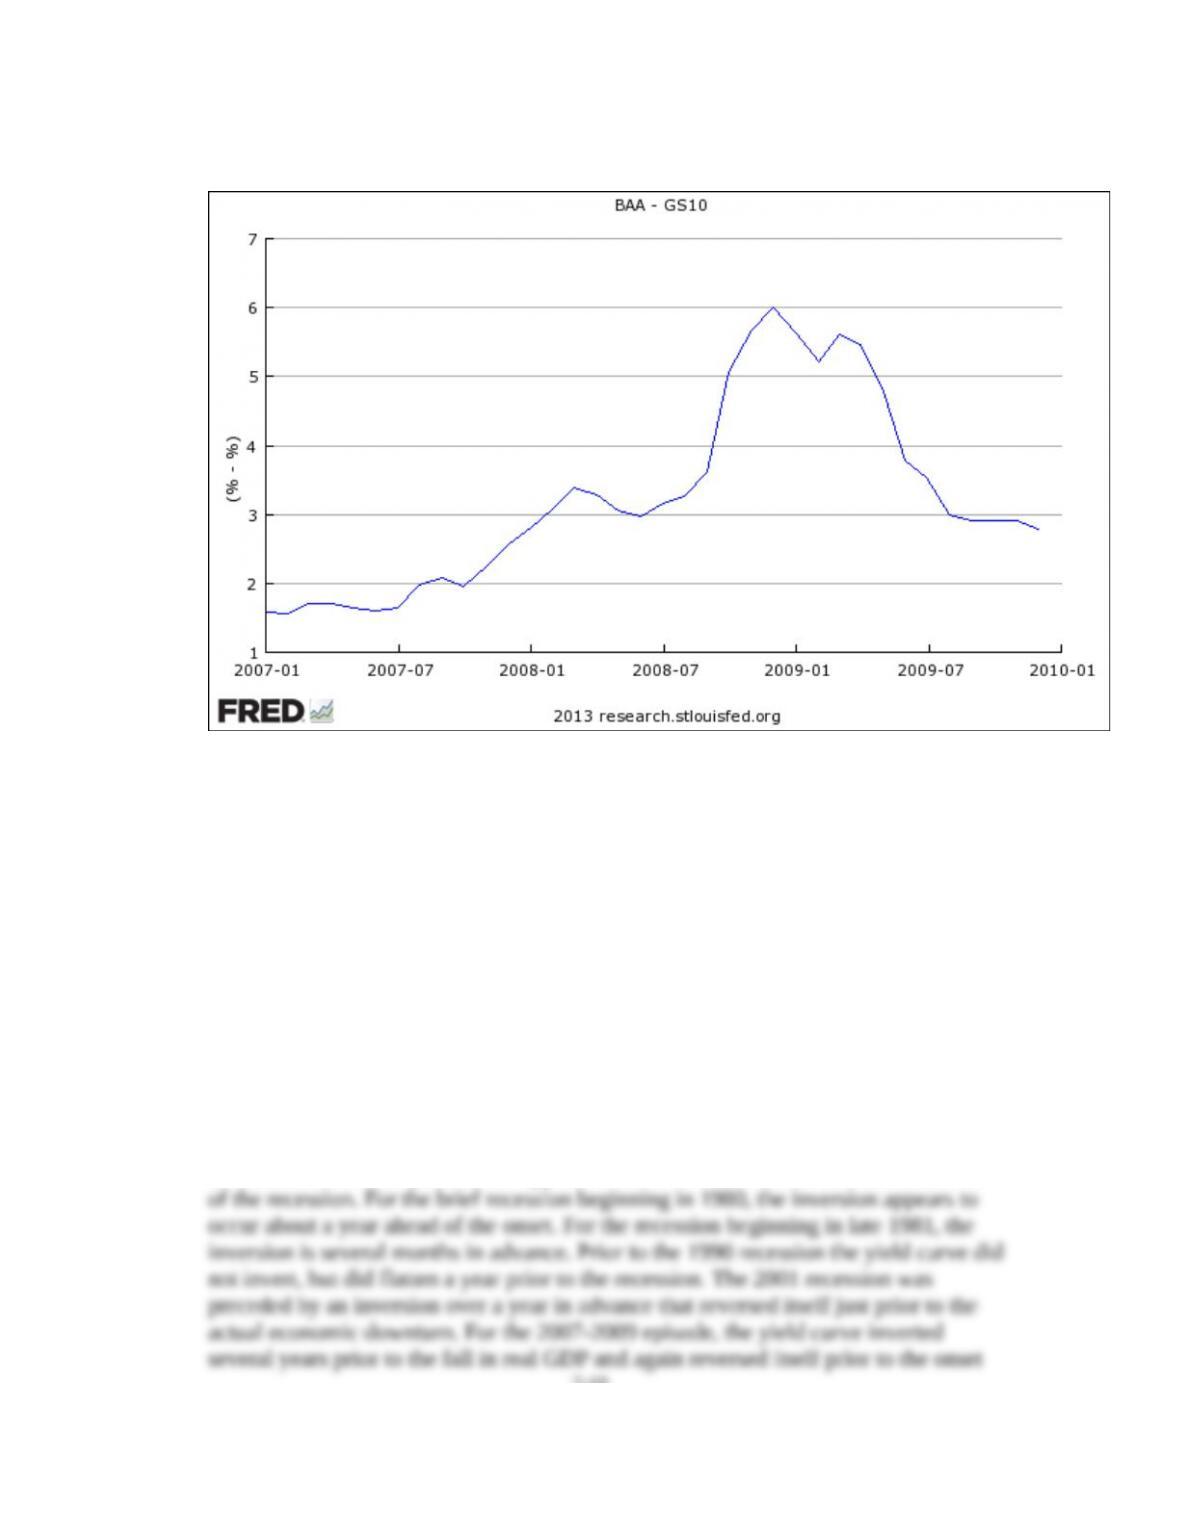
3. How did the Great Depression (1930-33) and the Great Recession of 2007-2009
affect expectations of corporate default? To investigate, construct for each of those
7-8
Copyright © 2015 McGraw-Hill Education. All rights reserved. No reproduction or distribution without the prior written consent of
McGraw-Hill Education.
Chapter 07 – The Risk and Term Structure of Interest Rates
periods a separate plot of the corporate bond yield spread. For the depression period,
plot from 1930 to1933 to the difference between the Baa corporate bond yield (FRED
code: BAA) and a long-term Treasury bond yield (FRED code: LTGOVTBD). For the
Great Recession, plot from 2007 to 2009 the difference between the Baa yield (FRED
code: Baa) and the 10-year Treasury bond yield (FRED code: GS10). Compare the
plots. (LO1) (Hints: For the first plot, at the FRED website, select “Data Tools,”
then “Create Your Own Graphs.” At the “Graph” settings, turn off the recession
bars. In the “Add Data Series” box, type in the Baa bond yield code (FRED code:
BAA). Select “Add Data Series” again, select the “Line 1” button, and type in the
Treasury bond yield code (FRED code: LTGOVTBD). In the formula box, type in “a
– b” (without the quotes) and then select “Redraw Graph.” Finally, set the
observation range from January, 1930 to December, 1933 and then “Redraw
Graph.” For the second graph, start afresh by typing the Baa bond yield code (FRED
code: BAA) in the search box under “Add Data Series.” Choose “Add Data Series”
again, select the “Line 1” button, and type in the 10-year Treasury bond yield code
(FRED code: GS10). In the formula box, type in “a – b” (without the quotes) and
select “Redraw Graph.” Finally, select the Observation Date Range from January,
2007 to December, 2009, and choose “Redraw Graph.”)
Answer: The two data plots are below. The patterns are quite similar, though the risk
spread was modestly larger in the Great Depression than in the Great Recession. If
7-9
Copyright © 2015 McGraw-Hill Education. All rights reserved. No reproduction or distribution without the prior written consent of
McGraw-Hill Education.
Chapter 07 – The Risk and Term Structure of Interest Rates
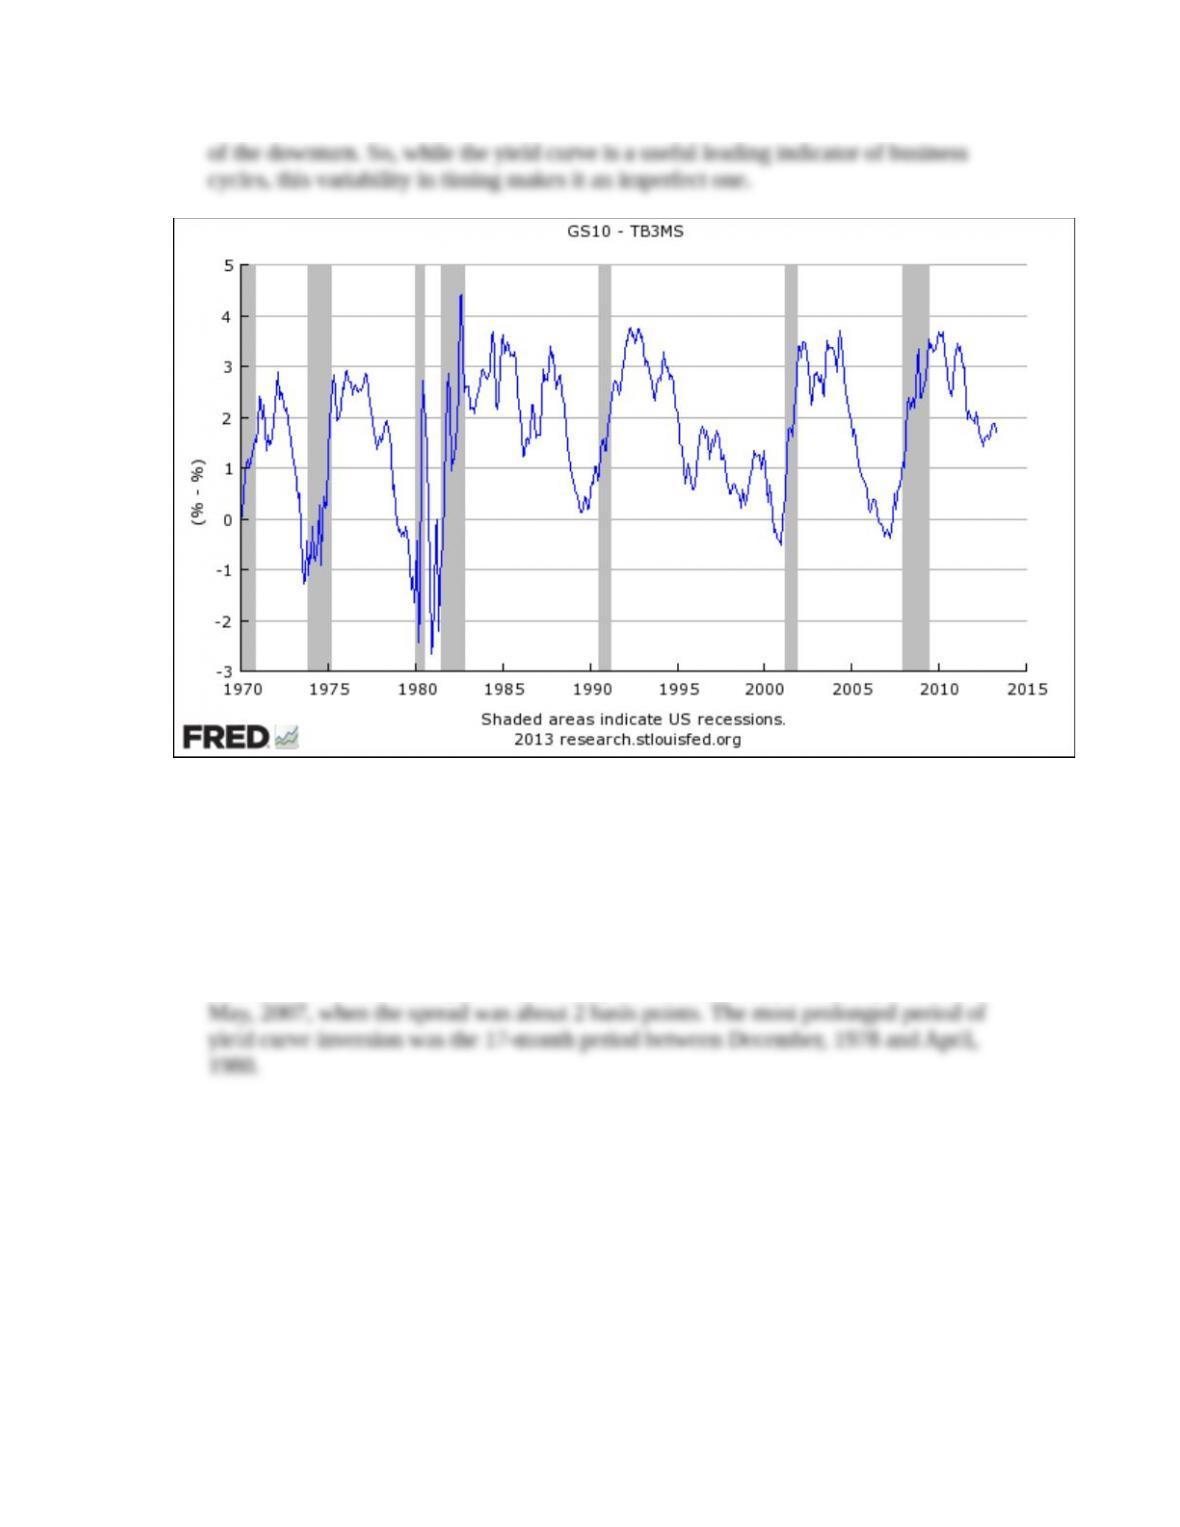
4. How reliably does an inverted yield curve anticipate a recession? How far in
advance? Plot from 1970 (as in Figure 7.9A) the difference between the 10-year
Treasury yield (FRED code: GS10) and the three-month Treasury bill rate (FRED
code: TB3MS). Discuss the variability of the time between an inversion of the yield
curve and the subsequent recession. (LO3) (Hints: At the FRED Web site, select
“Data Tools” and then “Create Your Own Graph.” Type in the code for the 10-year
Treasury yield (FRED code: GS10). Go to “Add Data Series,” select the “Line 1”
button, and insert the code for the Treasury bill rate (FRED code: TB3MS). At the
formula box type in “a – b” (without the quotes), set the start date of 1970 in the
Observation Date Range box, and select “Redraw Graph .”)
Answer: The data plot is below. The yield curve inverts when the term spread
becomes negative, so we examine the spread for values around zero. Prior to the
downturn in 1973 the yield curve appears to have inverted several months in advance
7-10
Copyright © 2015 McGraw-Hill Education. All rights reserved. No reproduction or distribution without the prior written consent of
McGraw-Hill Education.
Chapter 07 – The Risk and Term Structure of Interest Rates
5. Download the data used in Data Exploration Problem 4 and (a) find the most recent
period for which the yield curve was (approximately) flat and (b) the longest time
period for which yield curve was inverted. (LO2) (Hint: Above the graph produced in
Data Exploration Problem 4, click on “Download Data in Graph” and examine the
resulting spreadsheet.)
Answer: The most recent period when the yield curve was approximately flat was in
* indicates more difficult problems
7-11
Copyright © 2015 McGraw-Hill Education. All rights reserved. No reproduction or distribution without the prior written consent of
McGraw-Hill Education.