Chapter 05 – Understanding Risk
9. Looking again at the investment described in question 15, what is the maximum
leverage ratio you could have and still have enough to repay the loan in the event the
bad outcome occurred? (LO1, LO2)
Answer: The bad outcome pays off $800 per $1000 invested, so you lose $200 per
$1000 invested. Therefore, the maximum leverage ratio you could have is 5.
10. Consider two possible investments whose payoffs are completely independent of one
another. Both investments have the same expected value and standard deviation. If
you have $1,000 to invest, could you benefit from dividing your funds between these
investments? Explain your answer. (LO4)
Answer: Yes. Even though the investments have the same standard deviation, by
spreading your $1000 across both of them, you reduce your risk. Intuitively, you are
11. *Suppose, as in Problem 17, that there were ten independent investments available
rather than just two. Would it matter if you spread your $1,000 across these 10
investments rather than two? (LO4)
Answer: Yes. The gains from spreading would be larger if you spread the $1000
12. You are considering three investments, each with the same expected value and each
with two possible payoffs. The investments are sold only in increments of $500. You
have $1,000 to invest and so you have the option of either splitting your money
equally between two of the investments or placing all $1,000 in one of the
investments. If the payoffs from investment A are independent of the payoffs from
investments B and C and the payoffs from B and C are perfectly negatively correlated
with each other (meaning when B pays off, C doesn’t and vice versa), which
investment strategy will minimize your risk? (LO4)
Answer: You should put $500 into each of B and C. Because one pays off when the
13. In which of the following cases would you be more likely to decide whether to take
on the risk involved by looking at a measure of the value at risk? (LO2)
5-1
© 2015 by McGraw-Hill Education. This is proprietary material solely for authorized instructor use. Not authorized for sale or distribution in
any manner. This document may not be copied, scanned, duplicated, forwarded, distributed, or posted on a website, in whole or part.
Chapter 05 – Understanding Risk
a) You are unemployed and are considering investing your life savings of
$10,000 to start up a new business.
b) You have a full-time job paying $100,000 a year and are considering making a
$1,000 investment in stock of a well-established, stable company.
Explain your reasoning.
Answer: You should be more concerned about the value at risk – a measure of the
21. You have the option to invest in either country A or country B but not both. You carry
out some research and conclude that the two countries are similar in every way except
that the returns on assets of different classes tend to move together much more in
country A– that is, they are more highly correlated in country A than in country B.
Which country would choose to invest in and why? (LO4)
Answer: You should invest in country B as the benefits from diversification are
Data Exploration
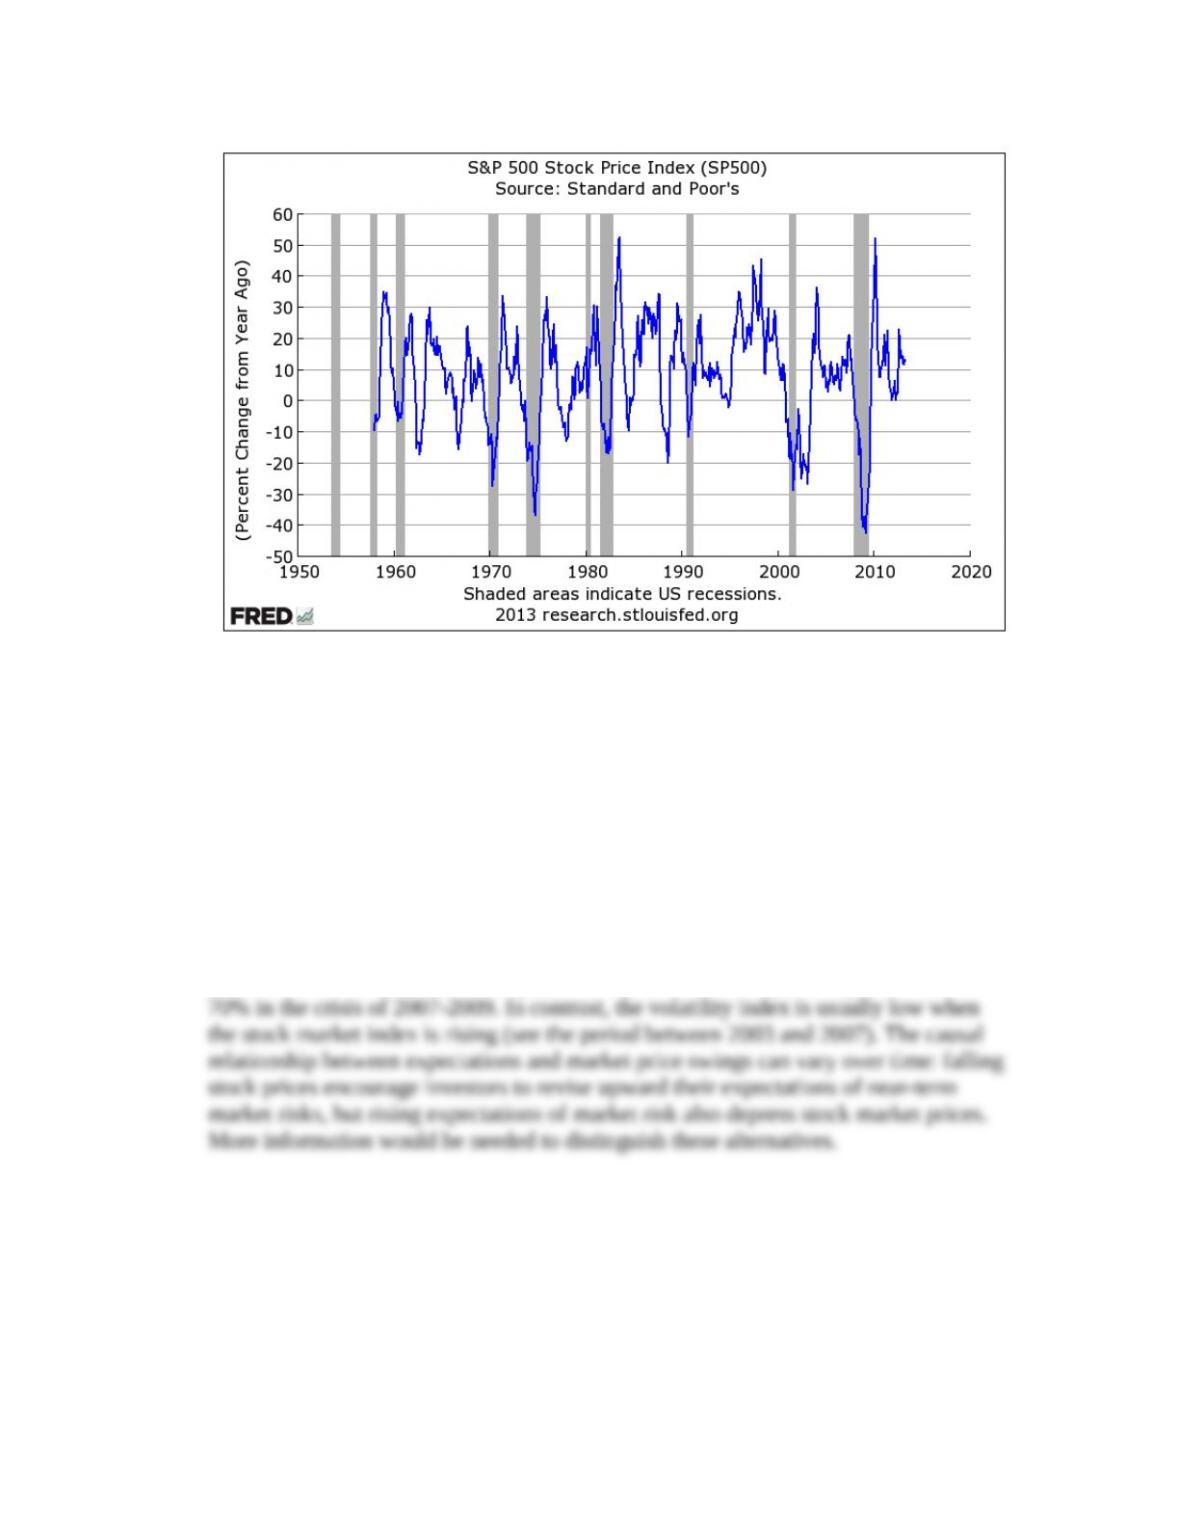
1. Plot the percentage change from a year earlier of the value of the S&P 500 stock
index (FRED code: SP500). Visually, has the risk of the S&P 500 index changed over
time? (LO2) (Hint: At the FRED Web site, go to “Data Tools,” then “Create Your
Own Graphs,” and input “SP500” in the search box. Then, change the Frequency
dropdown box to “Monthly,” change the Units dropdown box to “Percent Change
from Year Ago,” and select “Redraw Graph.”)
Answer: Visual examination of the plot below does not show any obvious change in
5-2
© 2015 by McGraw-Hill Education. This is proprietary material solely for authorized instructor use. Not authorized for sale or distribution in
any manner. This document may not be copied, scanned, duplicated, forwarded, distributed, or posted on a website, in whole or part.
Chapter 05 – Understanding Risk
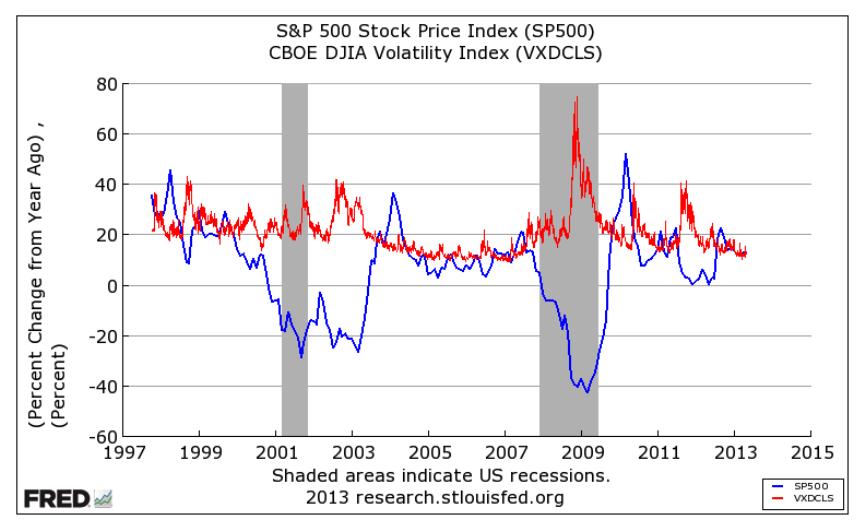
2. Another way to understand stock market risk is to examine how investors expect risk
to evolve in the near future. The DJIA volatility index (FRED code: VXDCLS) is one
such measure. Plot the level of this volatility index since October 1997 and as a
second line, the percent change from a year ago of the S&P 500 index (FRED code:
SP500). Compare their patterns. (LO2) (Hint: Using the figure from Data Exploration
question 1, select “Add Data Series” and input “VXDCLS” in the search box. Select
“Copy to All Lines” to start the date range when the volatility index becomes
available (1997). Set the Units dropdown box to “Percent” (to show the volatility
index level) and select “Redraw Graph.”)
Answer: The plot shows several spikes in the DJIA volatility index, usually in periods
when the S&P 500 index is falling. For example, the volatility index peaked above
5-3
© 2015 by McGraw-Hill Education. This is proprietary material solely for authorized instructor use. Not authorized for sale or distribution in
any manner. This document may not be copied, scanned, duplicated, forwarded, distributed, or posted on a website, in whole or part.
Chapter 05 – Understanding Risk
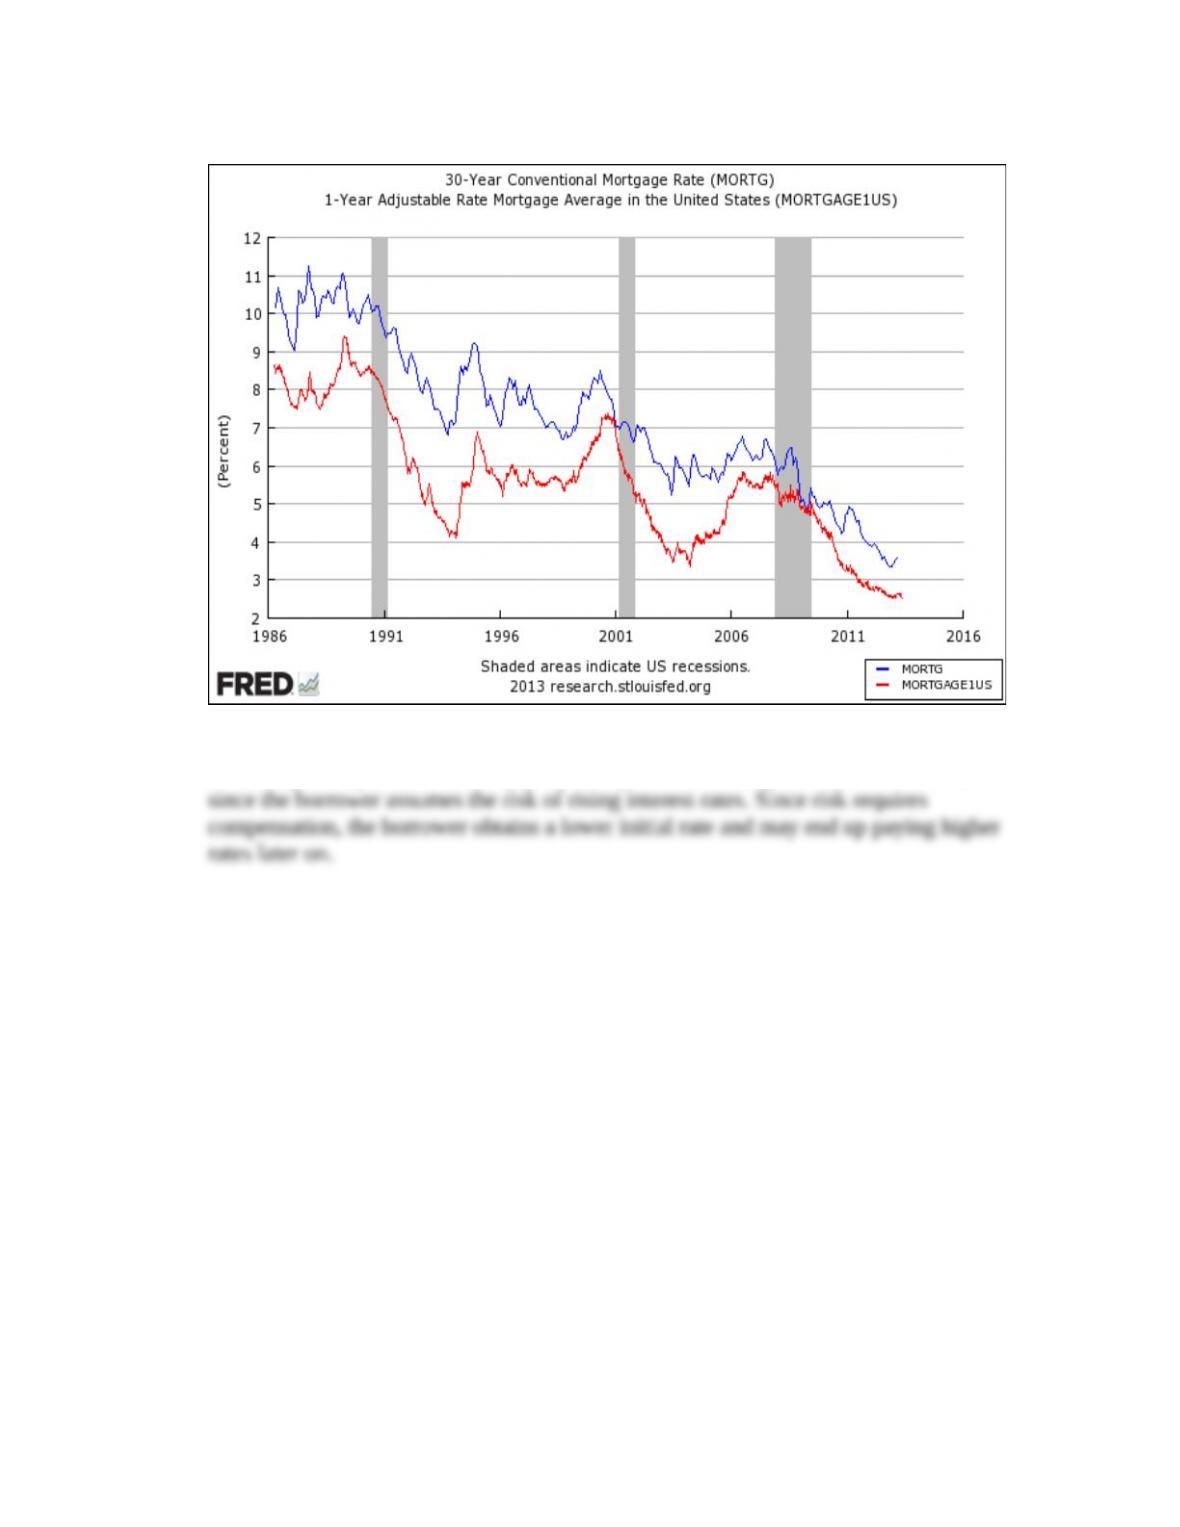
3. For the period since 1986, plot on one graph the 30-year conventional mortgage rate
(FRED code: MORTG) and the one-year adjustable mortgage rate (FRED code:
MORTGAGE1US). Explain their systematic relationship using Core Principle 2.
(LO2) (Hint: Recall that to plot two indicators on the same graph, start with one
indicator and then add another. At the FRED Web site, go to “Data Tools,” then
“Create Your Own Graphs,” and input “MORTG” in the search box. Then select
“Add Data Series,” type “MORTGAGE1US in the search box. At the Observation
Date Range for MORTGAGE1US, select “Copy to All Lines” and then and hit
“Redraw Graph.”)
5-4
© 2015 by McGraw-Hill Education. This is proprietary material solely for authorized instructor use. Not authorized for sale or distribution in
any manner. This document may not be copied, scanned, duplicated, forwarded, distributed, or posted on a website, in whole or part.
Chapter 05 – Understanding Risk
Answer: The plots of the 30-year and 1-year adjustable rates are:
The one-year adjustable rate is systematically below the 30-year conventional rate
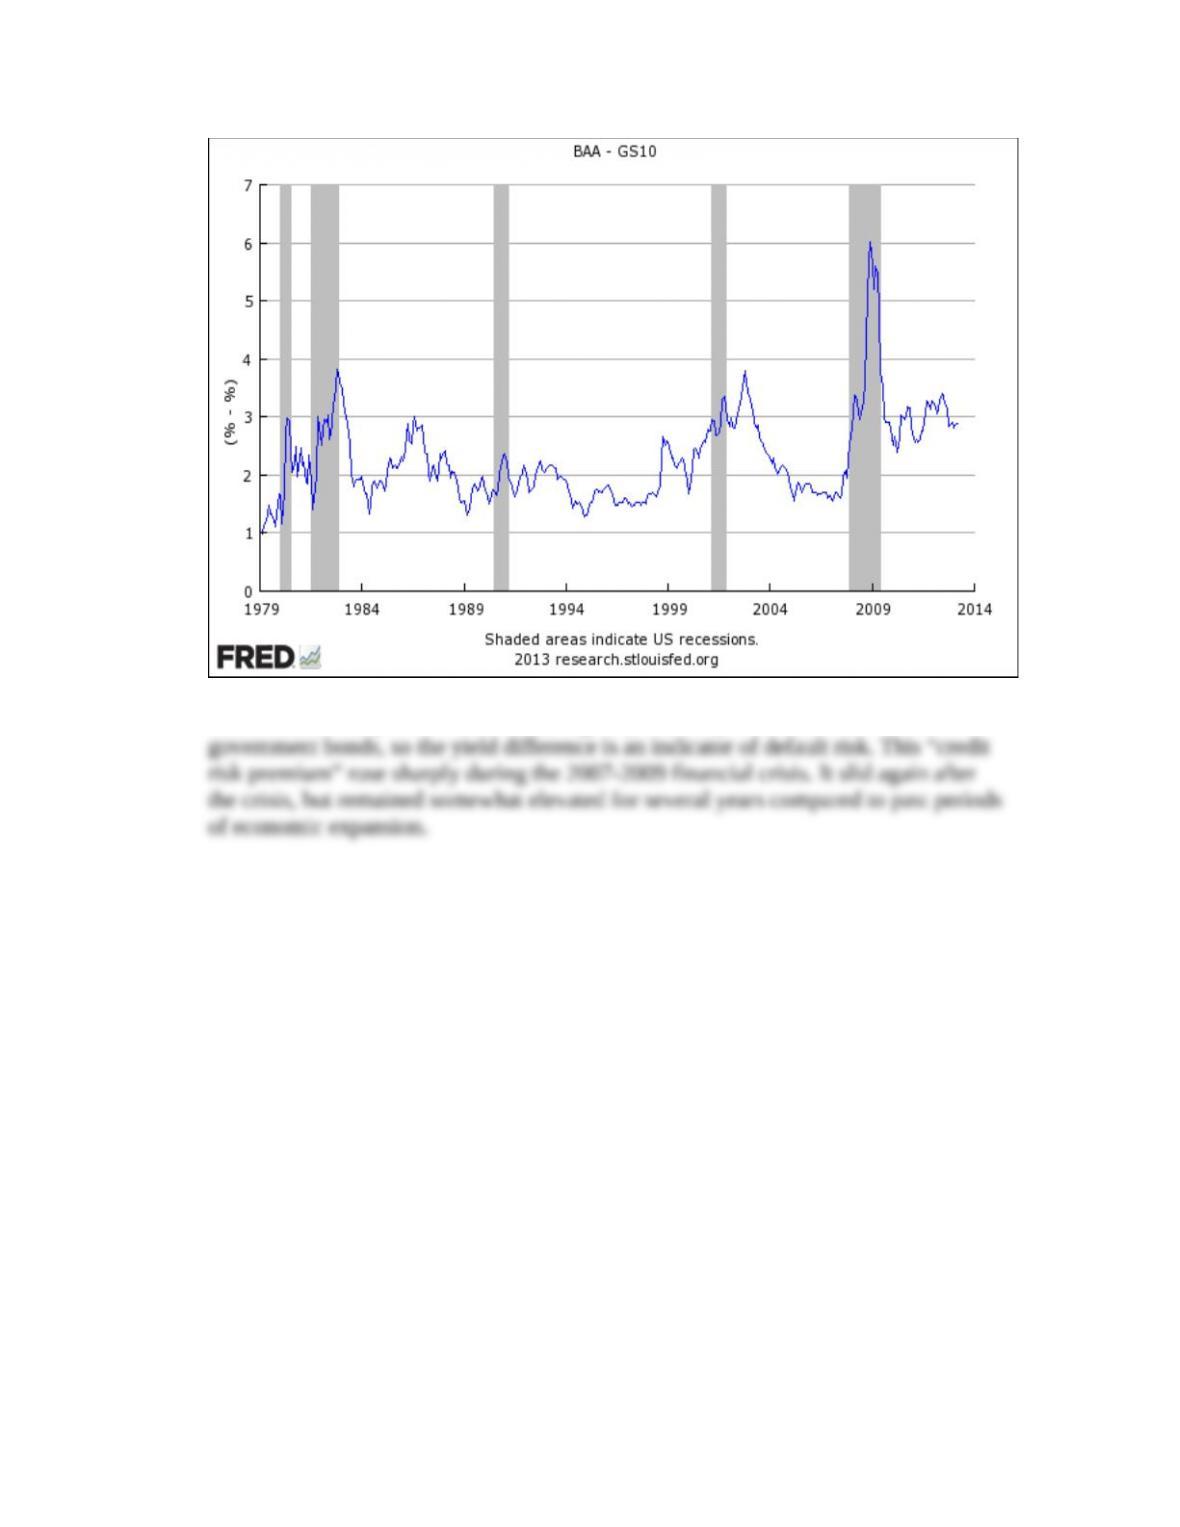
4. Plot the difference since 1979 between the Moody’s Baa bond index (FRED code:
BAA) and the U.S. Treasury 10-year bond yield (FRED code: GS10). Comment on
the trend and variability of this “credit risk premium” (see Chapter 7) before and after
the 2007-2009 financial crisis. (LO1) (Hints: To find the difference, follow the
procedure in Chapter 4, Data Exploration question 4, starting with the Moody’s Baa
bond index.)
Answer: The data plot is:
5-5
© 2015 by McGraw-Hill Education. This is proprietary material solely for authorized instructor use. Not authorized for sale or distribution in
any manner. This document may not be copied, scanned, duplicated, forwarded, distributed, or posted on a website, in whole or part.
Chapter 05 – Understanding Risk
Baa bonds are corporate issues with a higher probability of default than for
* indicates more difficult problems
5-6
© 2015 by McGraw-Hill Education. This is proprietary material solely for authorized instructor use. Not authorized for sale or distribution in
any manner. This document may not be copied, scanned, duplicated, forwarded, distributed, or posted on a website, in whole or part.