Chapter 04 – Future Value, Present Value, and Interest Rates
1. You are considering going to graduate school for a one-year master’s program. You have
done some research and believe that the master’s degree will add $5,000 per year to your
salary for the next 10 years of your working life, starting at the end of this year. From then
on, after the next 10 years, it makes no difference. Completing the master’s program will
cost you $35,000, which you would have to borrow at an interest rate of 6 percent. How
would you decide if this investment in your education were profitable? (LO2)
Answer: You should calculate the internal rate of return from completing the master’s
2. Assuming the chances of being paid back are the same, would a nominal interest rate of 10
percent always be more attractive to a lender than a nominal rate of 5 percent? Explain.
(LO3)
Answer: Lenders are concerned with the real return they receive. If the higher nominal
interest rate represents a higher real interest rate, then the lender will find it more attractive.
If, on the other hand, the higher nominal interest rate merely reflects higher expected
3. *Your firm has the opportunity to buy a perpetual motion machine to use in your business.
The machine costs $1,000,000 and will increase your profits by $75,000 per year. What is the
internal rate of return? (LO2)
Answer: Using the result in the appendix equation (A5) as n becomes arbitrarily large, we
4. *Suppose two parties agree that the expected inflation rate for the next year is 3 percent.
Based on this, they enter into a loan agreement where the nominal interest rate to be charged
is 7 percent. If inflation for the year turns out to be 2 percent, who gains and who loses?
(LO3)
Answer: The ex ante real interest rate is 4 percent. This is what the borrower thinks he or she
is paying and the lender thinks he or she is earning. If inflation turns out to be lower than
4-1
Copyright © 2015 McGraw-Hill Education. All rights reserved. No reproduction or distribution without the prior written consent of McGraw-Hill
Education.
Chapter 04 – Future Value, Present Value, and Interest Rates
Data Exploration
1. How does inflation affect nominal interest rates? (LO3)
a. Plot the three-month U.S. Treasury bill rate (FRED code: TB3MS) from 1960 to the
present. What long-run pattern do you observe? What may have caused this pattern?
(Hint: Follow the procedure described in Chapter 3, Data Exploration Problem 1.)
b. Plot the inflation rate based on the percent change from a year ago of the U.S.
consumer price index (FRED code: CPIAUCSL) from 1960 to the present. How does
U.S. inflation history reflect your explanation in part (a)? (Hint: Follow the
procedure in Chapter 2, Data Exploration Problem 5, then adjust the “Observation
Date Range” as in Chapter 2, Data Exploration Problem 2.)
Answer:
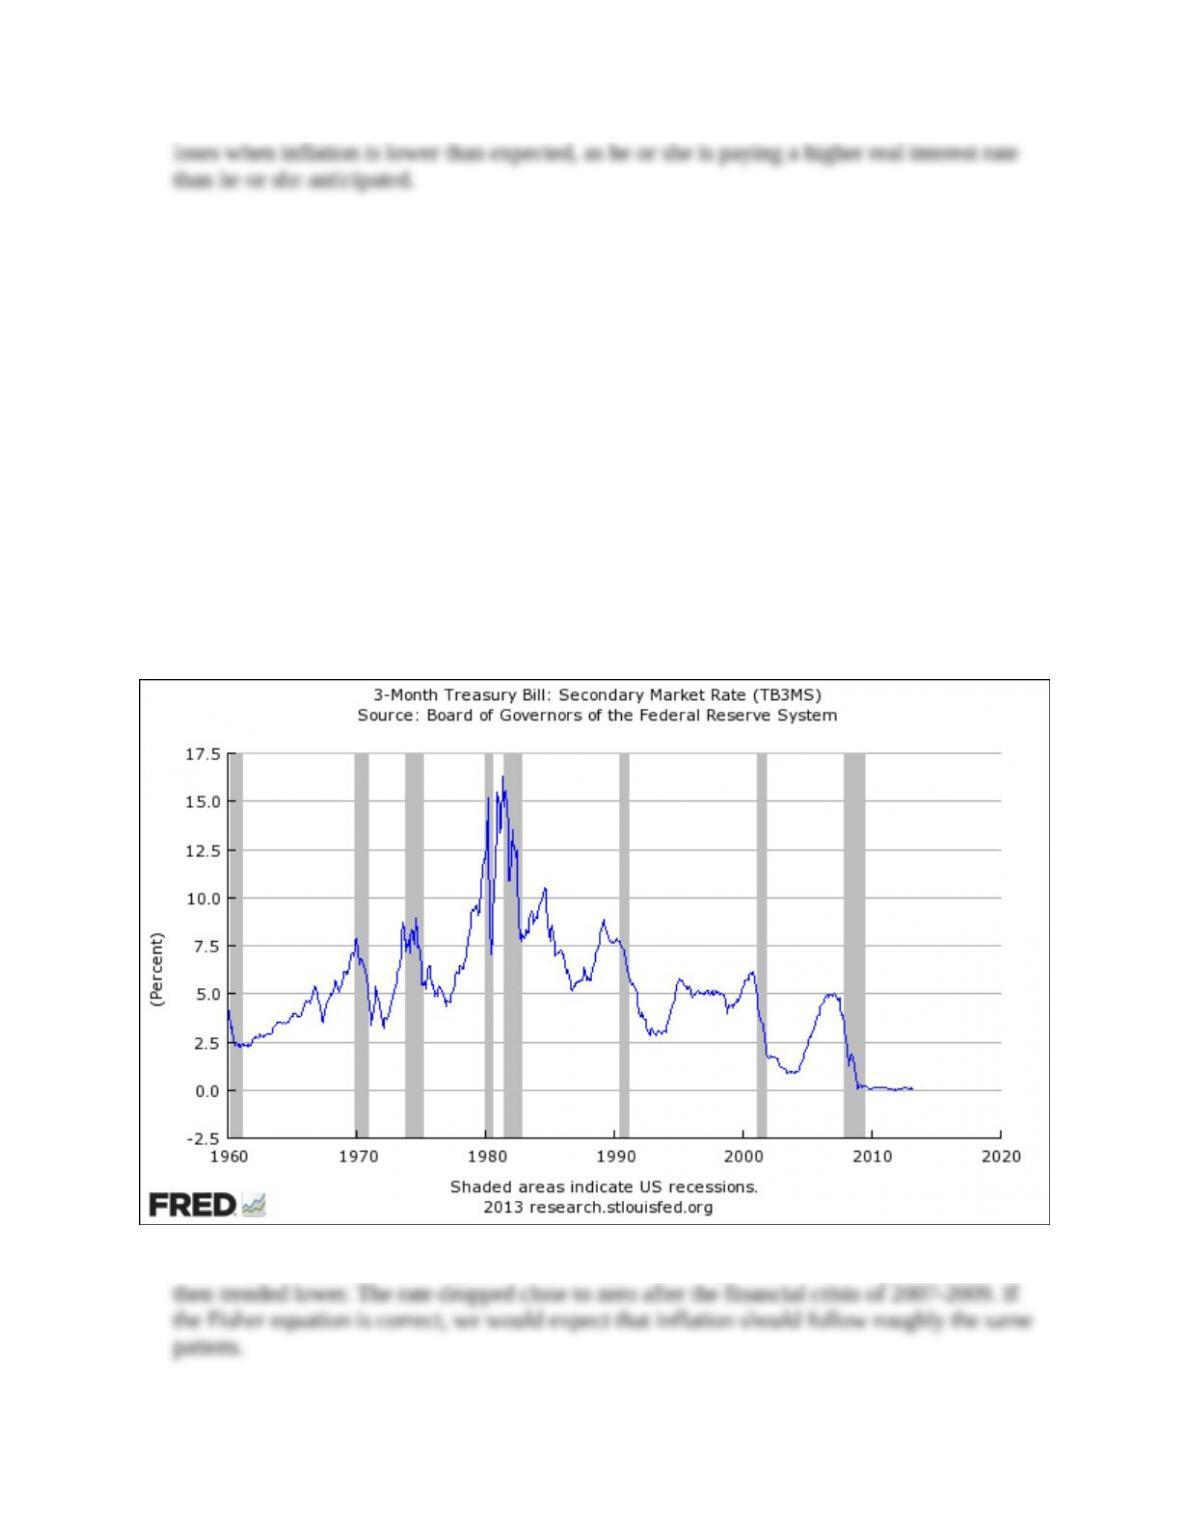
a. The data plot for the U.S. three- month Treasury bill is:
Notice that this rate trended higher until peaking above 15 percent in the early 1980s and
4-2
Copyright © 2015 McGraw-Hill Education. All rights reserved. No reproduction or distribution without the prior written consent of McGraw-Hill
Education.
Chapter 04 – Future Value, Present Value, and Interest Rates
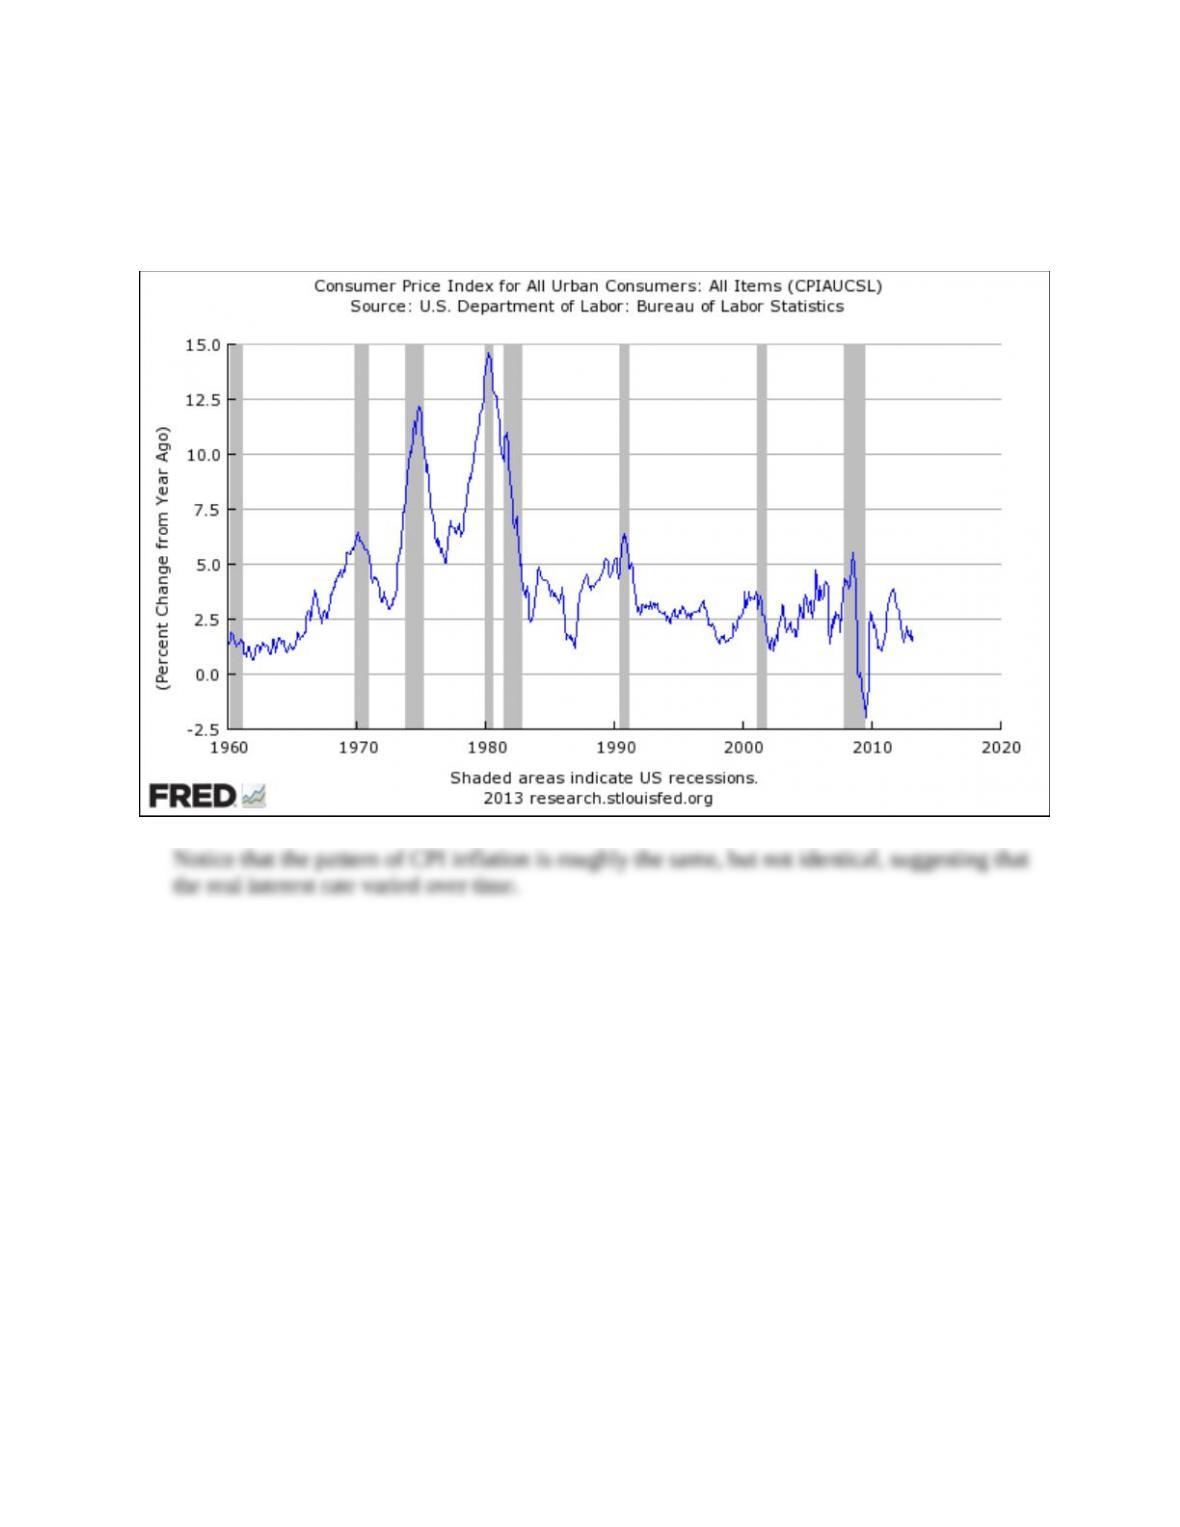
b. The CPI plot is:
2. In Data Exploration Problem 1, you saw the impact of inflation in the U.S. on short-term
U.S. Treasury bill rates. Now examine similar data for Brazil. (LO3)
a. Plot the Brazilian Treasury bill rate (FRED code: INTGSTBRM193N). Notice the
range of values and compare them with the range in the U.S. Treasury bill plot from
Data Exploration Problem 1.
b. Plot the inflation rate based on the percent change from a year ago of the Brazilian
consumer price index (FRED code: BRACPIALLMINMEI). Comment on the
inflation rate in Brazil. Download the data to a spreadsheet (You may need to widen
the spreadsheet column to see the data.) What happens to the index in the 1990–1994
period?
Answer:
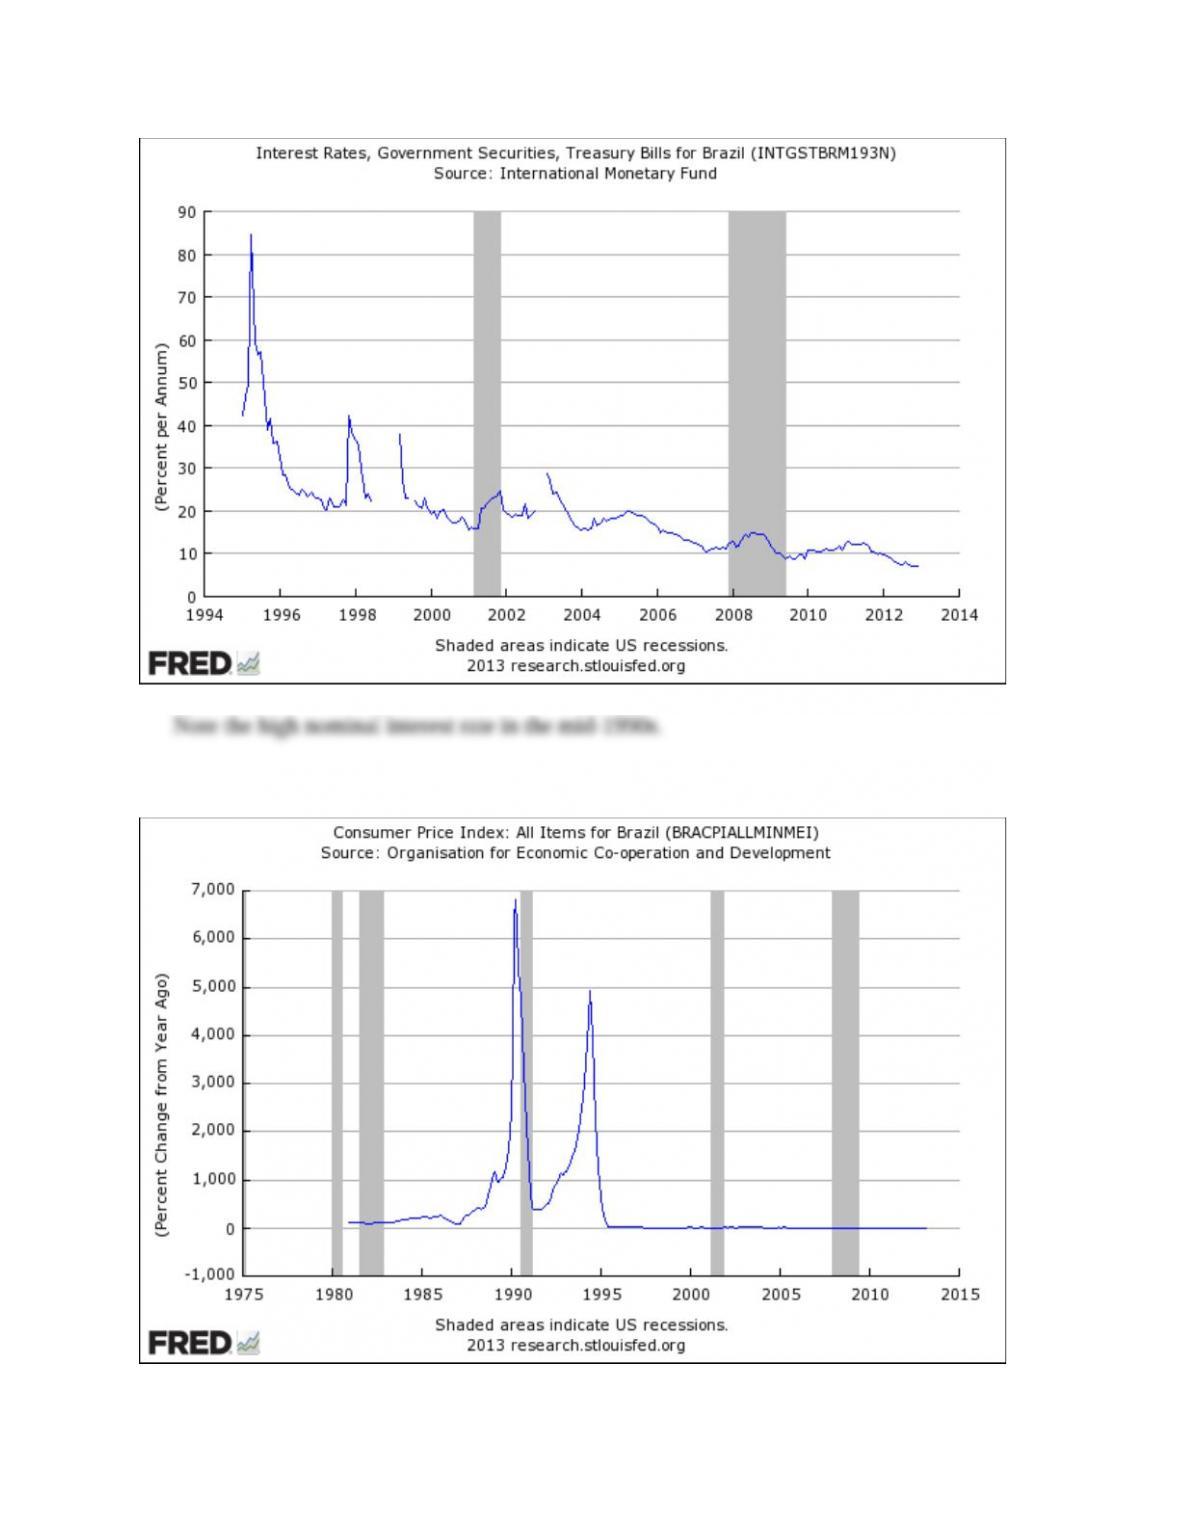
a. The plot for the Brazilian interest rate is:
4-3
Copyright © 2015 McGraw-Hill Education. All rights reserved. No reproduction or distribution without the prior written consent of McGraw-Hill
Education.
Chapter 04 – Future Value, Present Value, and Interest Rates
b. The plot for Brazilian inflation is:
4-4
Copyright © 2015 McGraw-Hill Education. All rights reserved. No reproduction or distribution without the prior written consent of McGraw-Hill
Education.
Chapter 04 – Future Value, Present Value, and Interest Rates
Note the inflation in the mid-1990s approached 5,000 percent per year (following even
1990-01-01 0.000434
1990-04-01 0.000884
As the inflation plot implies, the values of the price index show explosive growth.
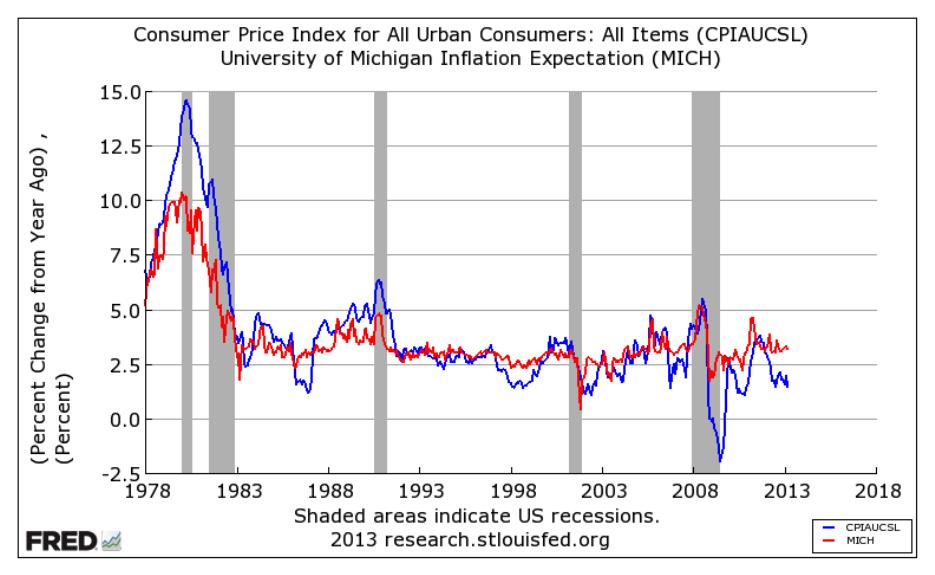
3. The expected real interest rate is the rate which people use in making decisions about the
future. It is the difference between the nominal interest rate and the expected inflation rate,
not the actual inflation rate. How does expected inflation over the coming year compare with
actual inflation over the past year? Plot the inflation rate since 1978 based on the percent
change from a year ago of the U.S consumer price index (FRED code: CPIAUCSL). Add this
figure as a second line to the expected inflation rate from the University of Michigan survey
(FRED code: MICH). Is expected inflation always in line with actual inflation? Which is
more stable? (LO3) (Hint: To graph two lines, use the procedure in Chapter 2 Data
Exploration Problem 2. Start the graph in 1978 by altering the start date in the Observation
Date Range dropdown box.)
Answer: Expected inflation tends to move with actual inflation but varies somewhat less.
4-5
Copyright © 2015 McGraw-Hill Education. All rights reserved. No reproduction or distribution without the prior written consent of McGraw-Hill
Education.
Chapter 04 – Future Value, Present Value, and Interest Rates
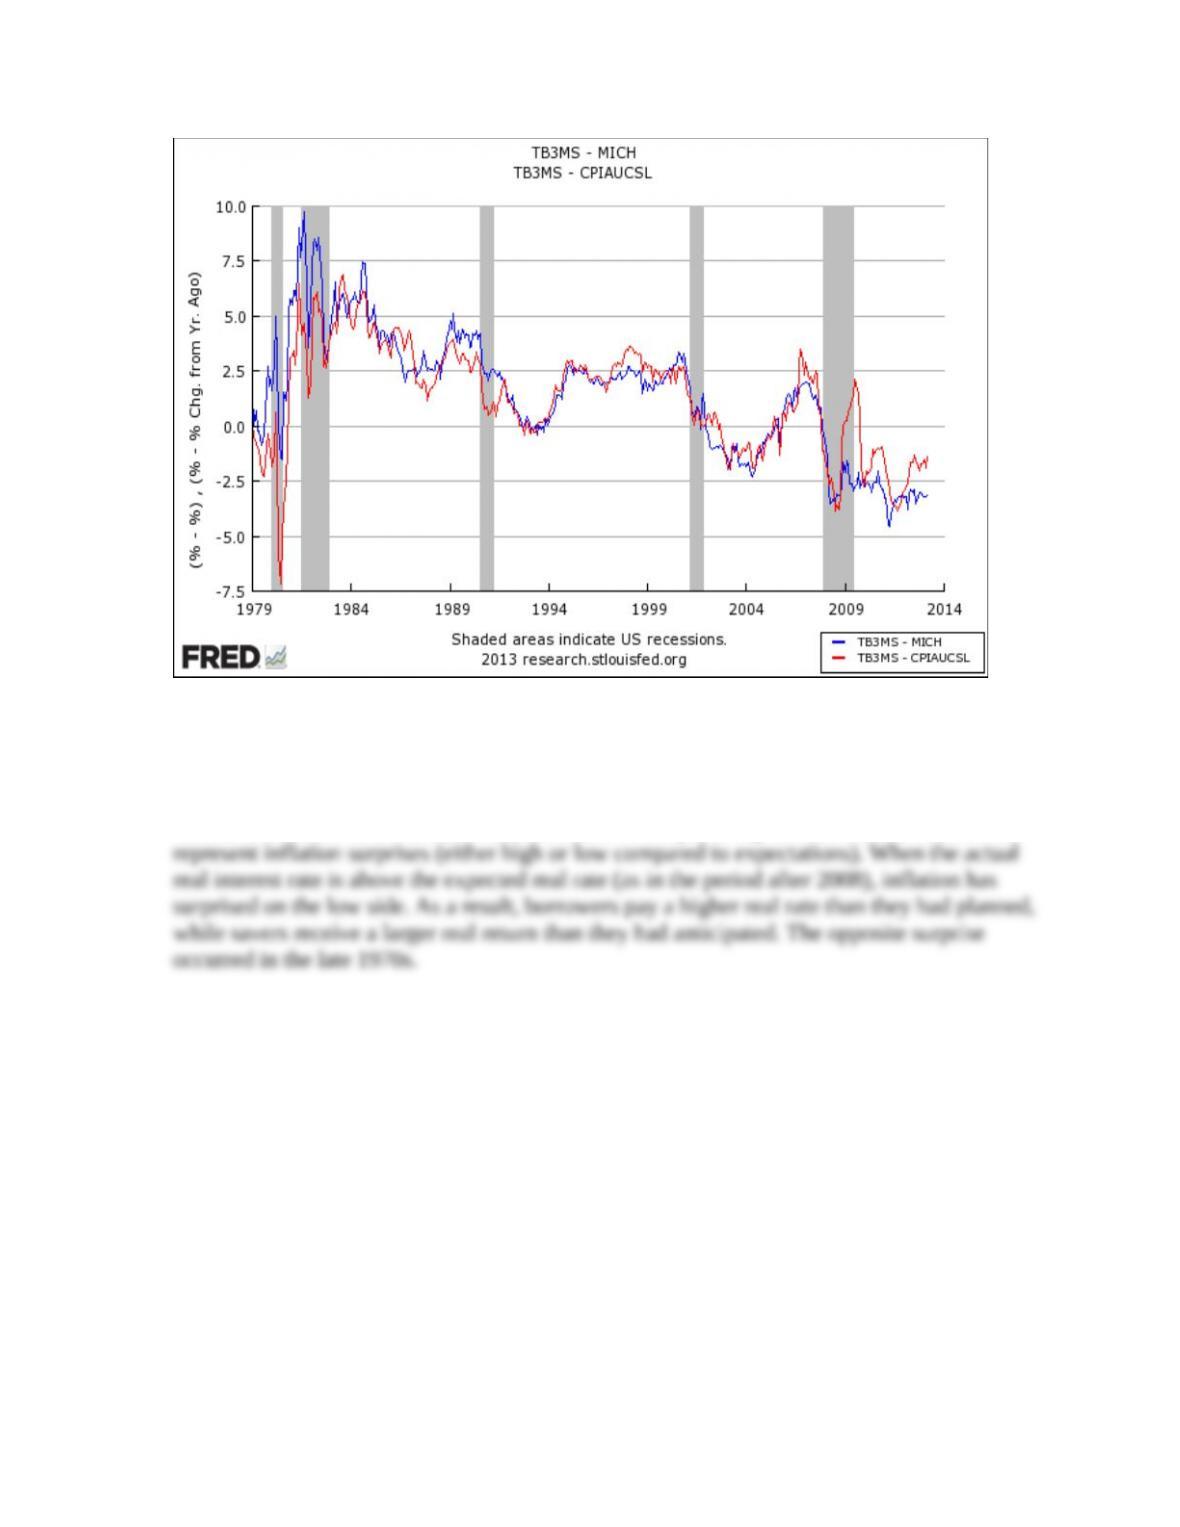
4. Plot the expected real interest rate since 1979 by subtracting the Michigan survey inflation
measure (FRED code: MICH) from the three-month Treasury bill rate (FRED code:
TB3MS). Plot as a second line the ex post or realized real interest rate by subtracting from
the three-month Treasury bill rate (FRED code: TB3MS) the actual inflation rate based on
the percent change from a year ago of the consumer price index (FRED code: CPIAUCSL).
What does it mean when these two measures are different? (LO3) (Hints: First, graph the
Treasury bill rate (FRED code: TB3MS); set the Observation Date Range to begin in 1979;
then, select “Add Data Series,” choose the “Line 1” button and type the survey inflation
measure (FRED code: MICH) in the search box. In the Formula box, type “a – b” and then
select “Redraw Graph.”)
Answer: The data plots are:
4-6
Copyright © 2015 McGraw-Hill Education. All rights reserved. No reproduction or distribution without the prior written consent of McGraw-Hill
Education.
Chapter 04 – Future Value, Present Value, and Interest Rates
The expected real interest rate is computed by subtracting from the nominal three-month
Treasury bill interest rate the Michigan survey expectations. The actual or ex post real
interest rate subtracts from the same nominal Treasury bill rate the actual CPI inflation rate.
As the plots show, these are similar in much of the time period. However, notable and
sustained differences are evident after 2008 and in the period up to 1982. These deviations
* indicates more difficult problems
4-7
Copyright © 2015 McGraw-Hill Education. All rights reserved. No reproduction or distribution without the prior written consent of McGraw-Hill
Education.