3. *Monetary policymakers observe an increase in output in the economy and believe it is a
result of an increase in potential output. If they were correct, what would the appropriate
policy response be to maintain the existing inflation target? If they were incorrect and the
increase in output resulted simply from a positive supply shock, what would the long-run
impact be of their policy response? (LO3)
Answer: To maintain the existing inflation target, monetary policymakers should shift
their MPRC to the right, shifting the AD to the right. This would restore long-run
4. *Consider a previously closed economy that opens up to international trade. Use the
aggregate demand-aggregate supply framework to illustrate a situation where this would
lead to lower inflation in the long run. (LO2)
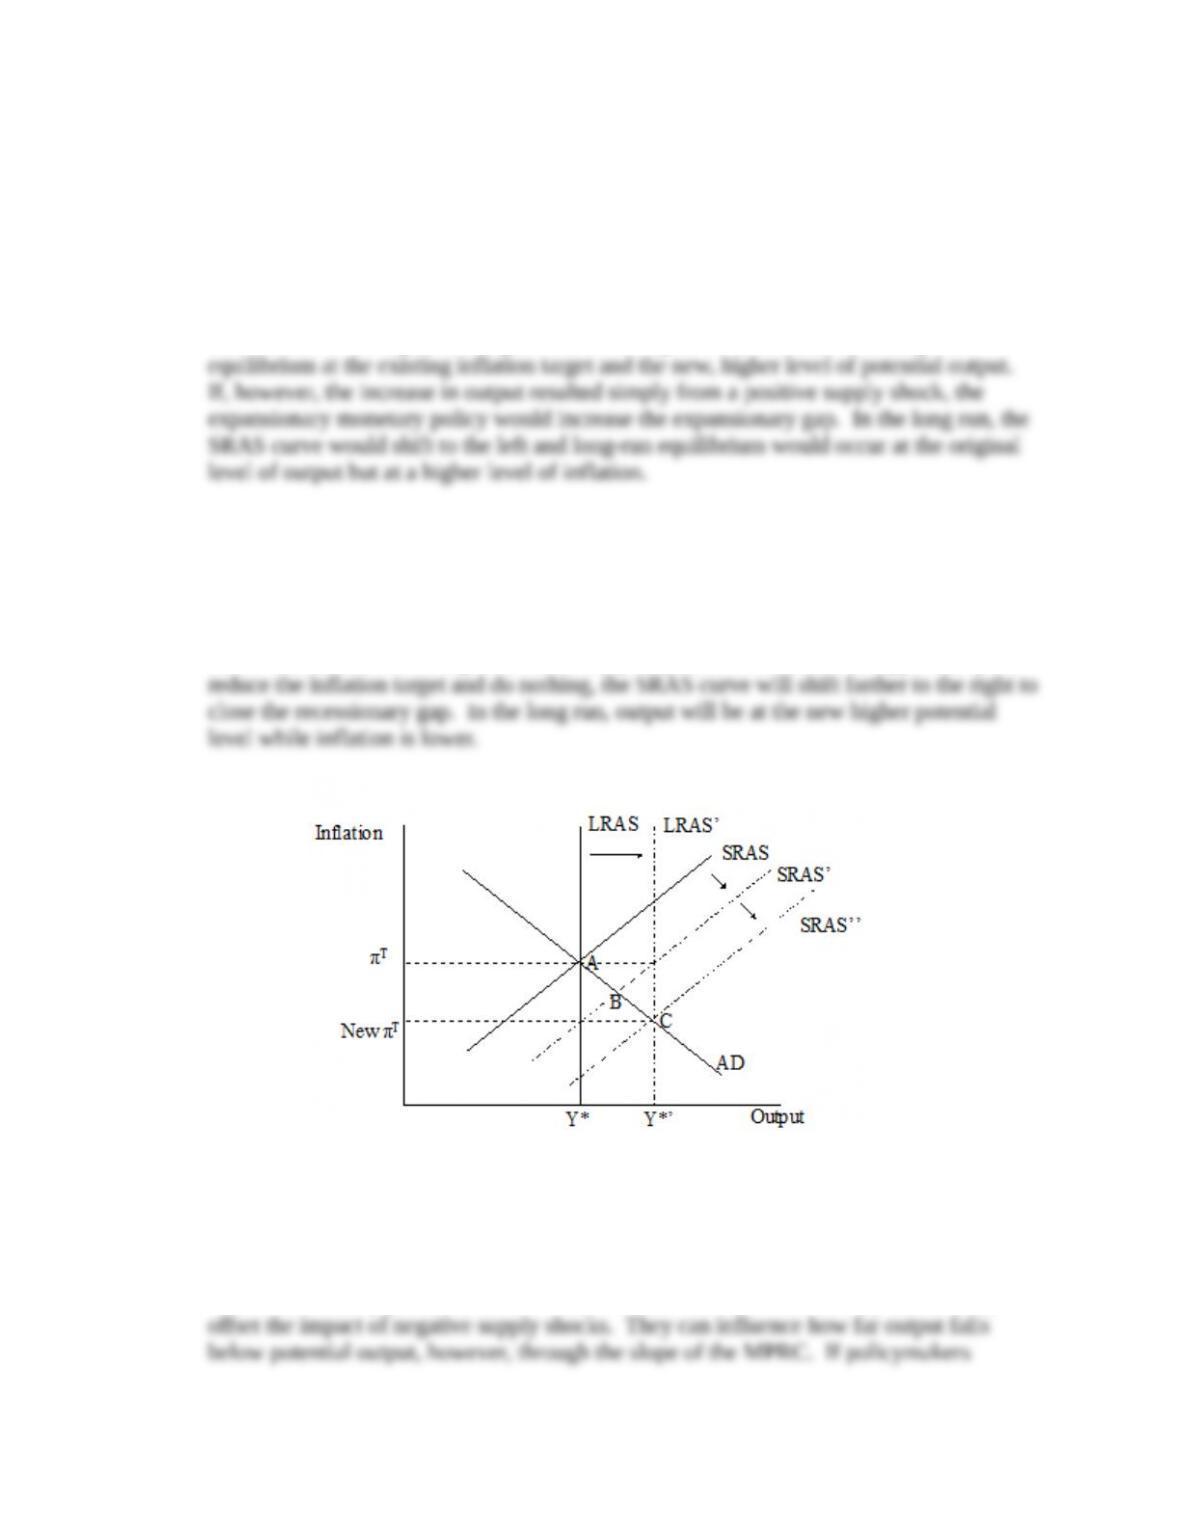
Answer: Opening up to international trade increases potential output and the SRAS and
LRAS curves shift to the right. If monetary policymakers use this as an opportunity to
5. *In face of global oil price shocks, what could monetary policymakers do to minimize the
resulting recessionary gaps? What would be the trade-off of such a policy? Illustrate
your answer using the aggregate demand-aggregate supply framework. (LO3)
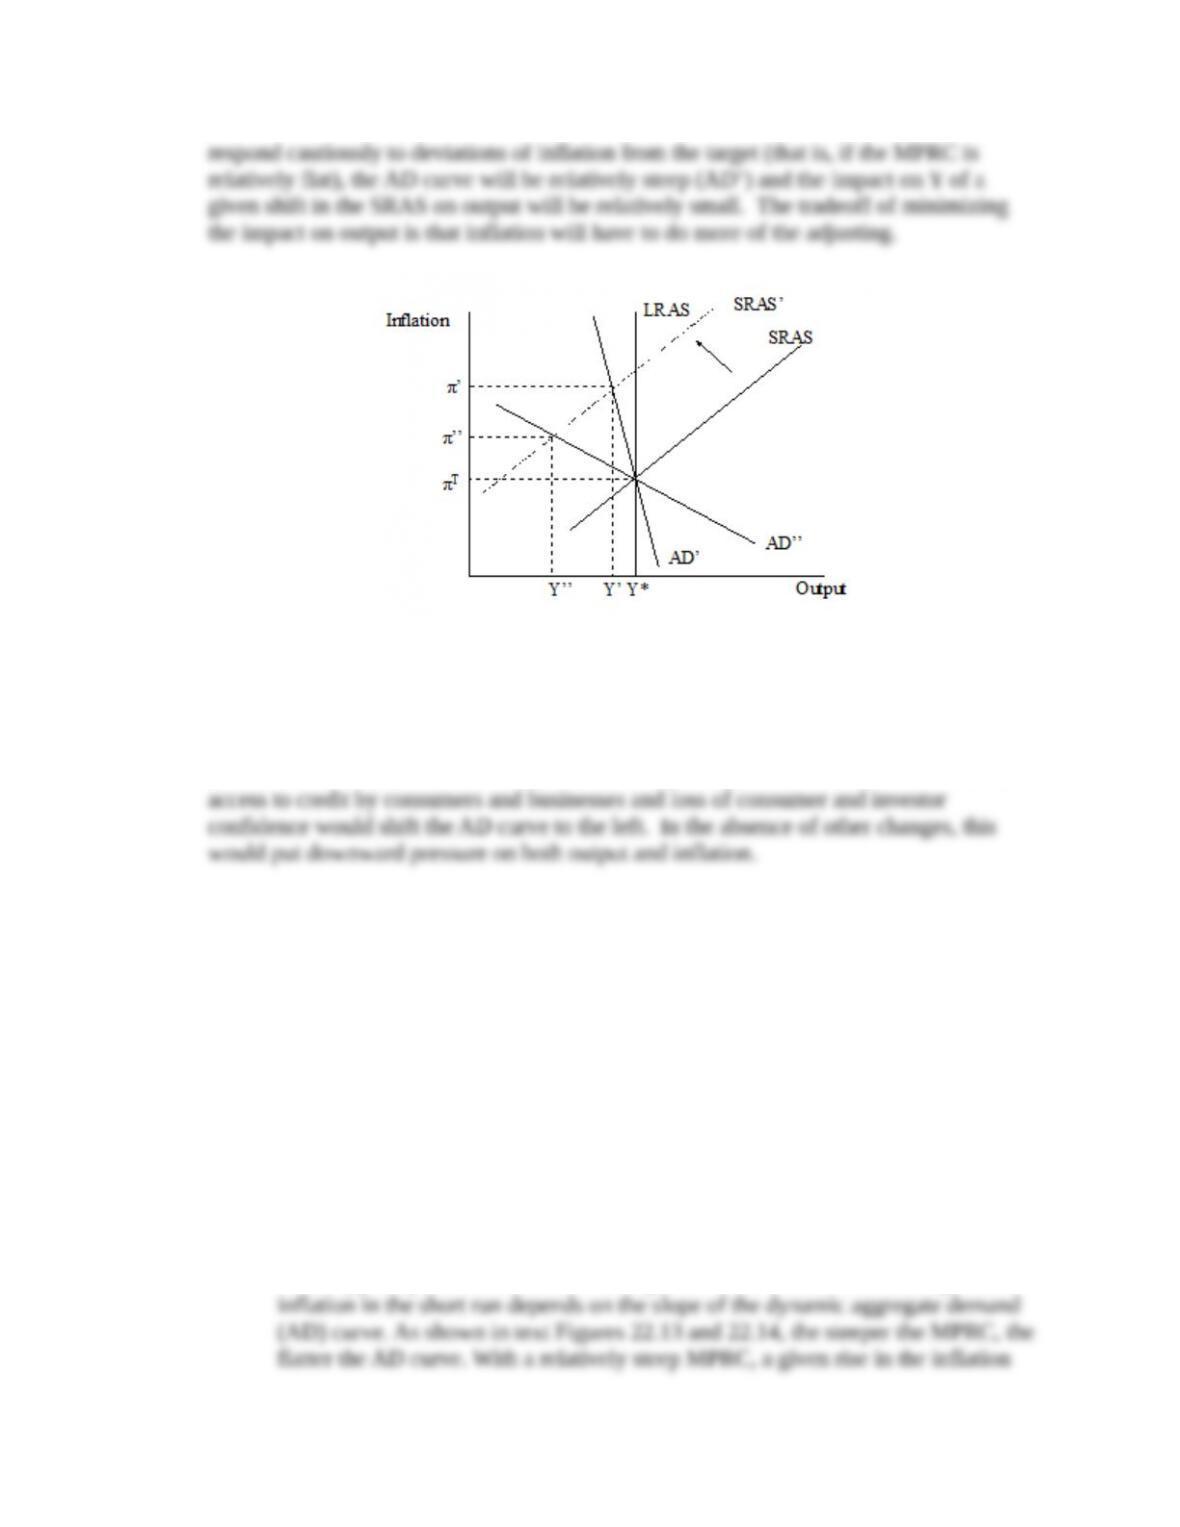
Answer: Monetary policymakers can only shift the AD curve and so they cannot fully
6. *How could you use the aggregate demand-aggregate supply (AD/AS) framework to
explain the impact of the financial crisis of 2007-2009 on inflation and output in the
economy? (LO1)
Answer: You can think of the disruption in financial markets as an AD shock. Lack of
7. Changes in oil prices shift the short-run aggregate supply (SRAS) curve. Consider how
volatility in oil prices may influence the economy’s short-run equilibrium, which occurs
at the intersection of the dynamic aggregate demand (AD) curve and the SRAS curve.
(LO3)
. Suppose the monetary policy reaction curve is relatively steep. What does this
imply about the slope of the AD curve? What does it imply about the variability
of output and inflation? Explain.
. Suppose the monetary policy reaction curve is relatively flat. What does this
imply about the slope of the AD curve? What does it imply about the variability
of output and inflation? Explain.
Answer:
a. In the diagram below, suppose that SRAS fluctuates between SRAS’ and SRAS”,
with a typical position at SRAS. The impact of these fluctuations on output and
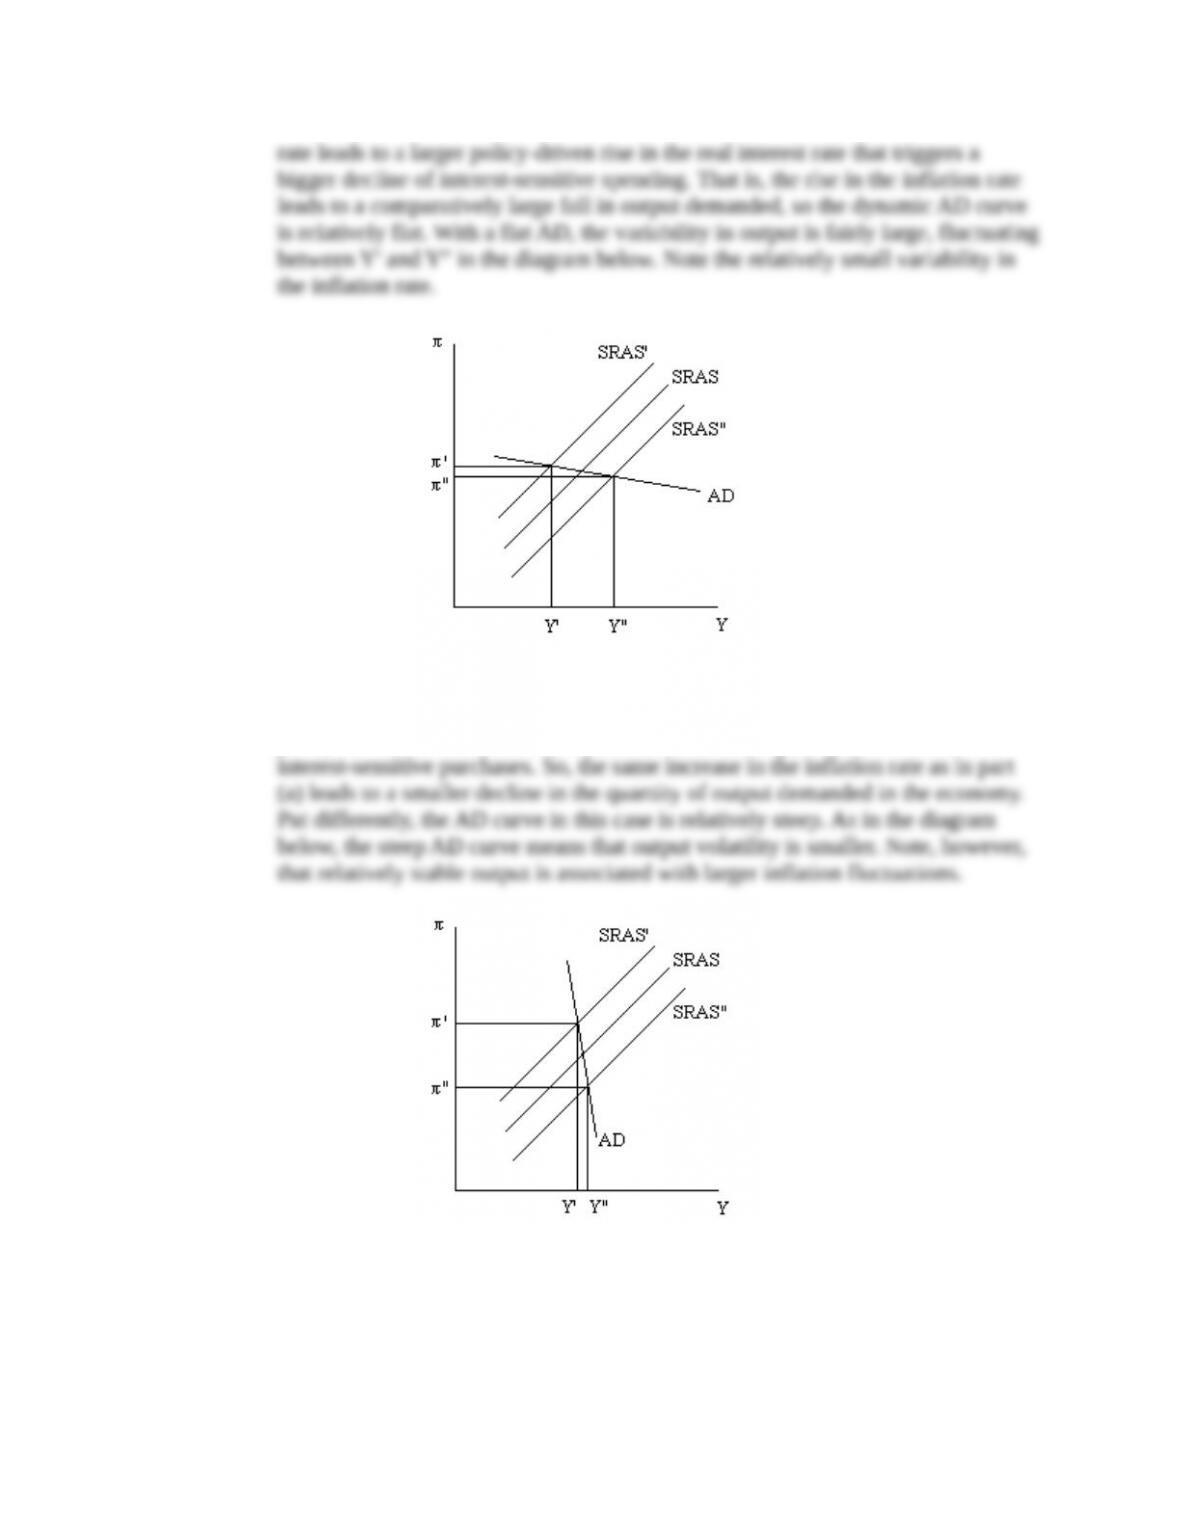
b. If the MPRC is relatively flat, a given rise in the inflation rate leads to a smaller
policy-driven increase in the real interest rate, resulting in a smaller decline of
Data Exploration
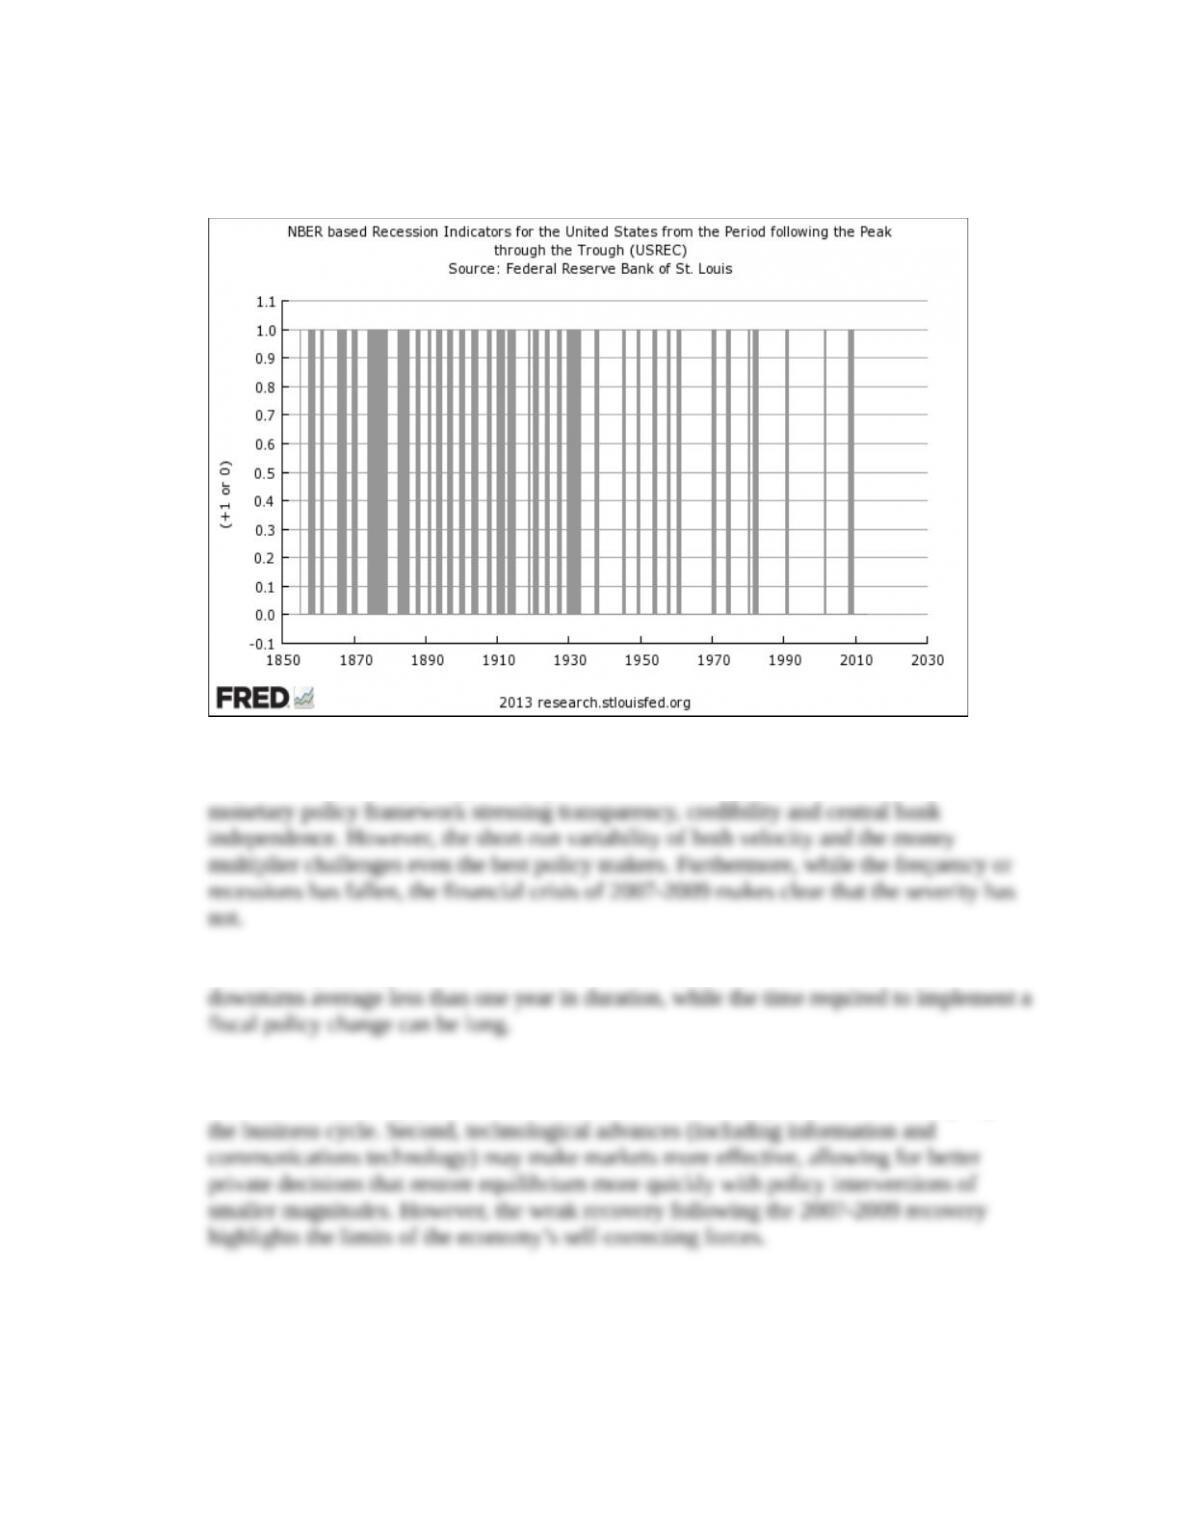
1. Display as a bar chart the periods since 1854 that are designated as U.S. recessions by the
National Bureau of Economic Research (FRED code: USREC). Why has the frequency
of recessions declined over time? Could improvements in monetary policy have played a
role? Improvements in fiscal policy? Can you think of any other causes? (LO1)
Answer: The frequency of recessions has notably diminished, especially after the Great
Depression. Monetary policy has improved over time, especially with the advent of a
Fiscal policy usually is more difficult to use to counter recessions because these
At least two other possibilities exist. First, one hypothesis is that the data prior to World
War II, and especially prior to World War I, is not sufficiently accurate to reliably capture
2. In the past, policymakers occasionally became aware of a recession only well after it
began. Can they do better? Plot the probability of a recession from a statistical model
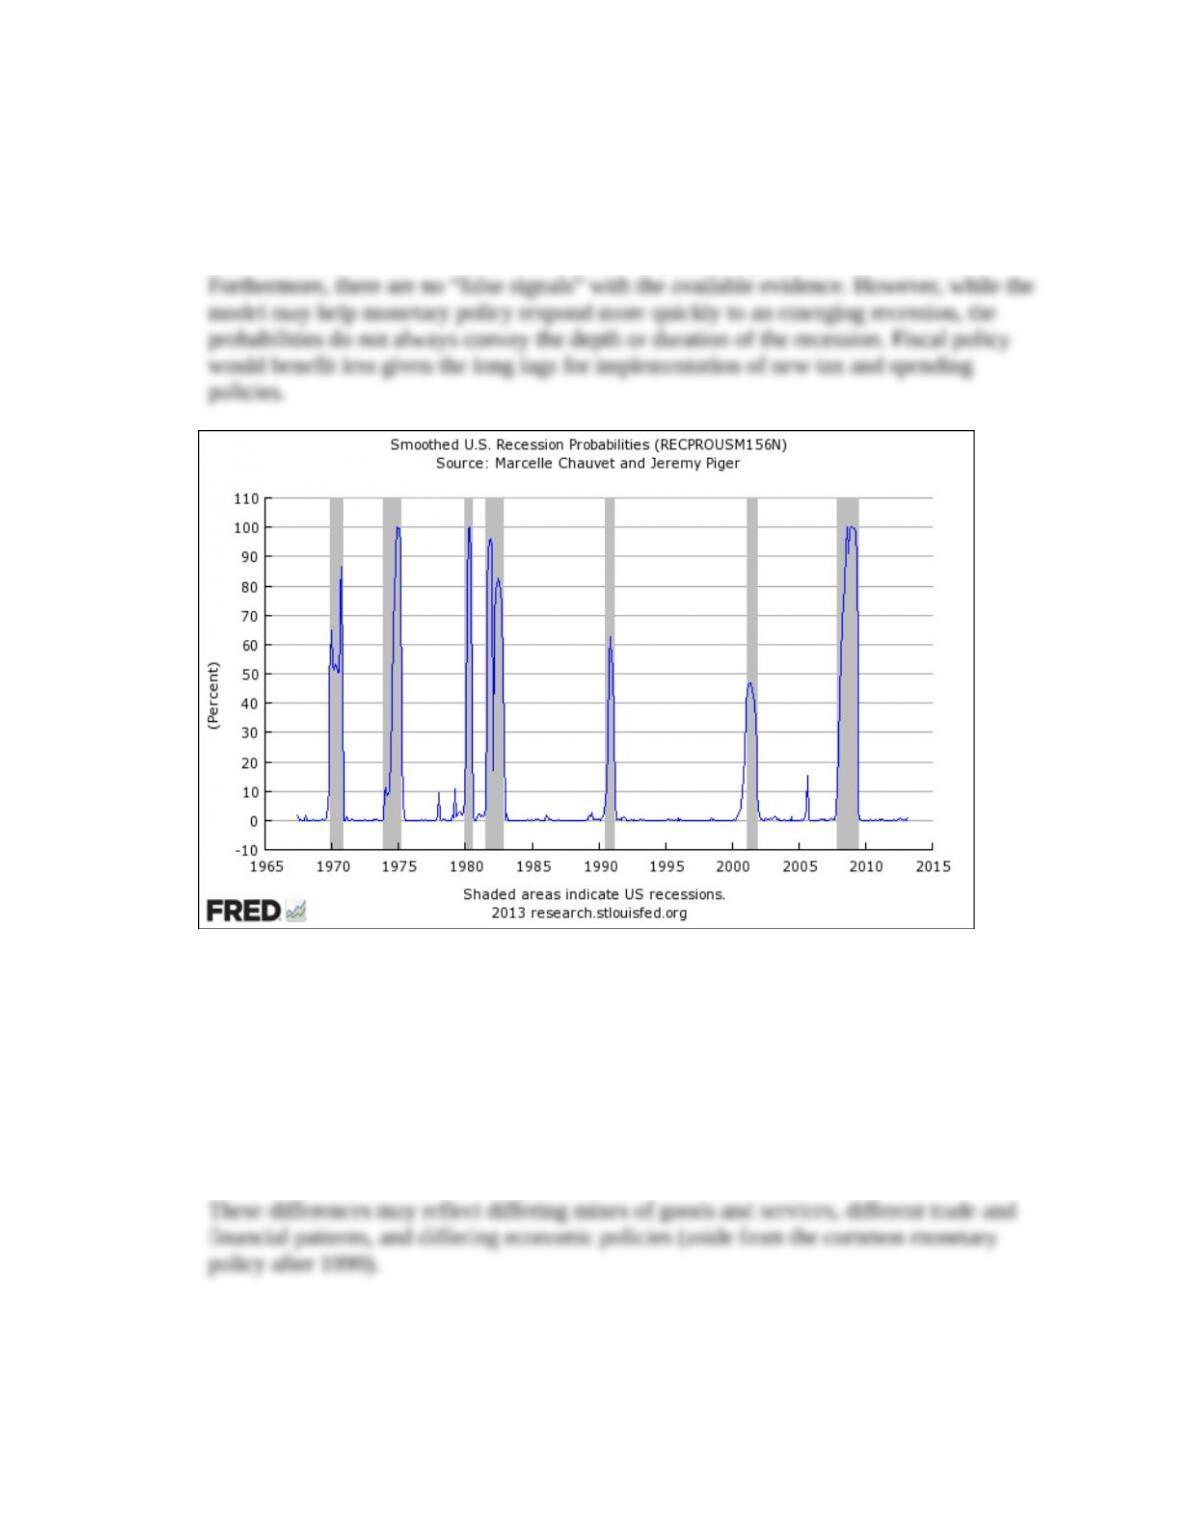
(FRED code: RECPROUSM156N). To what extent could the model help improve
monetary or fiscal policy or both? (LO3)
Answer: The probabilities are plotted below. With the exception of the mild downturn in
2001, a recession occurs whenever the statistical probability rises above 50 percent.
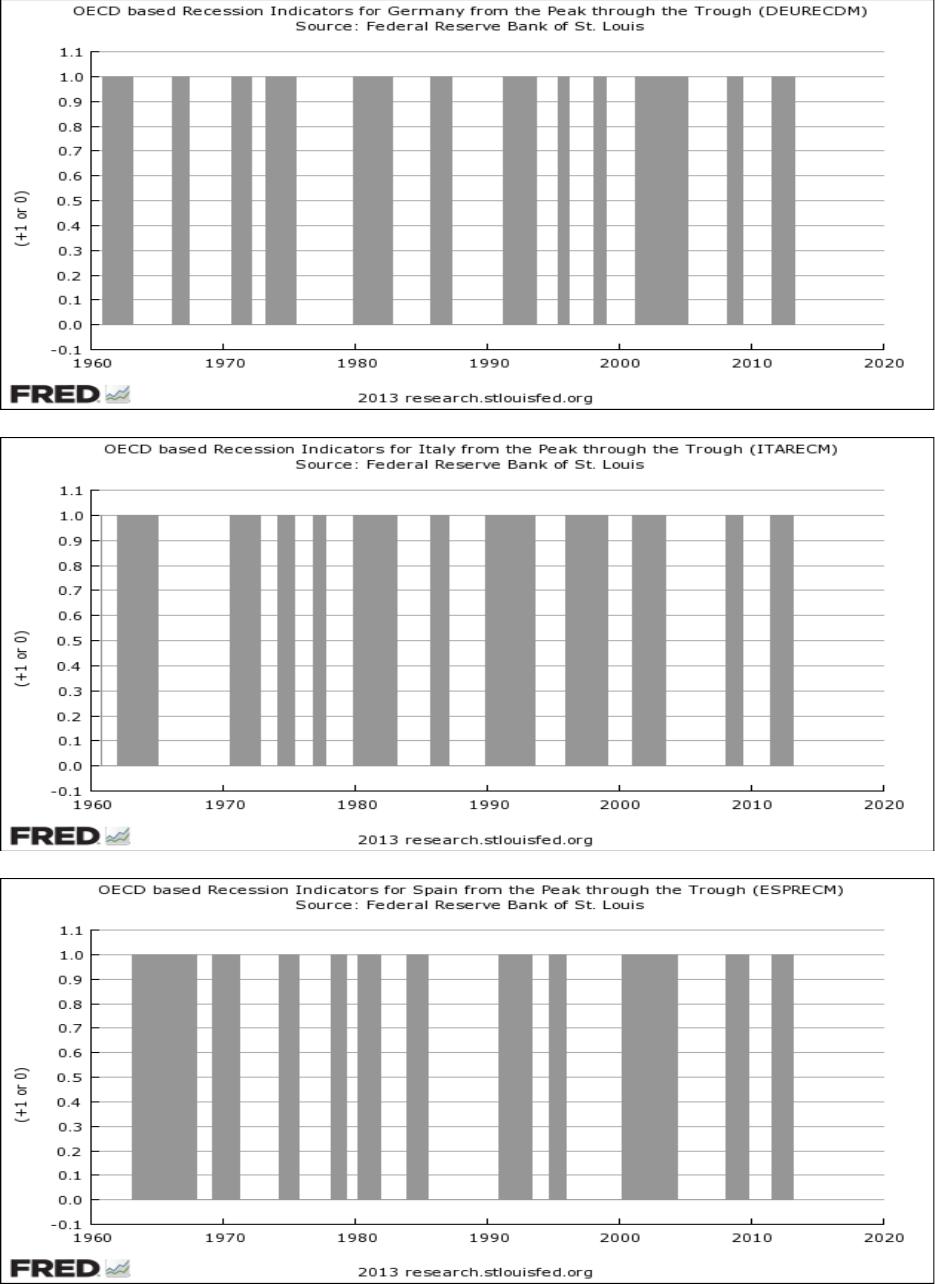
3. Compare the frequency and timing of recessions in key European economies since 1960.
Make separate bar charts for Germany (FRED code: DEURECM), Italy (FRED code:
ITARECM), and Spain (FRED code: ESPRECM). Do their business cycles appear
sufficiently well-aligned to make them operate easily in a single currency area with a
common monetary policy? (LO3)
Answer: The plots are below. While there appears to be some overlap, the timing and
duration of recessions in the European countries are not identical.
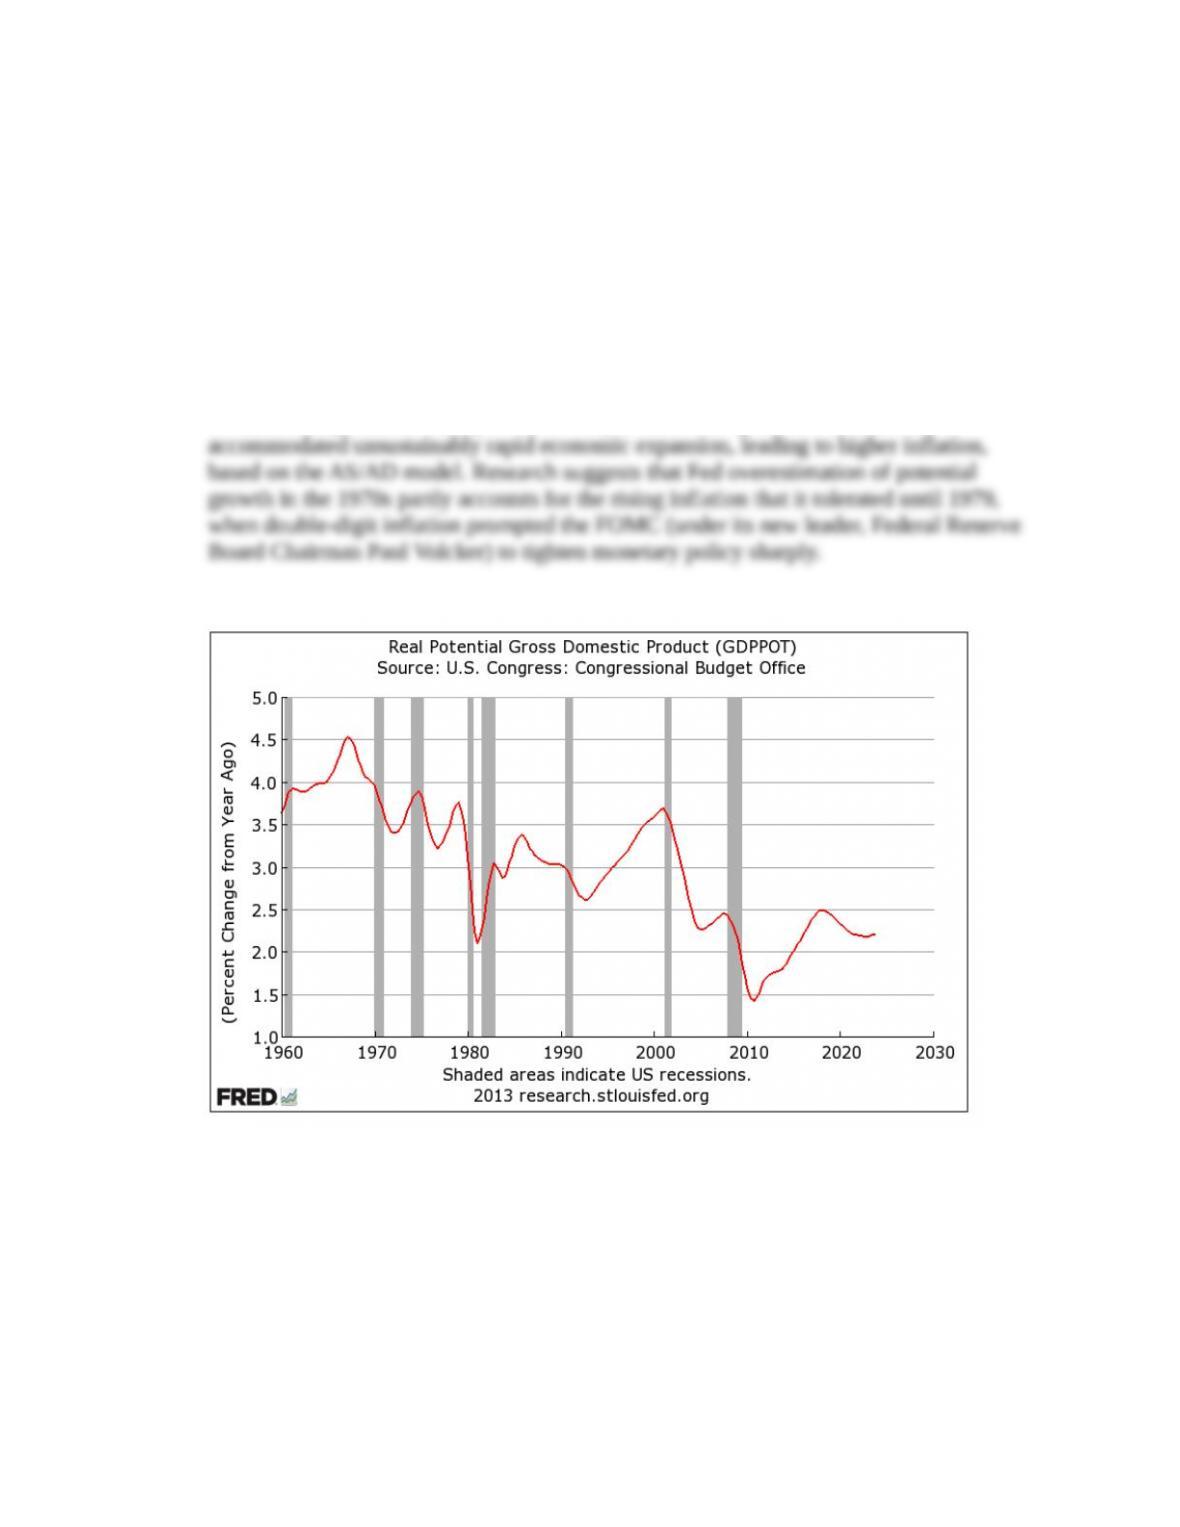
4. To keep inflation low and steady, central banks would like to keep output reasonably
close to its potential level, but can they anticipate changes in potential GDP? Plot since
1960 the percent change from a year ago of the Congressional Budget Office’s estimate
of potential GDP (FRED code: GDPPOT). Suppose that the FOMC assumed that the
growth rate of potential GDP remained permanently at its 1960s average. What would
you expect to happen to inflation? Why? (LO1)
Answer: The plot appears below. According to the CBO, potential GDP growth averaged
4.1 percent in the 1960s. From 1970 to mid-2013, it averaged 2.9 percent. Had the FOMC
assumed that potential GDP growth of 4.1 percent would persist, it would have
* indicates more difficult problems