Chapter 21 – Output, Inflation and Monetary Policy
Chapter 21
Output, Inflation and Monetary Policy
Conceptual and Analytical Problems
1. Explain the determinants of potential growth. (LO1)
Answer: Growth of potential output depends on the growth rate of the capital stock,
2. *Explain how a recessionary output gap would emerge in an economy where the
long-run aggregate supply curve is persistently shifting to the right. (LO1)
Answer: Shifts to the right in the long-run aggregate supply curve reflects growth in
3. Describe the determinants of the long-run real interest rate and speculate on the sort
of events that would make it fluctuate. (LO1)
Answer: The long-run real interest rate equates aggregate expenditure with potential
output. If a component of aggregate expenditure that it not sensitive to changes in the
interest rate such as government spending rises, aggregate expenditure rises above
4. Explain how and why the components of aggregate expenditure depend on the real
interest rate. Be sure to distinguish between the real and nominal interest rates, and
explain why the distinction matters. (LO2)
Answer: Spending, savings and investment decisions of firms and households
generally are based on the real interest rate.
Aggregate expenditure equals consumption plus investment plus government
spending plus net exports. Higher real interest rates increase the cost of borrowing
21-1
© 2015 by McGraw-Hill Education. This is proprietary material solely for authorized instructor use. Not authorized for sale or distribution in
any manner. This document may not be copied, scanned, duplicated, forwarded, distributed, or posted on a website, in whole or part.
Chapter 21 – Output, Inflation and Monetary Policy
Higher real interest rates make U.S. financial assets more attractive to foreigners,
increasing demand for the dollar and raising its value. A rise in the inflation-adjusted
5. * Suppose that the aggregate expenditure curve can be expressed algebraically as
AE = 3,000 – 2,000r,
where AE is aggregate expenditures and r is the real interest rate expressed as a
decimal. You check the website of the Congressional Budget Office and learn that the
level of potential output is 2,900. What is the long-run real interest rate? (LO1)
Answer: The aggregate expenditure curve shows the real interest rate at each level of
desired spending, including the interest rate associated with potential output. The
or
6. Suppose the U.S. economy is in equilibrium at the long-run real interest rate that
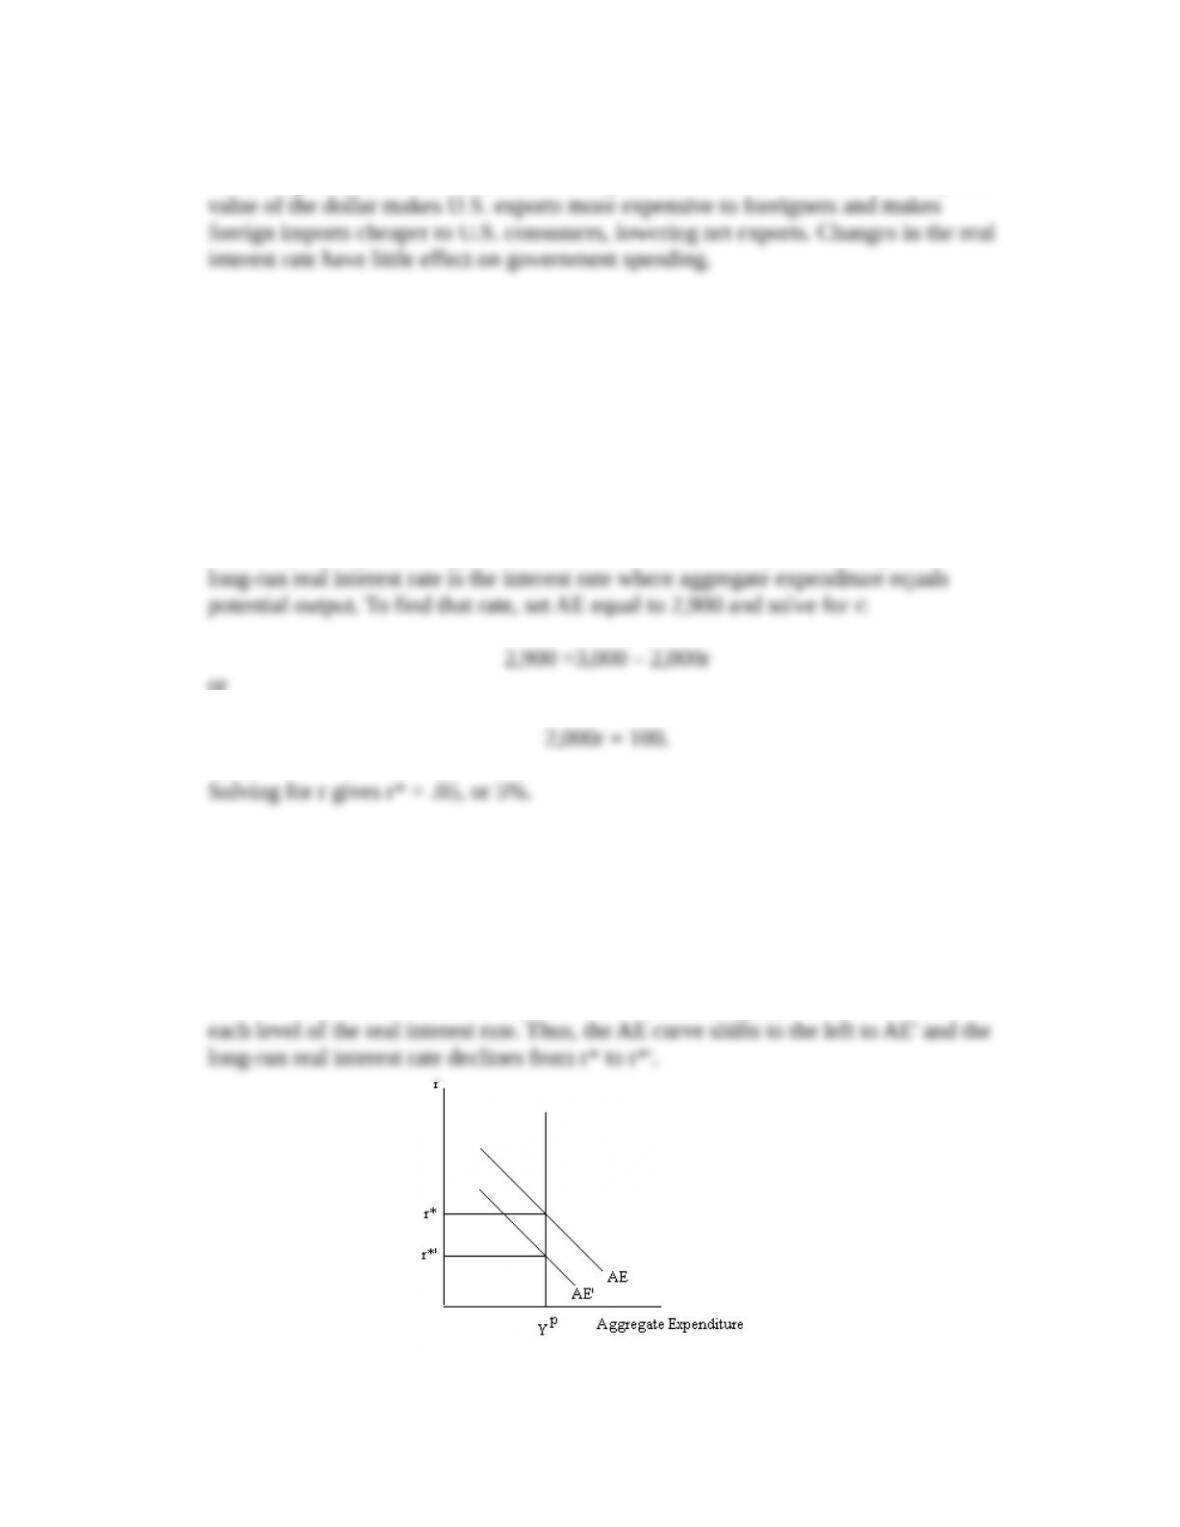
prevails when aggregate expenditures equal potential output. Draw a diagram of
aggregate expenditures showing this initial equilibrium. Then suppose that foreign
demand for U.S. exports falls due to a recession abroad. Show how the long-run real
interest rate will change and explain your results. (LO1)
Answer: The reduction in U.S. exports diminishes U.S. aggregate expenditures at
21-2
© 2015 by McGraw-Hill Education. This is proprietary material solely for authorized instructor use. Not authorized for sale or distribution in
any manner. This document may not be copied, scanned, duplicated, forwarded, distributed, or posted on a website, in whole or part.
Chapter 21 – Output, Inflation and Monetary Policy
7. The European Central Bank’s primary objective is price stability. Policymakers
interpret this objective to mean keeping inflation below, but close to, 2 percent, as
measured by a euro-area consumer price index. In contrast, the FOMC has a dual
objective of price stability and high economic growth. How would you expect the
monetary policy reaction curves of the two central banks to differ? Why? (LO2)
Answer: The ECB is more aggressive in targeting inflation than the FOMC. For
equal deviations in current inflation from target inflation, the ECB will change
8. *Explain why the short-run aggregate supply curve is upward sloping. Under what
circumstances might it be vertical? (LO2)
Answer: The short-run aggregate supply curve is upward sloping due to stickiness in
If all input prices were perfectly flexible and adjusted instantly whenever demand
9. Assume the short-run aggregate supply curve can be expressed algebraically as
Y = 4,800 + 3,000π
and the dynamic aggregate demand curve can be written as
Y = 5,000 – 1,000π.
Find the numerical value for equilibrium output in the short run? Find the numerical
value for the short-run inflation rate? (LO4)
Answer: The answer requires that you solve these two simultaneous equations. To
start, rearrange the second equation, solving for π in terms of Y:
Substituting this expression for the inflation rate into the first equation gives
21-3
© 2015 by McGraw-Hill Education. This is proprietary material solely for authorized instructor use. Not authorized for sale or distribution in
any manner. This document may not be copied, scanned, duplicated, forwarded, distributed, or posted on a website, in whole or part.
Chapter 21 – Output, Inflation and Monetary Policy
Then, using this in the second equation, we obtain
10. Consider Panel B of Figure 21.16, where the short-run equilibrium occurs at an
output level below potential output, Yp. Suppose that the initial inflation target is at
point 2, but the central bank chooses to stimulate demand to speed the adjustment to
long-run equilibrium. What are the costs and benefits of such a policy? (LO4)
Answer: The central bank must raise its inflation target, shifting both the monetary
policy reaction curve and the aggregate demand curve to the right. The cost is higher
11. Suppose the real interest rate unexpectedly falls in the absence of other economic
changes. What would you expect to happen to (a) consumption, (b) investment, and
(c) net exports? (LO3)
Answer:
a. Consumption will rise as borrowing to purchase consumer durables becomes
b. Investment will rise as more projects will be profitable at the lower real
c. The decline of the real interest will diminish demand for the currency. Its
12. Given the expected relationship between the real interest rate and investment, how
would you explain a scenario where investment continued to fall despite low or even
negative real interest rates? (LO3)
Answer: Changes in the level of investment depend both on the level of real interest
rates and changes in expectations about future business conditions. If firms are
21-4
© 2015 by McGraw-Hill Education. This is proprietary material solely for authorized instructor use. Not authorized for sale or distribution in
any manner. This document may not be copied, scanned, duplicated, forwarded, distributed, or posted on a website, in whole or part.
Chapter 21 – Output, Inflation and Monetary Policy
13. * Economy A and Economy B are similar in every way except that in Economy A, 70
percent of aggregate expenditure is sensitive to changes in the real interest rate and in
economy B, only 50 percent of aggregate expenditure is sensitive to changes in the
real interest rate. (LO2)
a. Which economy will have a steeper aggregate expenditure curve?
b. How would the dynamic aggregate demand curves differ given that the
monetary policy reaction curve is the same in both countries?
Explain your answers.
Answer:
a. Economy B will have a steeper aggregate expenditure curve. For a given fall
b. Economy B will also have a steeper dynamic aggregate demand curve. As the
two countries have the same monetary policy reaction curves, an increase in
14. State whether each of the following will result in a movement along or a shift in the
monetary policy reaction curve and in which direction the effect will be. (LO2)
a. Policymakers increase the real interest rate in response to a rise in current
inflation.
b. Policymakers increase their inflation target.
c. The long-run real interest rate falls.
Answer:
a. This would result in a movement up along the monetary policy reaction curve.
15. Suppose a natural disaster wipes out a significant portion of the economy’s capital
stock, reducing the potential level of output. What would you expect to happen to the
long-run real interest rate? What impact would this have on the monetary policy
reaction curve and the dynamic aggregate demand curve? (LO1)
Answer: The reduction in the potential level of output in the economy would lead to
21-5
© 2015 by McGraw-Hill Education. This is proprietary material solely for authorized instructor use. Not authorized for sale or distribution in
any manner. This document may not be copied, scanned, duplicated, forwarded, distributed, or posted on a website, in whole or part.
Chapter 21 – Output, Inflation and Monetary Policy
16. Suppose there were a wave of investor pessimism in the economy. What would the
impact be on the dynamic aggregate demand curve? (LO2)
Answer: A wave of investor pessimism would reduce investment and therefore
17. Explain how each of the following affects the short-run aggregate supply curve.
(LO2)
a. Firms and workers reduce their expectations of future inflation.
b. There is a rise in current inflation.
c. There is a fall in oil prices.
Answer
a. A reduction in inflationary expectations means that nominal wages will rise by
18. Suppose the economy is in short-run equilibrium at a level of output that exceeds
potential output. How would the economy self-adjust to return to long-run
equilibrium? (LO3)
Answer: The expansionary gap exerts upward pressure on costs, shifting the
short-run aggregate supply curve to the left until the economy reaches the long-run
19. Why do you think the surge in oil prices in 2007-2008 had a much smaller impact on
inflation expectations compared with the oil price shocks of the 1970’s? (LO3)
Answer: The response of inflation expectations to changes in economic conditions
depends to a large extent on the credibility of the monetary policymaker. If the
21-6
© 2015 by McGraw-Hill Education. This is proprietary material solely for authorized instructor use. Not authorized for sale or distribution in
any manner. This document may not be copied, scanned, duplicated, forwarded, distributed, or posted on a website, in whole or part.
Chapter 21 – Output, Inflation and Monetary Policy
20. You read a story in the newspaper blaming the central bank for pushing the economy
into recession. The article goes on to mention that not only has output fallen below
its potential level but that inflation had also risen. If you were to write to the
newspaper defending the central bank, what argument would you make? (LO3)
Answer: You should state that monetary policy actions by the central bank affect the
Data Exploration
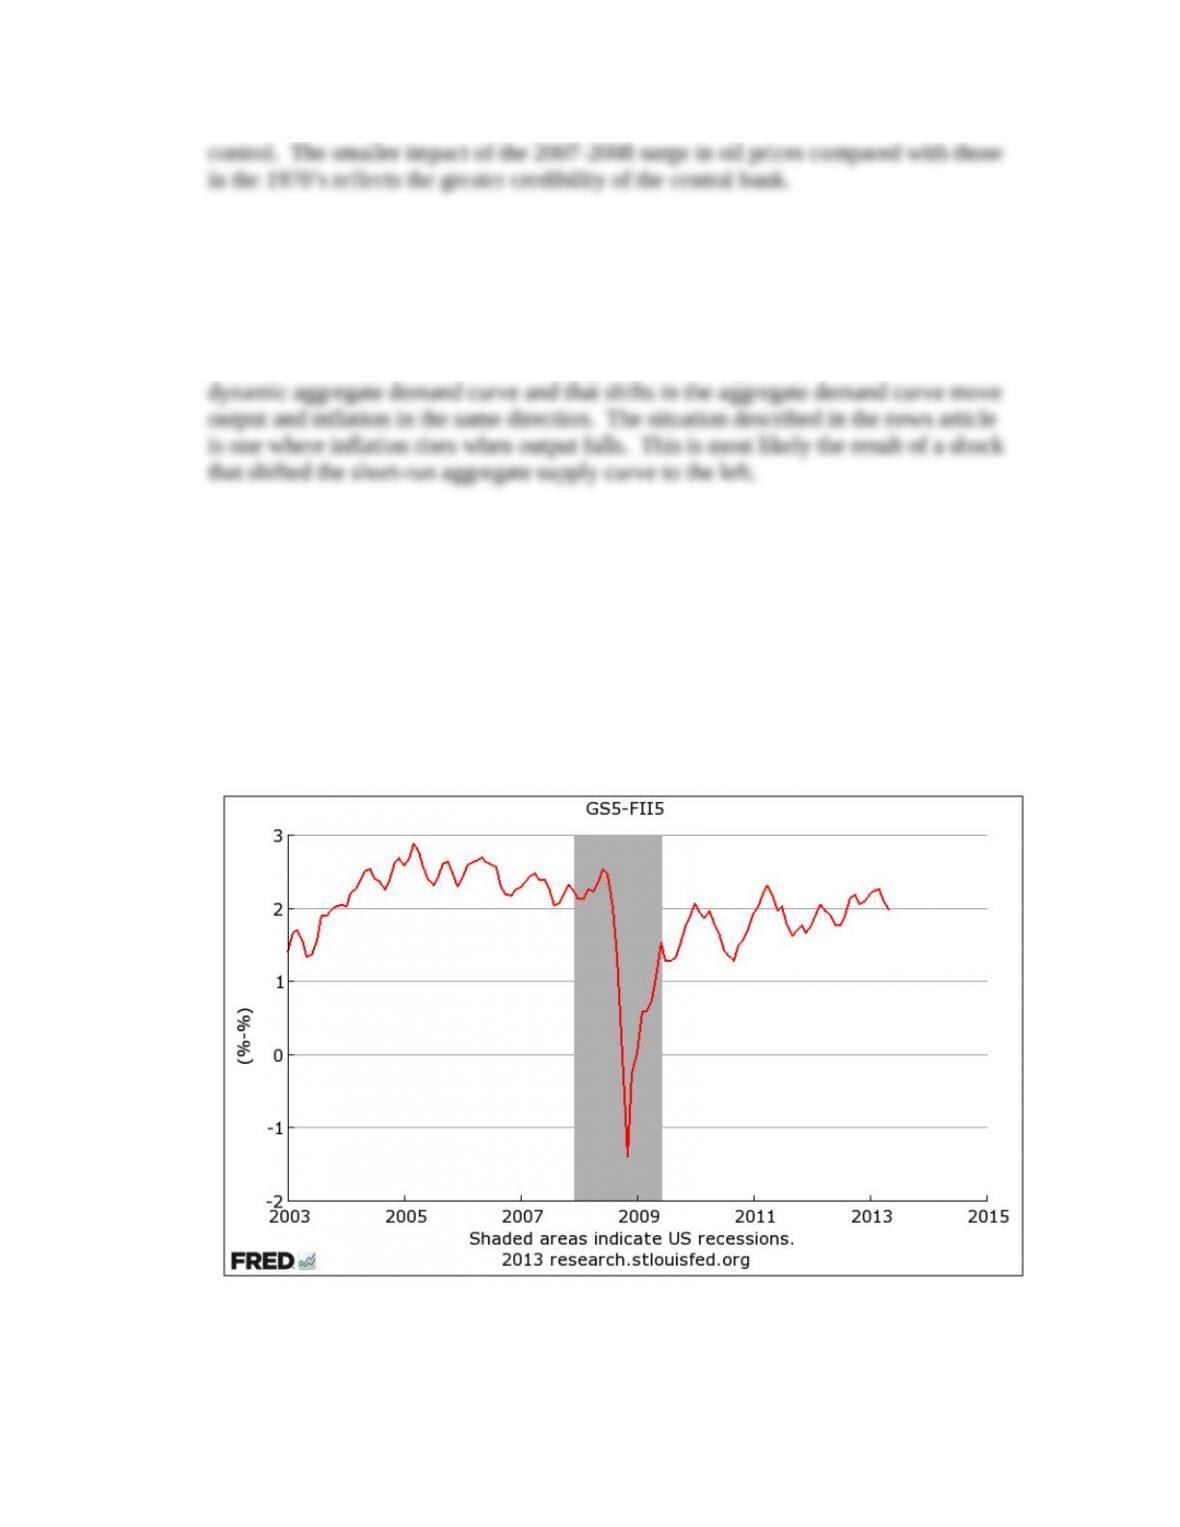
1. Are long-term inflation expectations “well anchored?” Using monthly data since
2003, plot a measure of long-term inflation expectations based on the difference
between the yields on a five-year Treasury bond (FRED code: GS5) and a five-year
Treasury Inflation Protected Securities (TIPS) bond (FRED code: FII5). What do you
conclude? How did the financial crisis of 2007-2009 affect the measure? (LO1)
21-7
© 2015 by McGraw-Hill Education. This is proprietary material solely for authorized instructor use. Not authorized for sale or distribution in
any manner. This document may not be copied, scanned, duplicated, forwarded, distributed, or posted on a website, in whole or part.
Chapter 21 – Output, Inflation and Monetary Policy
Answer: Based on this measure, long-term inflation expectations have been
reasonably consistent with the Fed’s 2-percent inflation target for a decade. The key
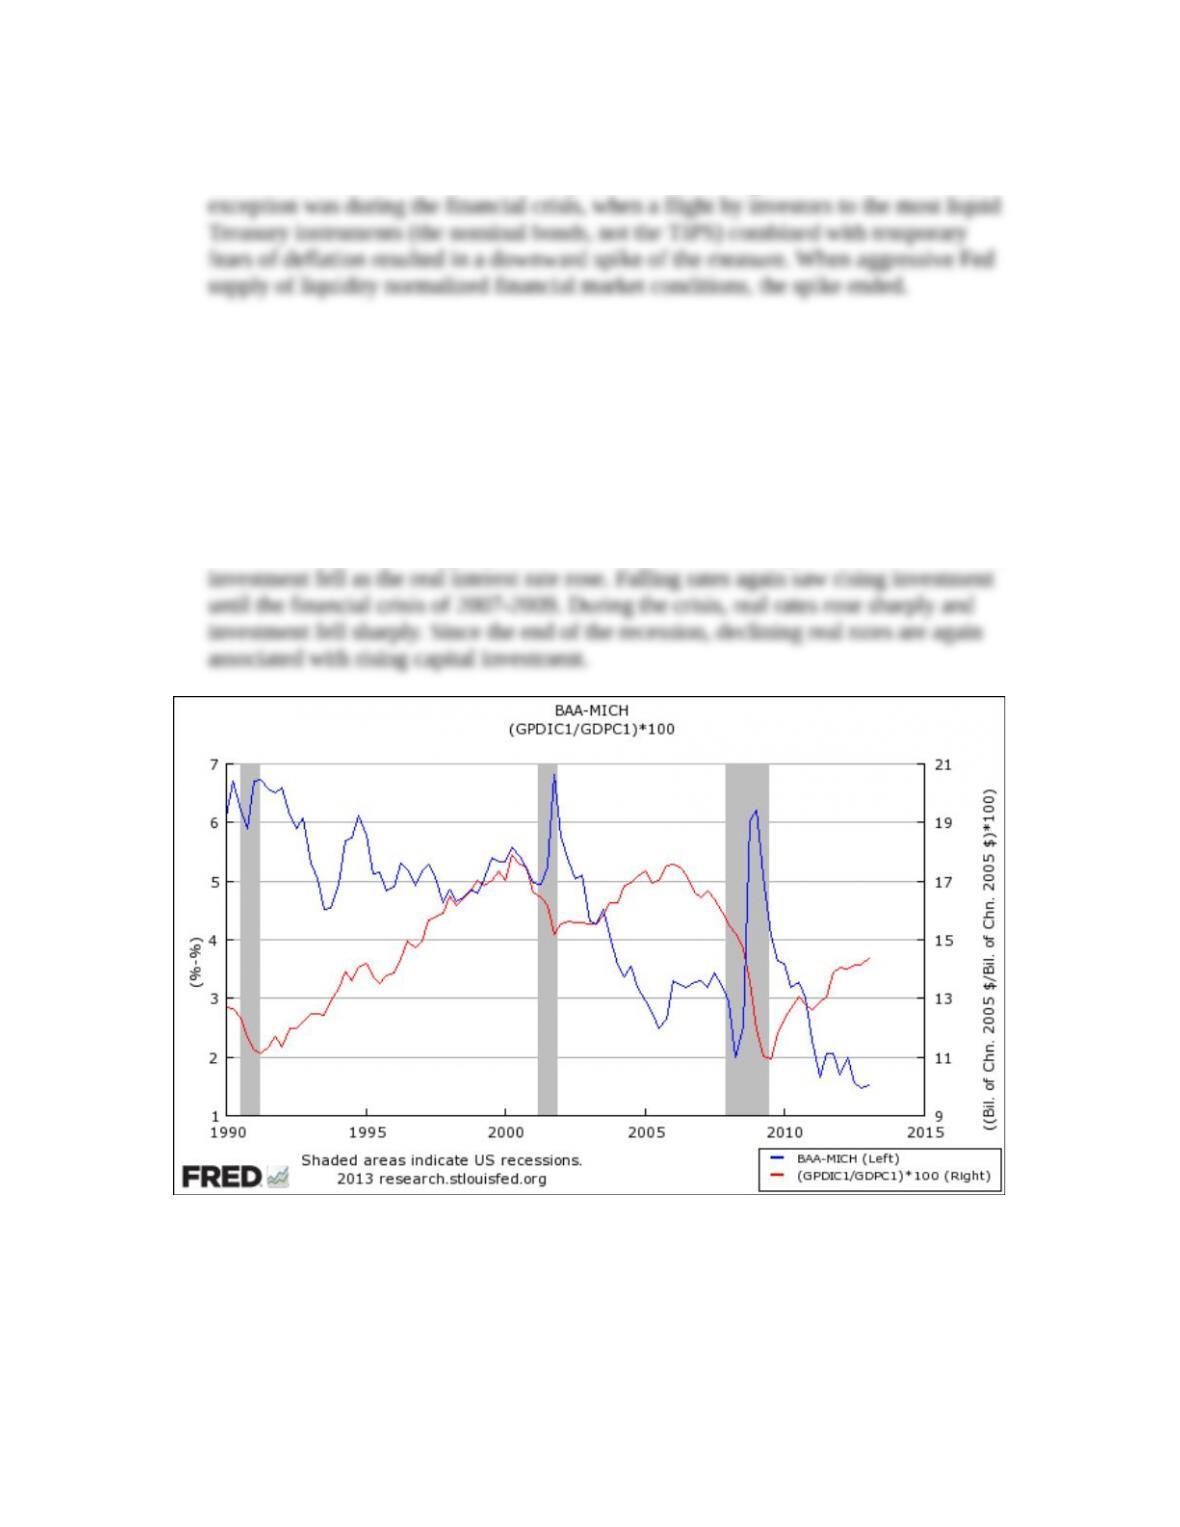
2. Is investment sensitive to the real interest rate? Plot since 1990 a measure of the real
interest rate – based on the difference between Moody’s Baa corporate rate (FRED
code: BAA) and a survey of expected inflation (FRED code: MICH) – and (on the
right scale) the share of investment (FRED code: GPDIC1) in real GDP (FRED code:
GDPC1). Explain the cyclical pattern. (LO2)
Answer: The data is plotted below, where falling real interest rates through the 1990s
were associated with rising capital investment. Note that during the recession of 2001,
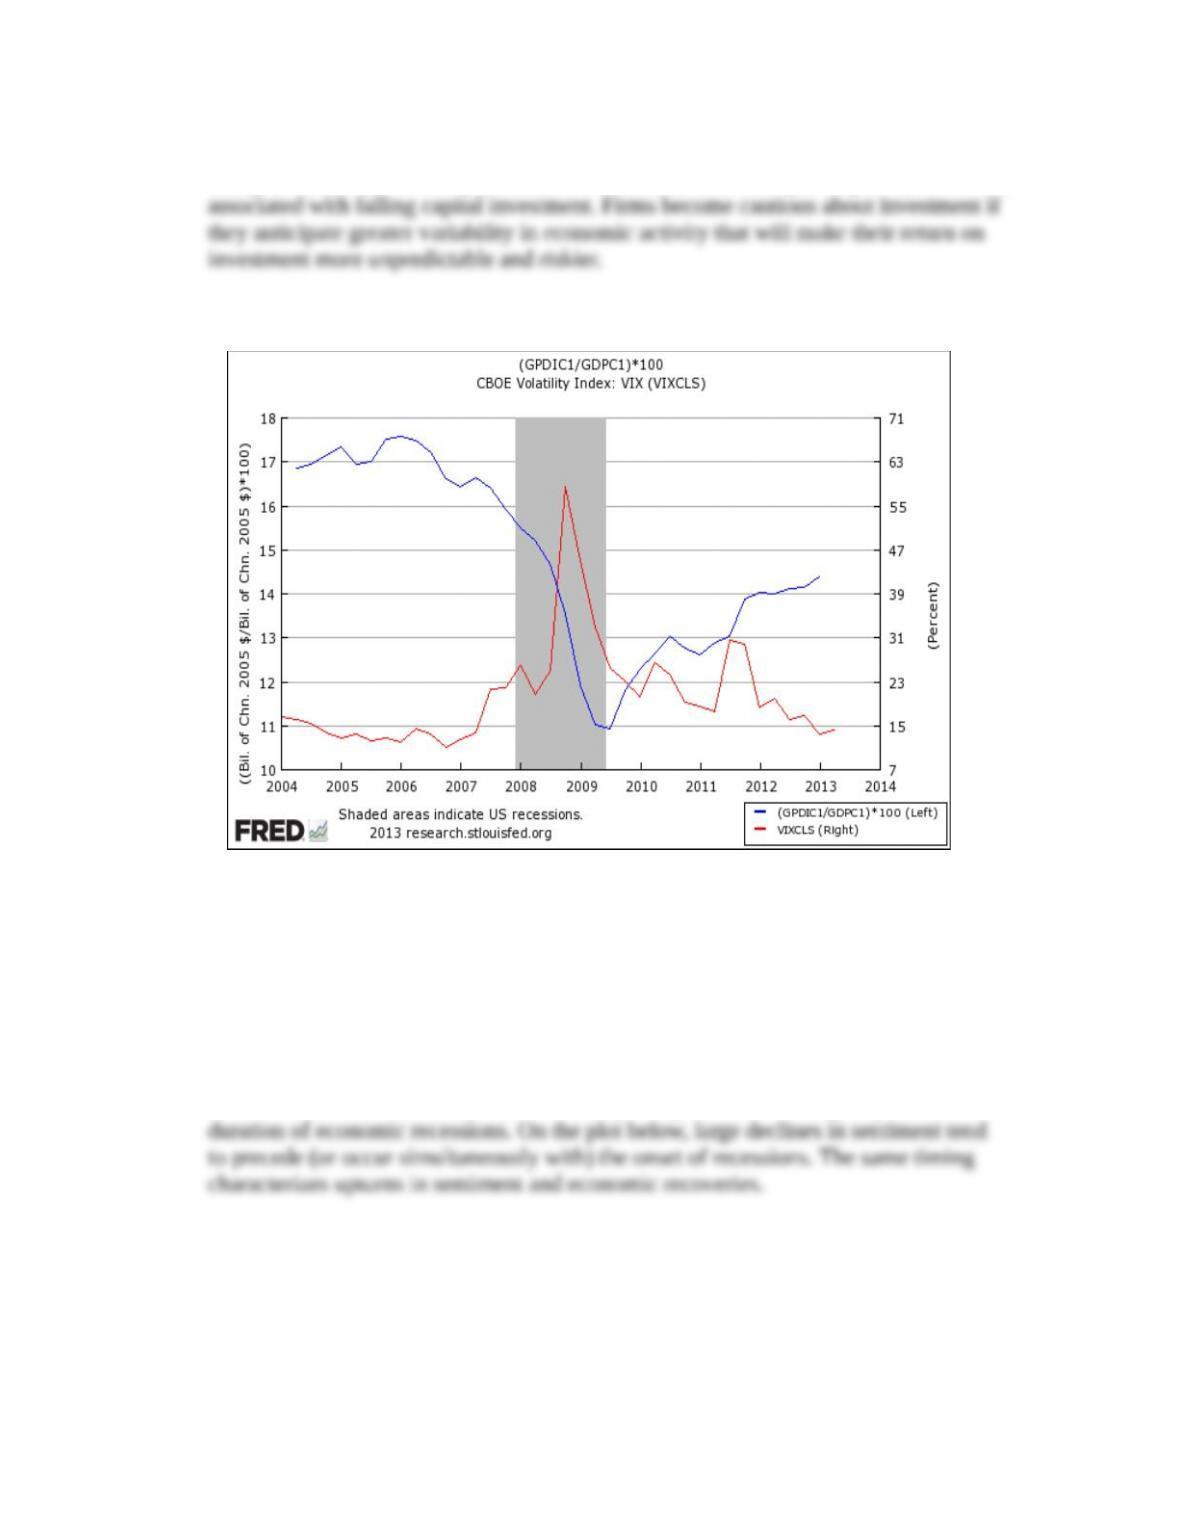
3. How sensitive is private investment to risk? Plot since 2004 the share of real gross
private domestic investment (FRED code: GPDIC1) in real GDP (FRED code:
GDPC1) and (on the right scale) a measure of anticipated stock market volatility
(FRED code: VIXCSL). Explain the pattern. (LO2)
21-8
© 2015 by McGraw-Hill Education. This is proprietary material solely for authorized instructor use. Not authorized for sale or distribution in
any manner. This document may not be copied, scanned, duplicated, forwarded, distributed, or posted on a website, in whole or part.
Chapter 21 – Output, Inflation and Monetary Policy
Answer: The data plot below is for a short horizon, but suggests that expectations of
rising stock market volatility (measured on the basis of stock options prices) are
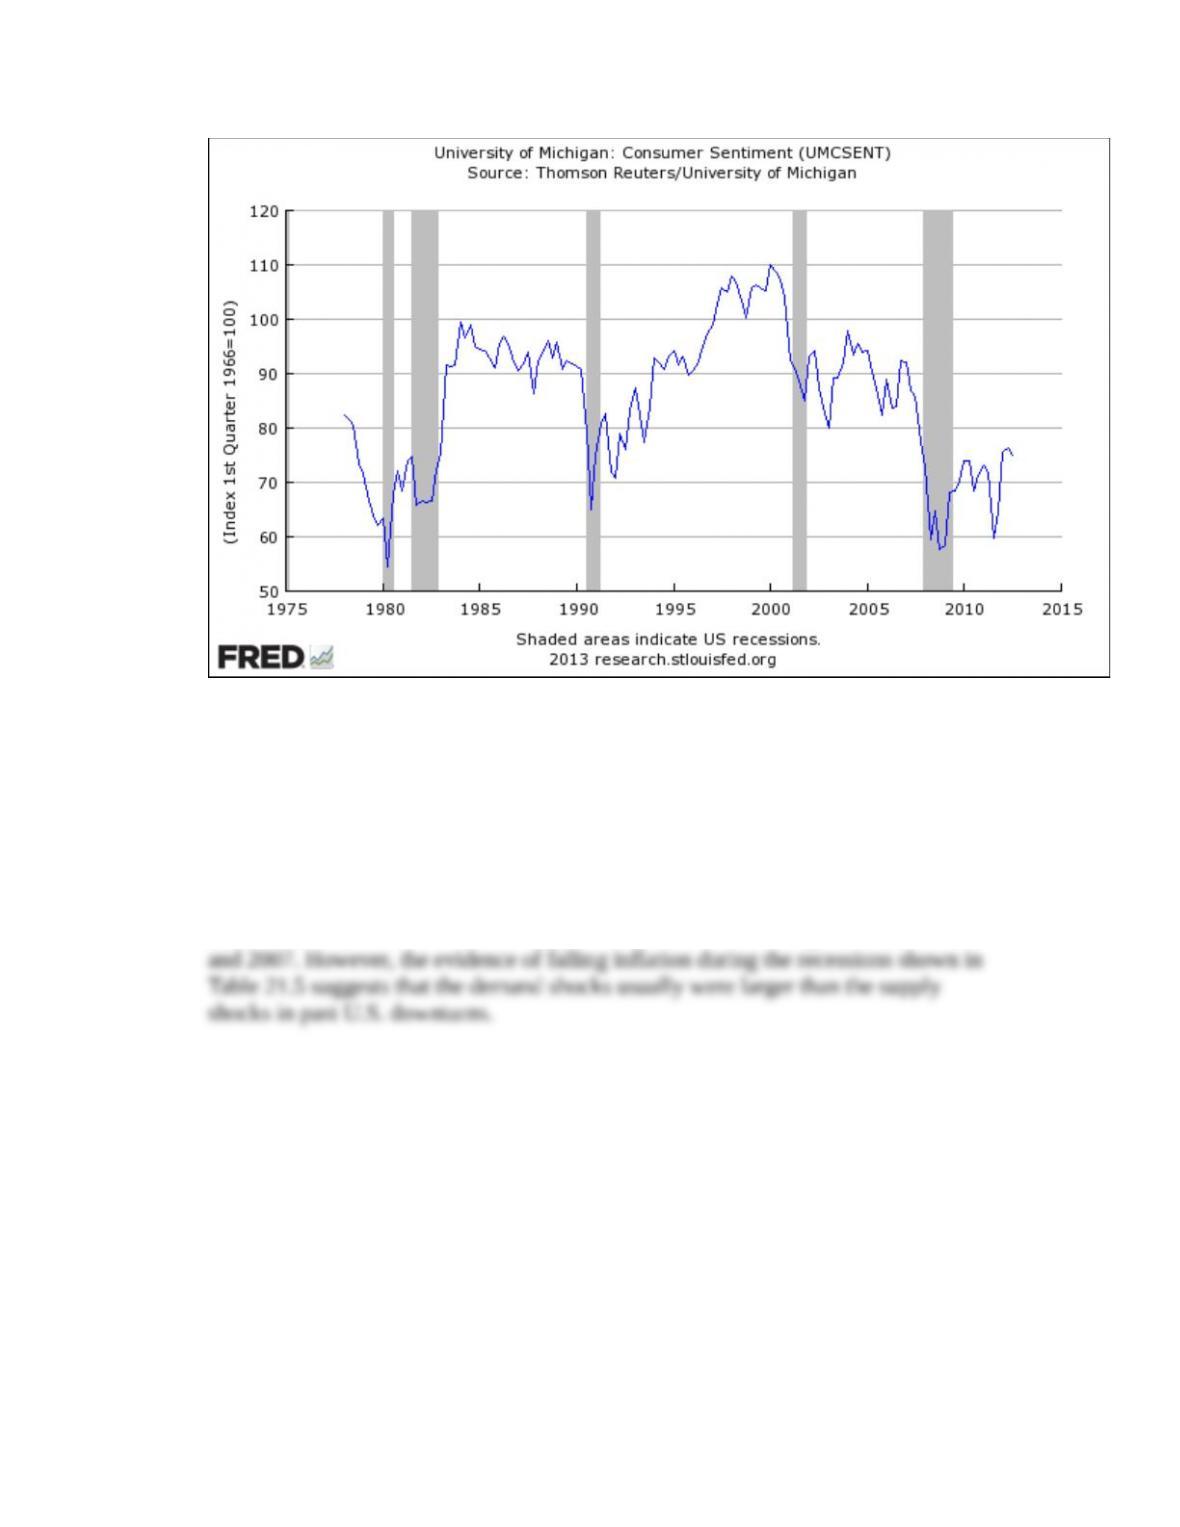
4. A recession may reflect declines in aggregate demand, aggregate supply, or both. Are
swings in consumer sentiment characteristic of recessions? Plot a measure of
sentiment (FRED code: UMCSENT) and discuss its evolution during the recessions
since 1980? Explain why consumer sentiment is an important example of an
aggregate demand shock. (LO3)
Answer: Consumption is about 70 percent of U.S. GDP, so swings in household
sentiment about the economy can have a major impact on the timing, depth, and
21-9
© 2015 by McGraw-Hill Education. This is proprietary material solely for authorized instructor use. Not authorized for sale or distribution in
any manner. This document may not be copied, scanned, duplicated, forwarded, distributed, or posted on a website, in whole or part.
Chapter 21 – Output, Inflation and Monetary Policy
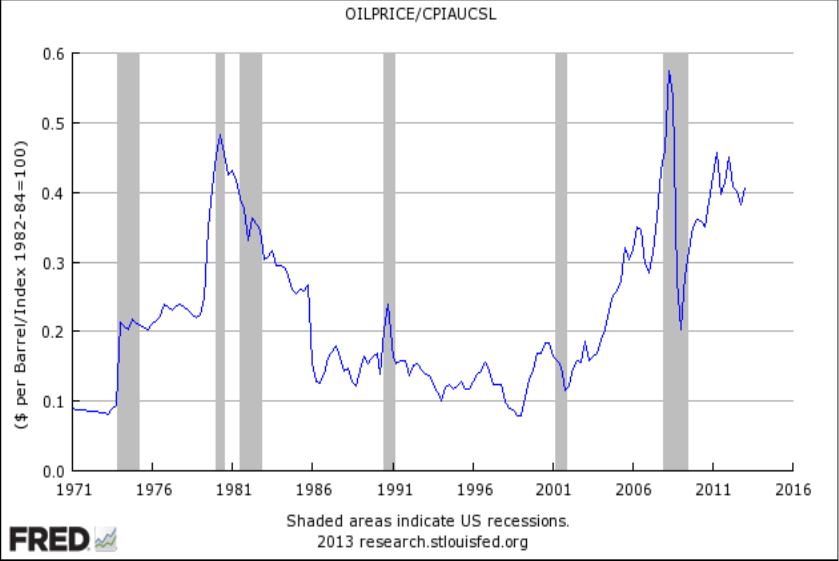
5. How often are negative supply shocks associated with recessions? Plot on a quarterly
basis since 1971 the real price of oil — measured as the ratio of the nominal price of
oil (FRED code: OILPRICE) to the U.S. Consumer Price Index (CPIAUCSL).
Identify recessions that may have been triggered in part by an oil price shock. (LO3)
Answer: Sharp increases in the real price of oil preceded several U.S. recent
recessions. The most obvious instances are the recessions that began in 1973, 1979,
21-10
© 2015 by McGraw-Hill Education. This is proprietary material solely for authorized instructor use. Not authorized for sale or distribution in
any manner. This document may not be copied, scanned, duplicated, forwarded, distributed, or posted on a website, in whole or part.
Chapter 21 – Output, Inflation and Monetary Policy
* indicates more difficult problems
21-11
© 2015 by McGraw-Hill Education. This is proprietary material solely for authorized instructor use. Not authorized for sale or distribution in
any manner. This document may not be copied, scanned, duplicated, forwarded, distributed, or posted on a website, in whole or part.