Chapter – 20 – Money Growth, Money Demand, and Modern Monetary Policy
Chapter 20
Money Growth, Money Demand, and
Modern Monetary Policy
Conceptual and Analytical Problems
1. Why is inflation higher than money growth in high-inflation countries and lower than
money growth in low-inflation countries? (LO1)
Answer: At very high levels of inflation, the velocity of money rises dramatically as
2. * Explain why giving an independent central bank control over the quantity of money
in the economy should reduce the occurrences of periods of extremely high inflation,
especially in developing economies. (LO1)
Answer: Inflation is a monetary phenomenon and independent central banks are
more likely than governments (who may be looking for a way to finance spending for
3. If velocity were constant at 2 while M2 rose from $5 trillion to $6 trillion in a single
year, what would happen to nominal GDP? If real GDP rose 3 percent, what would
be the level of inflation? (LO2)
Answer: Money growth + velocity growth = growth of nominal GDP, so nominal
4. According to Irving Fisher, when velocity and output are fixed, the quantity theory of
money implies that inflation equals money growth. What does the quantity theory
imply for inflation in the long run in an economy with growing output and stable
velocity? (LO2)
Answer: Using equation (4), %∆M + %∆V = %∆P + %∆Y, if velocity is constant,
20-1
© 2015 by McGraw-Hill Education. This is proprietary material solely for authorized instructor use. Not authorized for sale or distribution in
any manner. This document may not be copied, scanned, duplicated, forwarded, distributed, or posted on a website, in whole or part.
Chapter – 20 – Money Growth, Money Demand, and Modern Monetary Policy
5. If velocity were predictable but not constant, would a monetary policy that fixed the
growth rate of money work? (LO2)
Answer: We know that money growth + velocity growth = inflation + real growth. If
velocity is not constant, then fixing the growth rate of money will result in either
6. Describe the impact of financial innovations on the demand for money and velocity.
(LO3)
Answer: Financial innovations reduce the demand for money and increase velocity.
By making alternatives to money more liquid, individuals need less money as a
7. Suppose that expected inflation rises by 3 percent at the same time that the yields on
money and on non-money assets both rise by 3 percent. What will happen to the
demand for money? What if expected inflation rose by only 2 percent? What if the
yield on non-money assets rose by 4 percent? (LO3)
Answer: Money demand depends in part on its opportunity cost, the difference
between the real yield on non-money assets and the real yield on money. If expected
inflation rises by 3 percent as the yields on money and on non-money assets also rise
8. *Explain how money growth reduces the purchasing power of money. (LO2)
Answer: By increasing the supply of money, holding demand for money constant, the
9. Provide arguments both for and against the Federal Reserve’s adoption of a target
growth rate for M2. What assumptions would be necessary to compute such a target
rate? (LO1)
20-2
© 2015 by McGraw-Hill Education. This is proprietary material solely for authorized instructor use. Not authorized for sale or distribution in
any manner. This document may not be copied, scanned, duplicated, forwarded, distributed, or posted on a website, in whole or part.
Chapter – 20 – Money Growth, Money Demand, and Modern Monetary Policy
Answer: In the long run, inflation is tied to money growth. However, in the short run,
the velocity of money is volatile, and controlling the growth rate of money does not
10. Explain why we observed a fall in the velocity of M2 during the financial
crisis of 2007-2009. (LO3)
Answer: The increase in uncertainty during the financial crisis drove investors to
11. Comment on the role given to money in the monetary policy strategy of the
ECB. (LO1)
Answer: Although the ECB has downgraded the role initially given to money in its
monetary policy strategy, it still pays more attention to money than its U.S.
12. Countries A and B both have the same money growth rate and in both countries, real
output is constant. In Country A velocity is constant while in Country B velocity has
fallen. In which country will inflation be higher? Explain why. (LO2)
Answer: Using the equation of exchange, money growth + velocity growth = Inflation
13. Consider a country where the level of excess reserves fluctuates widely and
unpredictably. Would such a country be a good candidate for a money growth rule to
guide monetary policy? Explain your answer. (LO4)
Answer: This country would not be a good candidate. One requirement for a money
growth rule to be effective at controlling inflation is for there to be a stable link
20-3
© 2015 by McGraw-Hill Education. This is proprietary material solely for authorized instructor use. Not authorized for sale or distribution in
any manner. This document may not be copied, scanned, duplicated, forwarded, distributed, or posted on a website, in whole or part.
Chapter – 20 – Money Growth, Money Demand, and Modern Monetary Policy
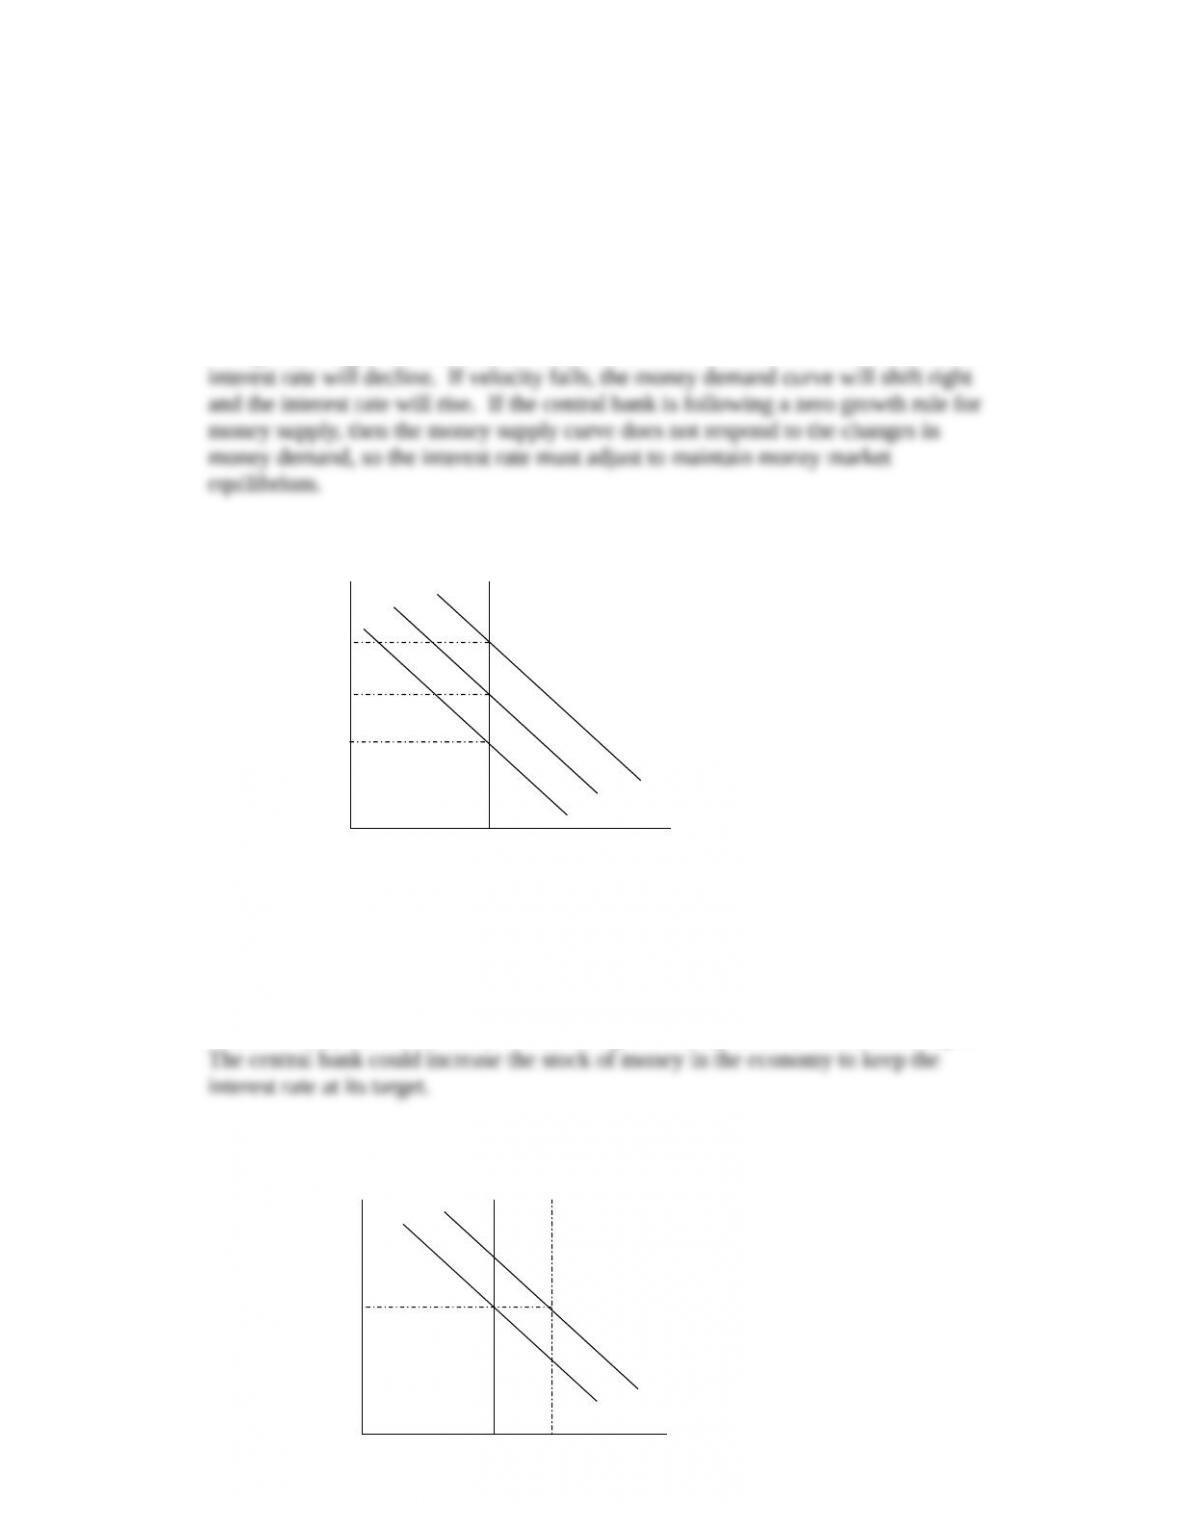
14. Draw a graph of money demand and money supply with the nominal interest rate on
the vertical axis and money balances on the horizontal axis. Assume the central bank
is following a money growth rule where its sets the growth rate of money supply to
zero. Use the graph to illustrate how fluctuations in velocity imply that targeting
money growth results in greater volatility of interest rates. (LO4)
Answer: Changes in velocity are reflected in shifts in the money demand curve. For
example, if financial innovation causes money demand to be lower (and so velocity to
be higher) at a given interest rate, this will shift the demand curve to the left and the
15. Using the same graph as that described in Problem 14, show how the central bank
could use its control over the quantity of money to target a particular interest rate in
the face of changes in velocity. (LO4)
Answer: Suppose that velocity falls, shifting the money demand curve to the right.
20-4
© 2015 by McGraw-Hill Education. This is proprietary material solely for authorized instructor use. Not authorized for sale or distribution in
any manner. This document may not be copied, scanned, duplicated, forwarded, distributed, or posted on a website, in whole or part.
Money Supply
Interest rate
Money
Money Demand
Money Supply
Interest rate
Money
Money Demand
i*
Chapter – 20 – Money Growth, Money Demand, and Modern Monetary Policy
16. Why might targeting the money supply lead to lower output growth than targeting the
rate of interest? Consider your responses to Problems 14 and 15 before you answer.
(LO4)
Answer: In your answer to Problem14, you found that targeting the money supply
resulted in interest rate volatility (see Figure 20.8 for an example of increased interest
17. Which of the following factors would increase the transactions demand for money?
Explain your choices. (LO3)
a. Lower nominal interest rates.
b. Rumors that a computer virus had invaded the ATM network.
c. A fall in nominal income.
Answer: Both (a) and (b) would increase the transactions demand for money.
Lower nominal interest rates lower the opportunity cost of holding money and so
18. Which of the following factors would increase the portfolio demand for money?
Explain your choices. (LO3)
a. A new website allows you to liquidate your stock holdings quickly and
cheaply.
b. You expect future interest rates to rise.
c. A financial crisis is looming.
Answer: Both (b) and (c) would increase the portfolio demand for money. If future
interest rates are expected to rise, bond prices will drop, leading to a capital loss for
20-5
© 2015 by McGraw-Hill Education. This is proprietary material solely for authorized instructor use. Not authorized for sale or distribution in
any manner. This document may not be copied, scanned, duplicated, forwarded, distributed, or posted on a website, in whole or part.
Chapter – 20 – Money Growth, Money Demand, and Modern Monetary Policy
19. *Suppose a central bank is trying to decide whether to target money growth.
Proponents of the move are confident that the new policy would be successful as,
under the existing policy regime, they observed a stable statistical relationship
between money growth and inflation. What warning might you issue to the central
bank when they ask your advice? (LO1)
Answer: You should warn the central bank that altering its policy may alter people’s
Data Exploration
1. A scatter plot can reveal a relationship between two indicators. Construct a scatter
plot of annual data beginning in 1959 for inflation and money growth. Measure these
as the percent change from a year ago of consumer prices (FRED code: CPIAUCSL)
and M2 (FRED code: M2SL), respectively. Then, display a second scatterplot of
annual data beginning in 1959 for inflation (measured as before) and the federal funds
rate (FRED code: FEDFUNDS). Which indicator is more closely linked to inflation:
money growth or the interest rate? Does that tell us which is the better policy
instrument? (LO2)
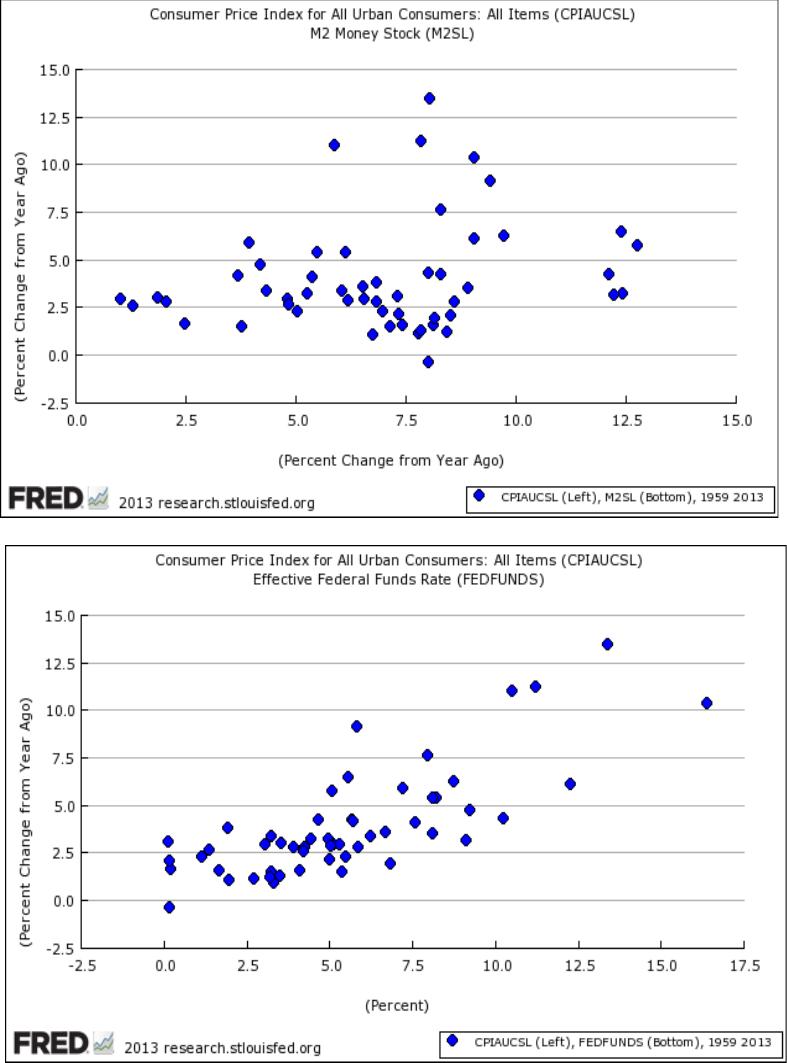
Answer: The scatter plots are below. The federal funds rate appears more closely
linked to inflation. However, this information is insufficient to determine the correct
monetary policy tool. Correlation is not necessarily causation, so while the interest
20-6
© 2015 by McGraw-Hill Education. This is proprietary material solely for authorized instructor use. Not authorized for sale or distribution in
any manner. This document may not be copied, scanned, duplicated, forwarded, distributed, or posted on a website, in whole or part.
Chapter – 20 – Money Growth, Money Demand, and Modern Monetary Policy
2. Plot the percentage change from a year ago of the velocity of money (FRED code:
A14187USA163NNBR) between 1922 and 1939. Compare the typical scales of the
velocity declines during the recessions of this “interwar” period and the velocity
declines during the recessions shown in Panel B of Figure 20.4. Were the 1929-33 and
2007-2009 periods special? What role might wealth have played in these two
episodes? (LO3)
20-7
© 2015 by McGraw-Hill Education. This is proprietary material solely for authorized instructor use. Not authorized for sale or distribution in
any manner. This document may not be copied, scanned, duplicated, forwarded, distributed, or posted on a website, in whole or part.
Chapter – 20 – Money Growth, Money Demand, and Modern Monetary Policy
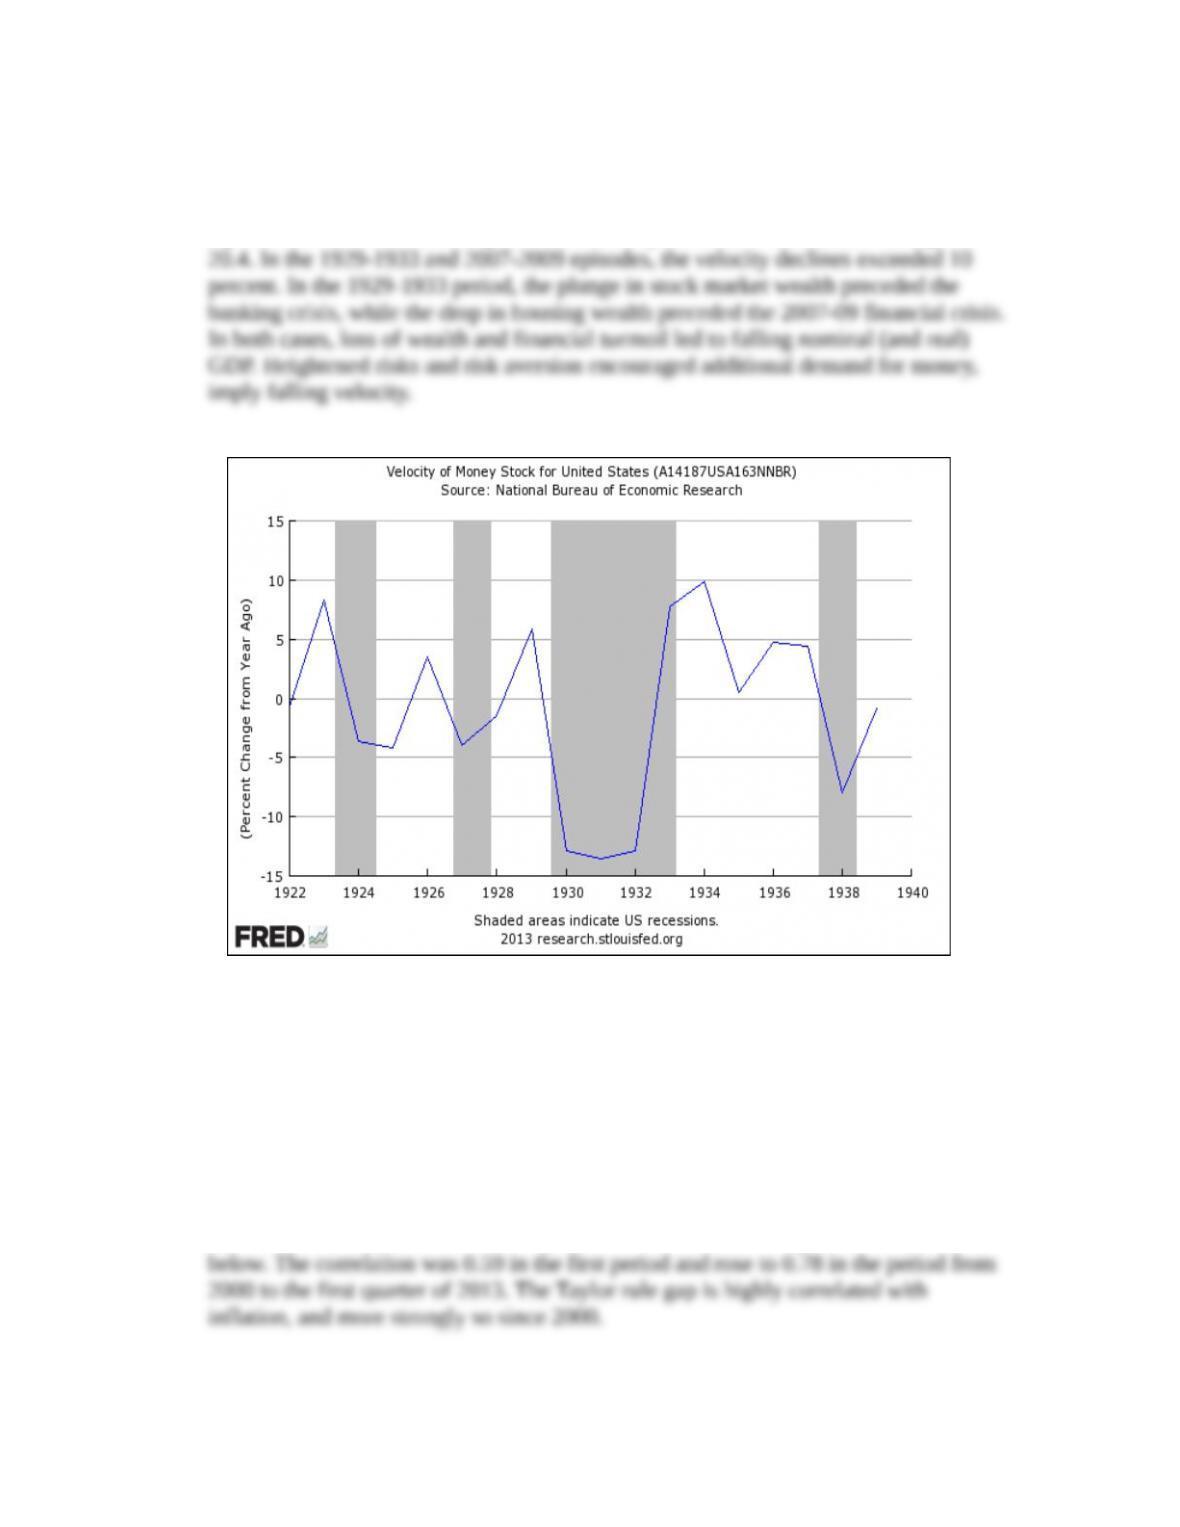
Answer: The data plot for the interwar period is below. Aside from the Great
Depression and the 2007-2009 financial crisis, the declines in velocity averaged about
5 percent in both the interwar period and in the period shown in Panel B of Figure
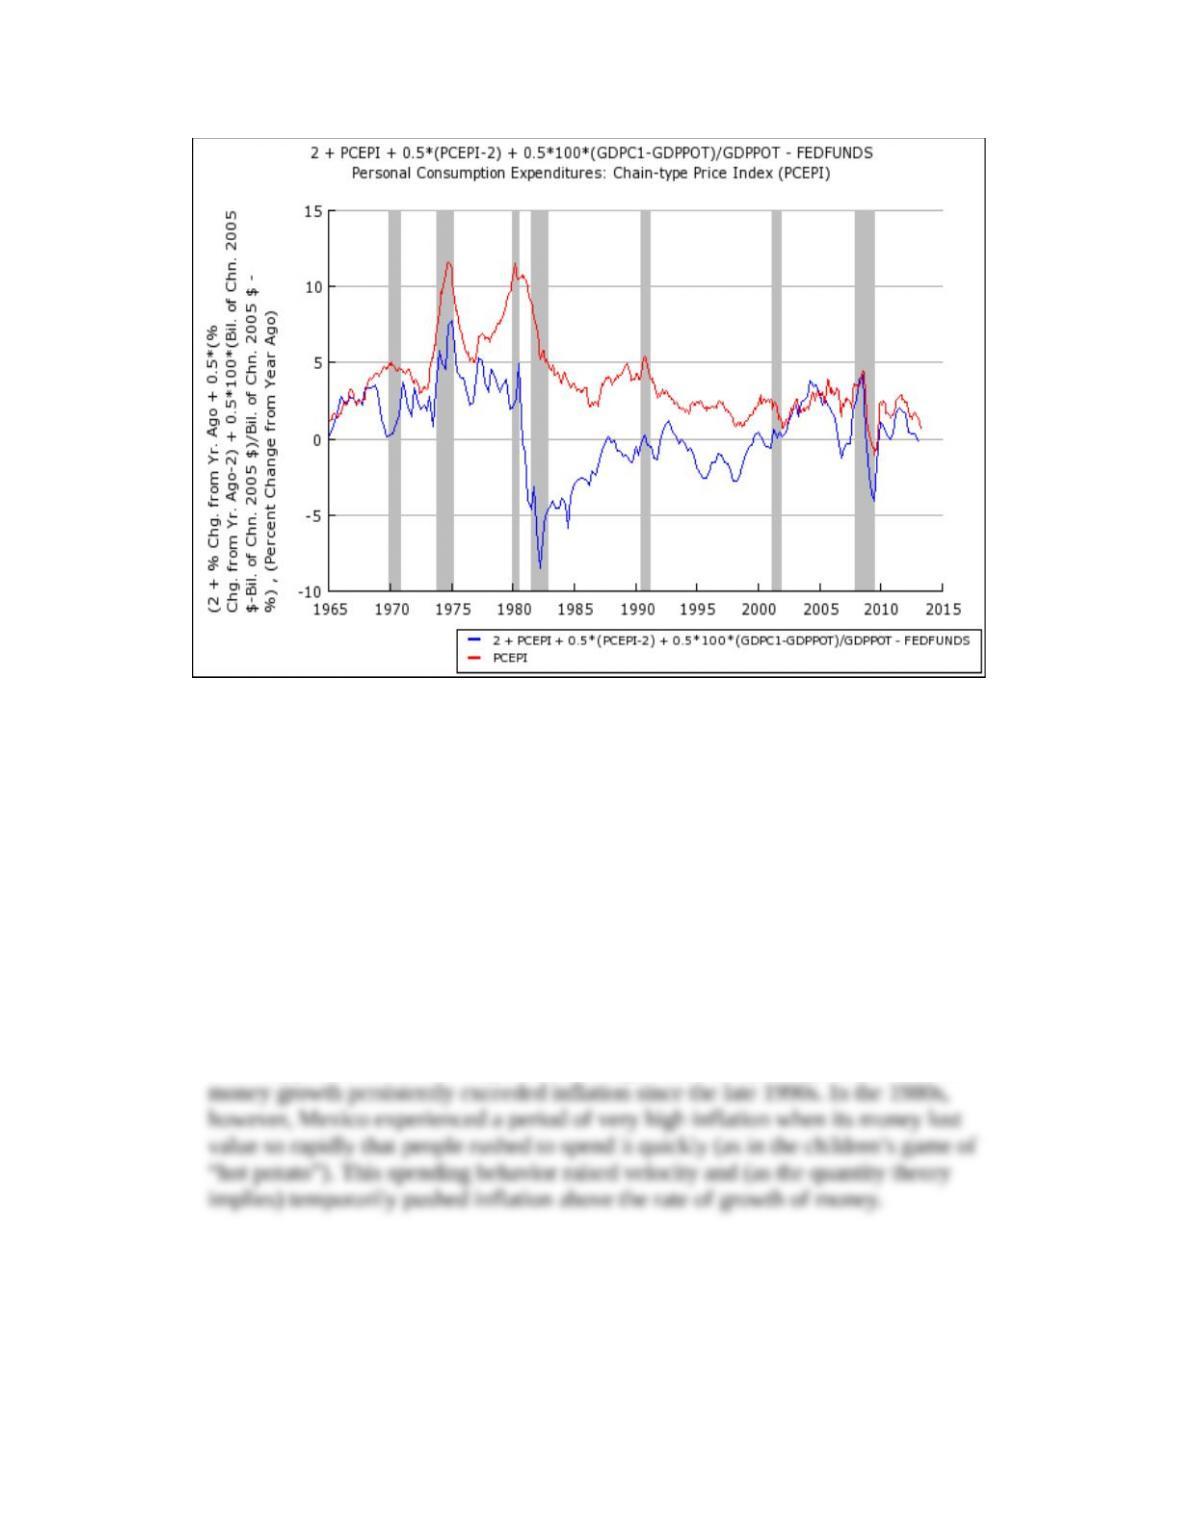
3. * In Chapter 18 Data Exploration Problem 2, you plotted the inflation rate together
with the gap between the Taylor rule and the federal funds rate. Visually, when the
Taylor rule gap was positive, inflation appeared relatively high; when it was negative,
inflation appeared relatively low. Download the two indicators and compute the
correlation between the gap and inflation (a) from 1992 to 1999; and (b) from 2000 to
the present. What do the results suggest? (LO4)
Answer: The data plot from Data Exploration Problem 2 in Chapter 18 is repeated
20-8
© 2015 by McGraw-Hill Education. This is proprietary material solely for authorized instructor use. Not authorized for sale or distribution in
any manner. This document may not be copied, scanned, duplicated, forwarded, distributed, or posted on a website, in whole or part.
Chapter – 20 – Money Growth, Money Demand, and Modern Monetary Policy
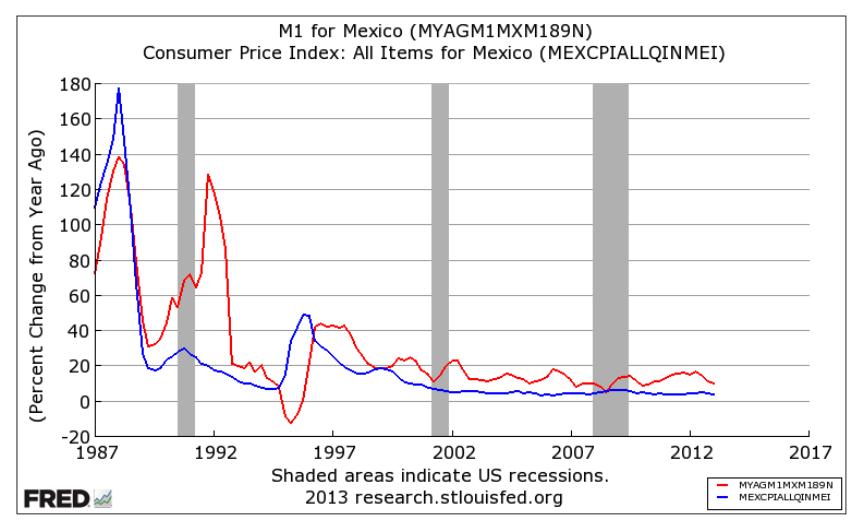
4. In Figure 20.1, which compares money growth and inflation over an extended time
period, is Mexico a country above or below the 45o line? Plot since 1987 on a
quarterly basis the percent change from a year ago of the consumer price index
(FRED code: MEXCPIALLQINMEI) and of M1 (FRED code:
MYAGM1MXM189N) in Mexico. Then download the data and calculate the
averages of these inflation and money growth measures. Where would Mexico appear
on Figure 20.1? Were there episodes since 1987 when Mexico was on the other side
of the 45-degree line? If so, why? (LO2)
Answer: The plot appears below. The average of the annual inflation rate was 21
percent, while the average rate of annual money growth was 31 percent. So, Mexico
would appear below the 45-degree line on Figure 20.1. Inspecting the plot below,
20-9
© 2015 by McGraw-Hill Education. This is proprietary material solely for authorized instructor use. Not authorized for sale or distribution in
any manner. This document may not be copied, scanned, duplicated, forwarded, distributed, or posted on a website, in whole or part.
Chapter – 20 – Money Growth, Money Demand, and Modern Monetary Policy
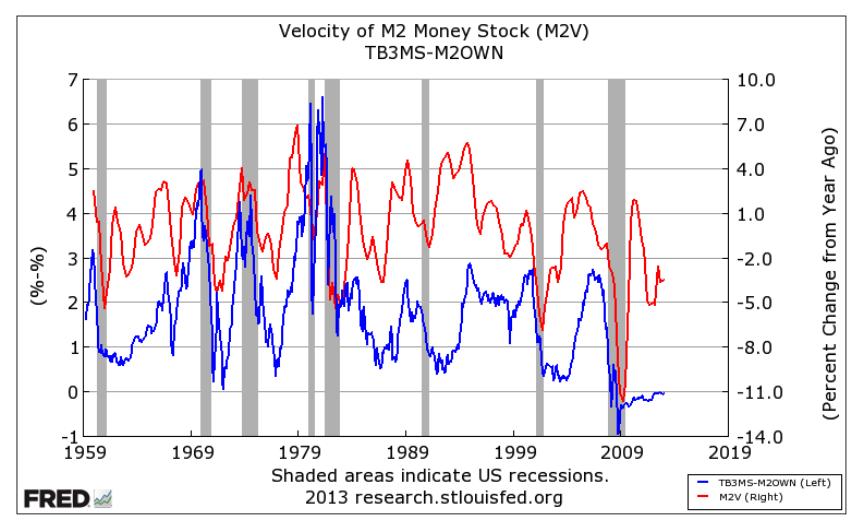
5. In theory, the velocity of money should rise with the cost of holding it. To assess the
theory, plot the opportunity cost of holding M2 – defined as the difference between
the three-month Treasury bill rate (FRED code: TB3MS) and the interest rate on M2
components (FRED code: M2OWN) – and (on the right scale) the percent change
from a year ago of M2 velocity (FRED code: M2V). What do you conclude?
The plot appears below. The opportunity cost of holding M2 appears to rise in
advance of recessions and fall during recessions, consistent with the cycles of M2
velocity. However, after the early 1980s, and especially after the mid-1990s, M2
velocity appears more closely linked to than earlier to the opportunity cost of holding
it. That change in sensitivity also is evident in Figure 20.5.
20-10
© 2015 by McGraw-Hill Education. This is proprietary material solely for authorized instructor use. Not authorized for sale or distribution in
any manner. This document may not be copied, scanned, duplicated, forwarded, distributed, or posted on a website, in whole or part.
Chapter – 20 – Money Growth, Money Demand, and Modern Monetary Policy
* indicates more difficult problems
20-11
© 2015 by McGraw-Hill Education. This is proprietary material solely for authorized instructor use. Not authorized for sale or distribution in
any manner. This document may not be copied, scanned, duplicated, forwarded, distributed, or posted on a website, in whole or part.