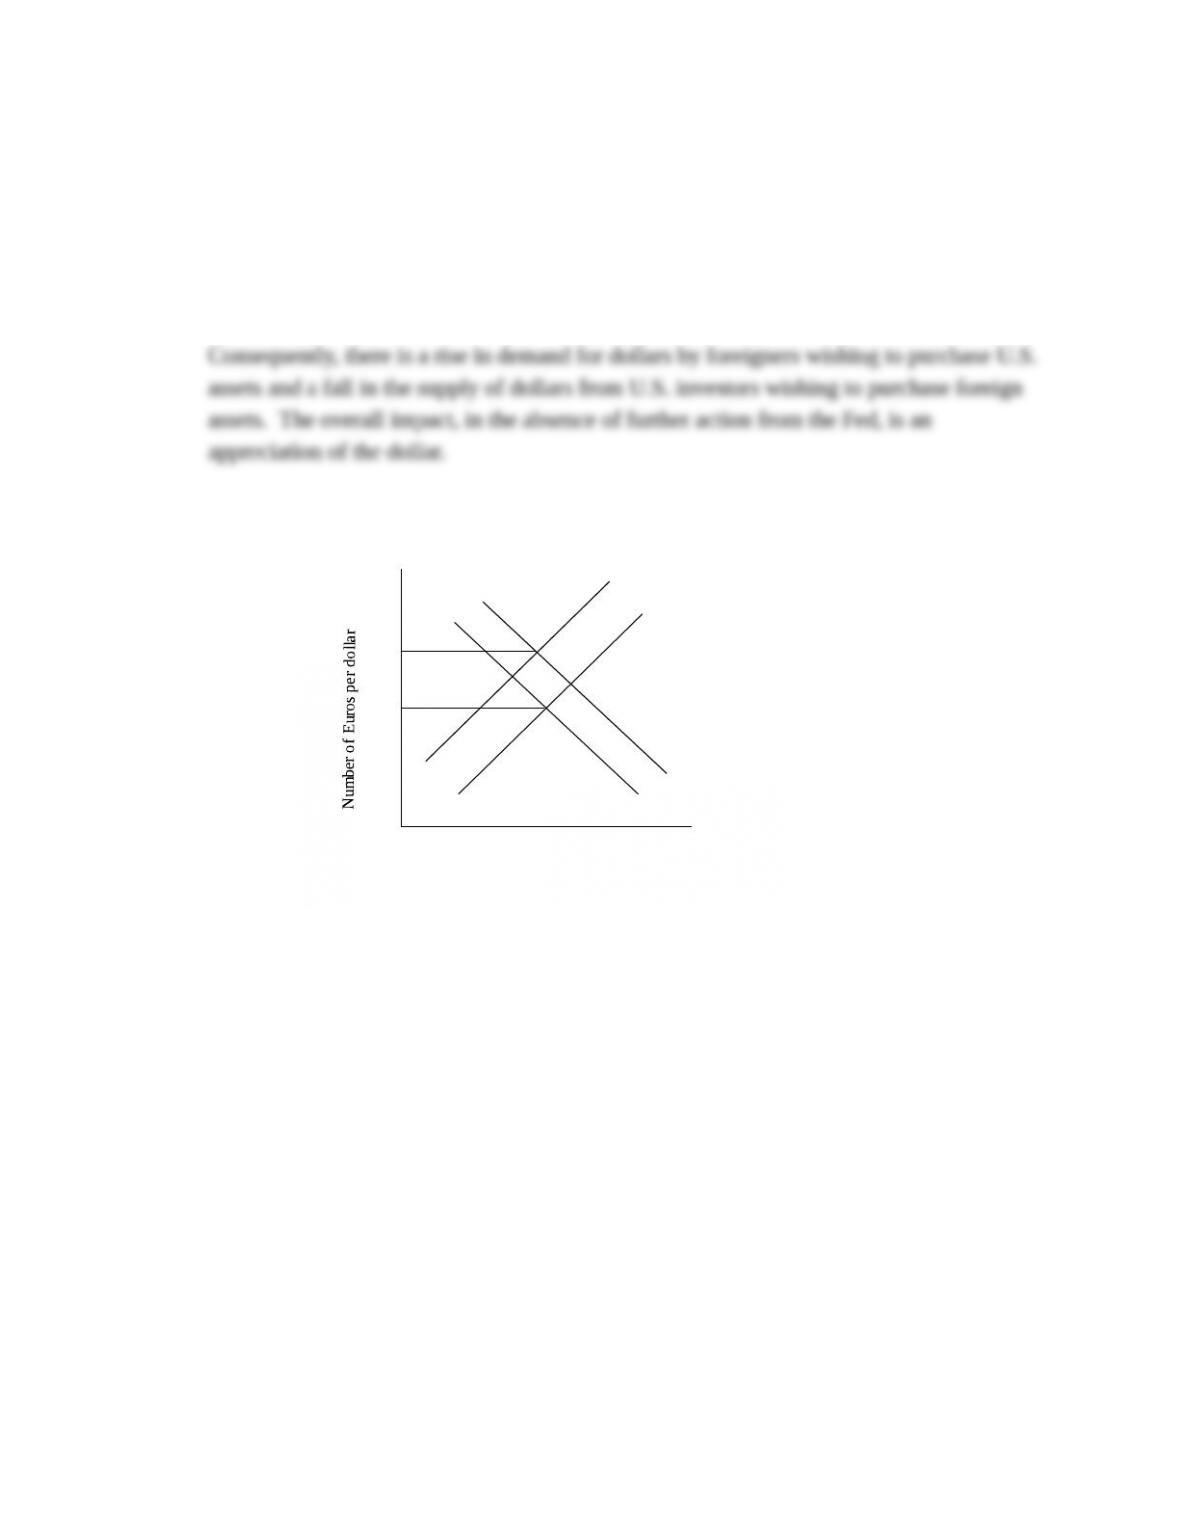
1. Use a supply and demand diagram for dollars to show the impact of an increase in U.S.
interest rates relative to interest rates in the euro area in the wake of a foreign-exchange
market intervention by the Federal Reserve. (LO2)
Answer: If the U.S. interest rate rises as a result of a purchase of dollars from the market
by the Fed, this makes U.S. dollar-denominated assets relatively more attractive.
Quantity of dollars traded
E0
S0
D0
E1
D1
S1
2. Do you think the U.S. dollar is more likely to strengthen or weaken over the next few
months? Explain your reasoning. (LO1)
Answer: Shorter term movements in floating exchange rates, like other asset prices, are
typically unpredictable, with the current exchange rate usually being the best predictor of
3. China’s stock of foreign-exchange reserves has risen more than 20 times since 2000, and
approached $3.5 trillion in the spring of 2013. Do you think that pace of reserve
accumulation is likely to continue? Why or why not? (LO4)
Answer: The pace of accumulation slowed in recent years as economic growth among
China’s trading partners ebbed, and the yuan appreciated both in nominal and real terms.
4. *Consider a small open economy with a wide array of trading partners all operating in
different currencies. The economy’s business cycles are not well synchronized with any
of the world’s largest economies and the policymakers in this country have a well-earned
reputation for being fiscally prudent and honest. In your view, should this small open
economy adopt a fixed exchange-rate regime? (LO3)
Answer: In this situation, fixing the exchange rate does not look like a good idea. Given
Fixing your exchange rate to another currency involves adopting the other country’s
interest rate policy. To reap the benefits of exchange rate stability, countries usually opt
Fixing the exchange rate ties the hands of local policymakers who can often help to gain
5. A small eastern European economy asks your opinion about whether they should pursue
the path to joining the European Economic and Monetary Union (EMU) or simply
“euroize” (i.e. dollarize by using the euro for all domestic transactions). What advice
would you give? (LO3)
Answer: Joining EMU has many advantages over “euroization”. The economy would
Data Exploration
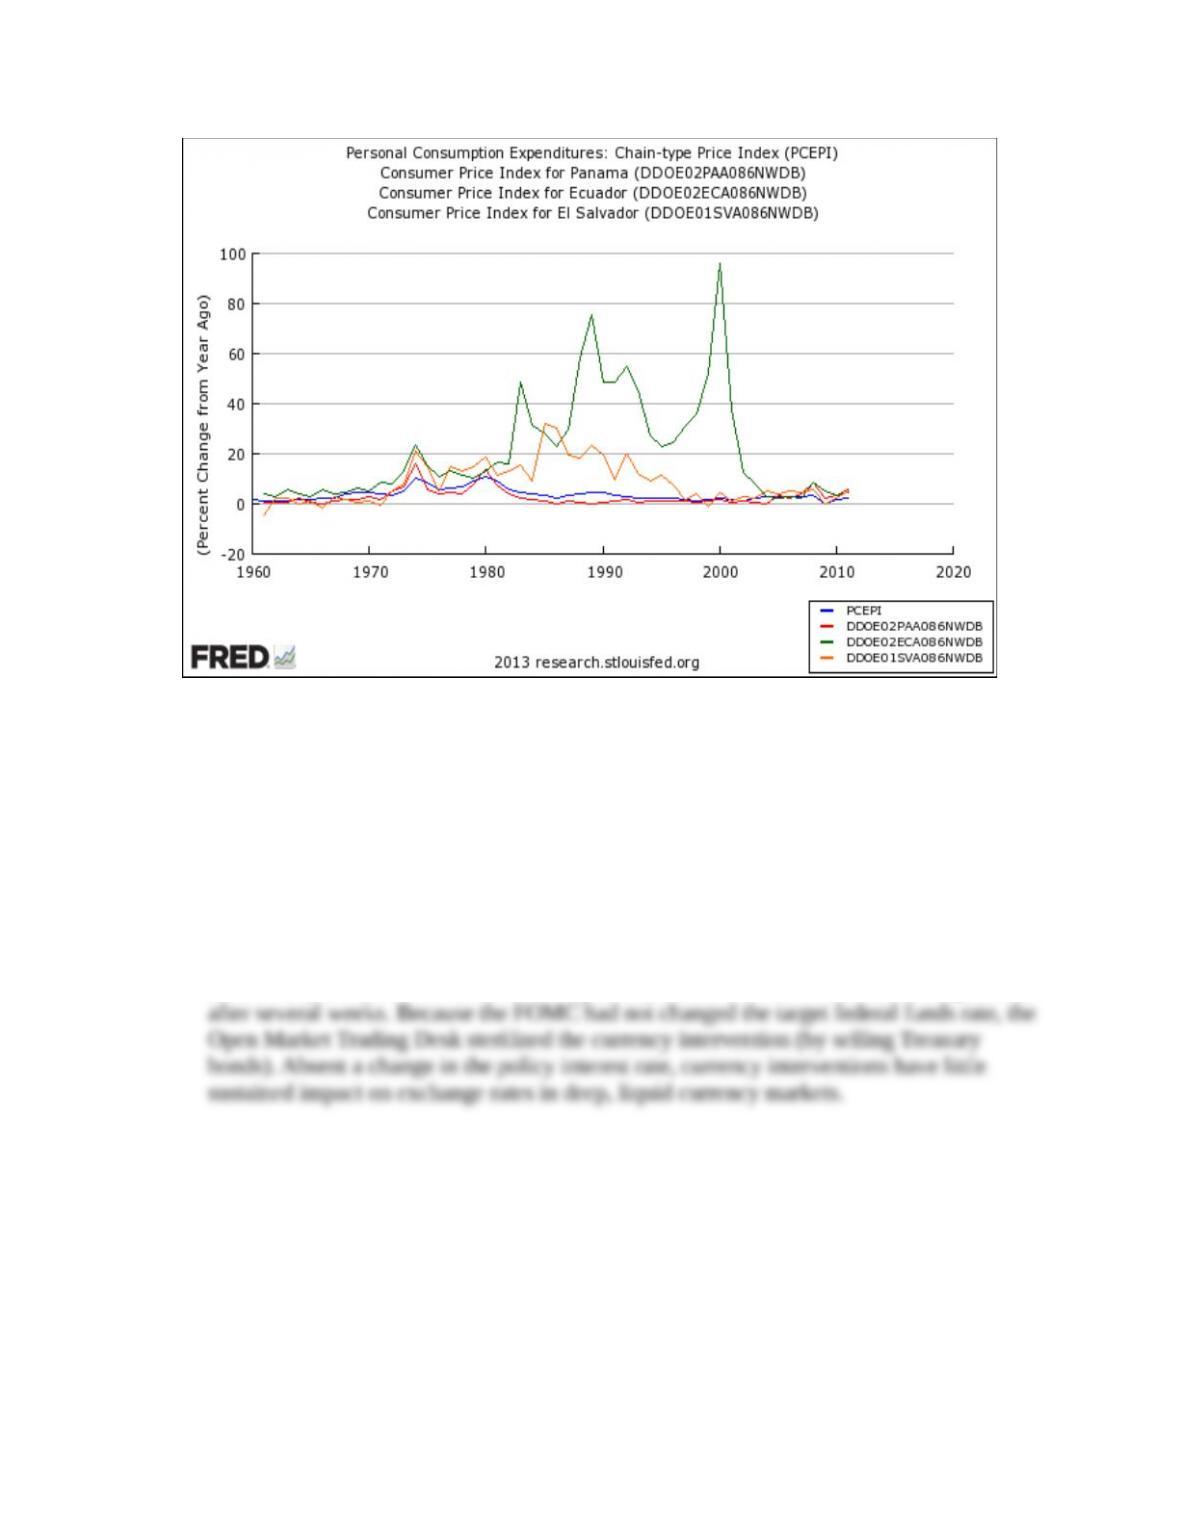
1. Panama, Ecuador, and El Salvador began using the U.S. dollar as their domestic currency
in 1904, 2000, and 2001, respectively. How do you expect their inflation rates to compare
with U.S. inflation? Plot since 1960 the percent change from a year ago of consumer
prices in Panama (FRED code: DDOE02PAA086NWDB), Ecuador (FRED code:
DDOE02ECA086NWDB), El Salvador (FRED code: DDOE01SVA086NWDB) and the
United States (FRED code: PCEPI). Download these data and (starting with the country’s
date of dollarization), compare the average inflation rate in each country with U.S.
inflation. (LO4)
Answer: The data is plotted below. Broadly speaking, the inflation rates of these countries
after their dollarization are similar to U.S. inflation. Panama’s inflation averaged 2.9
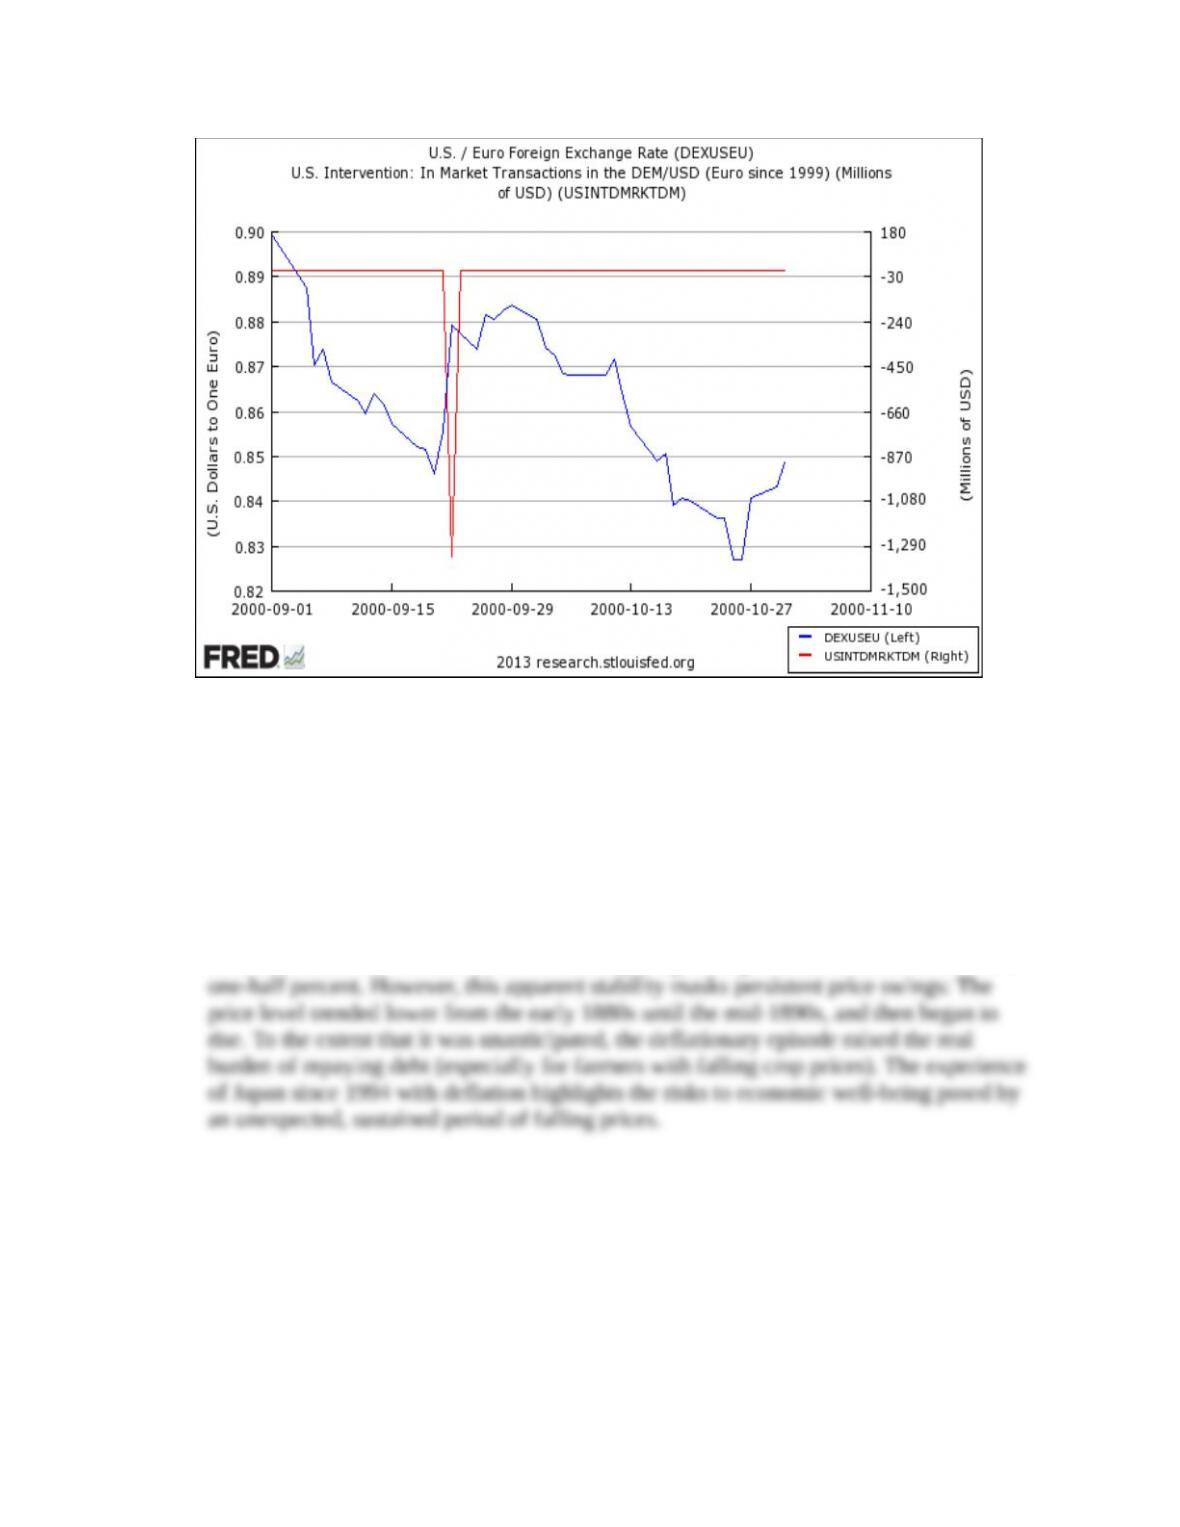
2. Did the September, 2000, currency intervention by the United States and other countries
influence the dollar-euro exchange rate? Plot for the September-October 2000 period the
daily dollar-euro exchange rate (FRED code: EXUSEU) and, on the right scale, the Fed’s
sales of dollars for euros (FRED code: USINTDMRKTDM). Was the intervention
successful? If not, why not? (LO2)
Answer: The data is plot is below. The intervention appears to have boosted the euro only
for a brief period, with the euro returning to its pre-intervention value and sinking further
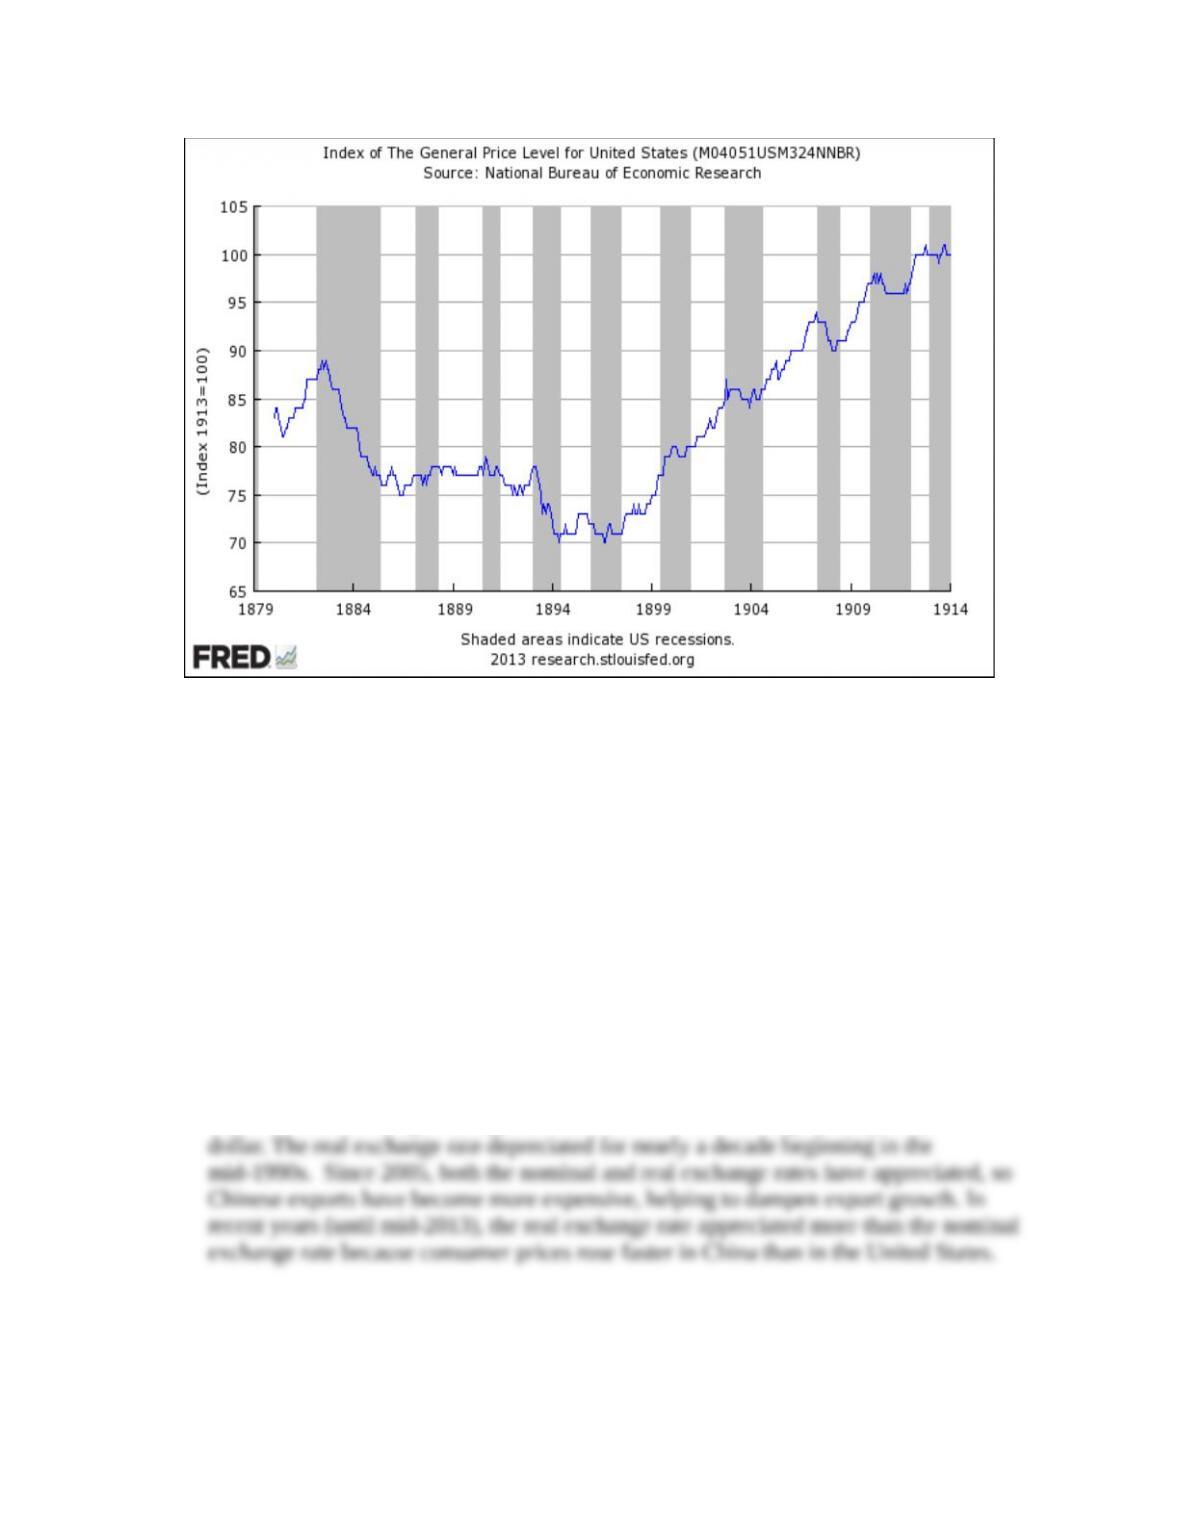
3. Some claim that adoption of a gold standard would contribute to price stability. Was price
stability a feature of the U.S. gold standard that prevailed prior to World War I (see
Applying the Concept on page 537)? Based on a plot of the general price level (FRED
code: M04051USM324NNBR), discuss U.S. price developments from 1880 to 1914.
(LO4)
Answer: The data plot is below. Over the 30-year period from 1882 to 1914, the price
level increased from a value of 87 to 100, implying average annual inflation of less than
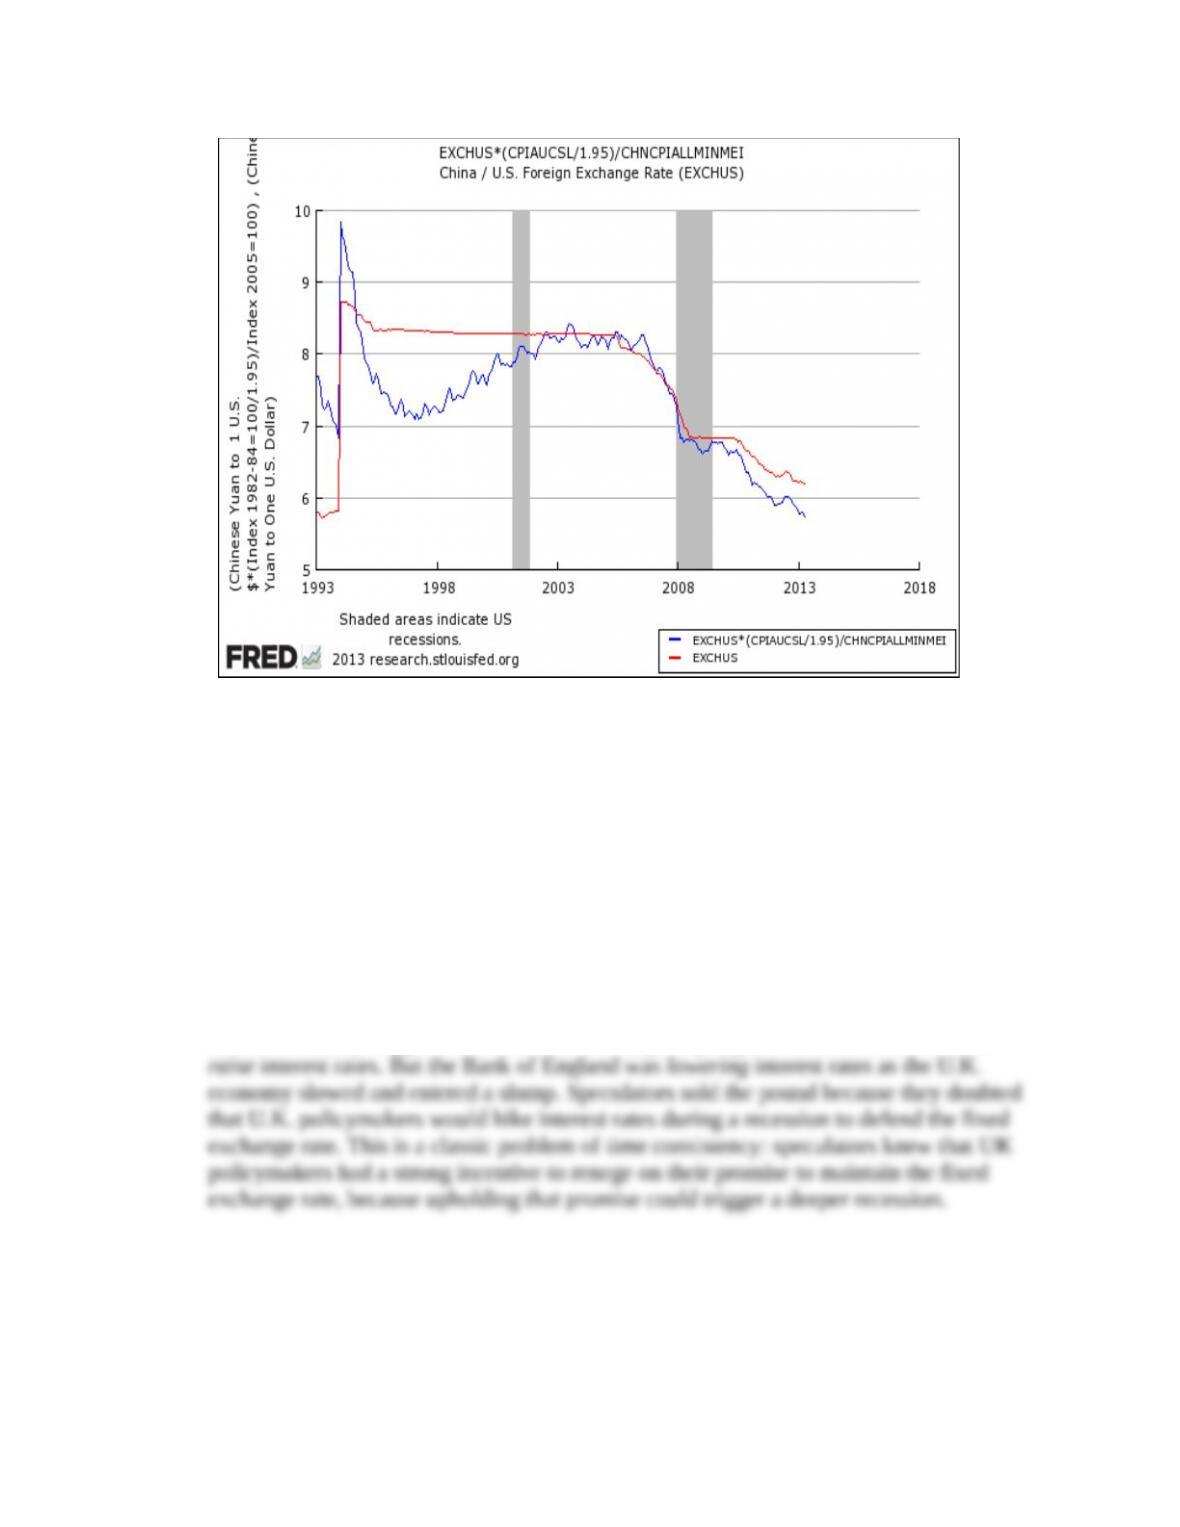
4. China is the world’s largest exporter and has a fixed nominal exchange to the U.S. dollar.
However, China’s real exchange rate, which determines the country’s competitiveness,
can change even when the nominal rate is fixed. Plot since 1993 the nominal exchange
rate of yuan per dollar (FRED code: EXCHUS). When did China begin to allow its
currency to appreciate on a sustained basis? Add to the graph the real exchange rate (see
equation 2 in Chapter 10) by adjusting the yuan-dollar exchange rate for relative
consumer price changes in China (FRED code: CHNCPIALLMINMEI) and the United
States (FRED code: CPIAUCSL). (Hint: Divide the U.S. price index by 1.95 to set a
common base year of 2005=100 for both price indexes used in the real exchange rate
formula,) How has China’s real exchange rate evolved recently? What impact should
these changes have on China’s exports?
Answer: A plot of the nominal and real exchange rates is below. From 1994 to 2005, the
fixed nominal exchange rate appears as a horizontal line at roughly 8.3 yuan per U.S.
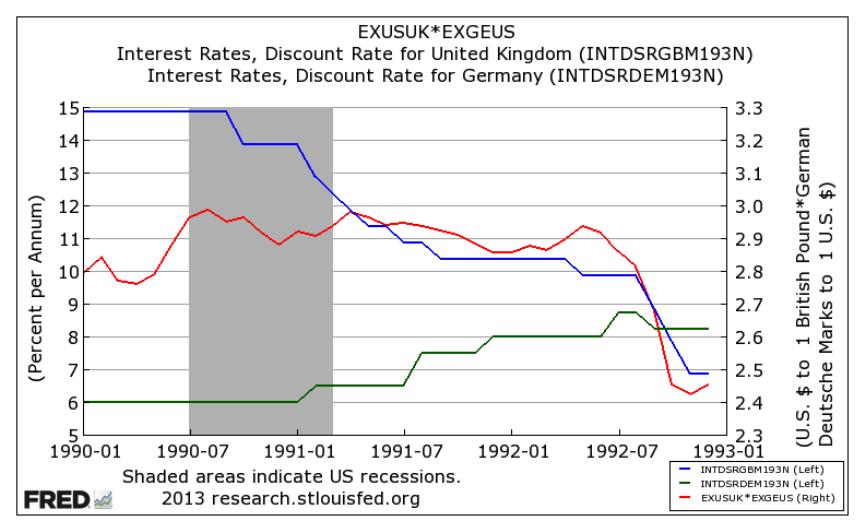
5. In September 1992, a speculative attack compelled the United Kingdom to devalue the
British pound versus the German currency (Deutsche Mark). How did monetary policy in
both countries influence this outcome? Plot from 1990 to 1992 the discount rates in the
United Kingdom (FRED code: INTDSRGBM193N) and Germany (FRED code:
INTDSRDEM193N), and (on the right scale) the exchange rate of German marks per
British pound (obtained by multiplying the number of U.S. dollars per pound (FRED
code: EXUSUK) by the number of Deutsche Marks per U.S. dollar (FRED code:
EXGEUS)). What do you conclude? (LO2)
Answer: The plot appears below. In the early 1990s, the re-unification of western and
eastern Germany triggered an economic boom, prompting the German central bank to
* indicates more difficult problems