18. How might the Federal Reserve exit from the unconventional policies it employed during the
financial crisis of 2007-2009 without causing inflationary problems? (LO4)
Answer: The Fed could tighten monetary policy without selling assets by raising the deposit
19. The central bank of a country facing economic and financial market difficulties asks for your
advice. The bank hit the zero bound with its policy interest rate but it wasn’t enough to
stabilize the economy. Drawing on the actions taken by the Federal Reserve during the
financial crisis of 2007-2009, what might you advise this central bank to do? (LO4)
Answer: You should advise the central bank to use unconventional monetary policy tools.
This could include expanding its balance sheet significantly, providing aggregate reserves
20. *Suppose ECB officials ask your opinion about their operational framework for monetary
policy. You respond by commenting on their success at keeping short-term interest rates
close to target but also express concern about the complexity of their process for managing
the supply of reserves. What specific changes would you suggest the ECB should make to its
system in the future? (LO3)
Answer: As national markets become more integrated, and the euro-area financial crisis
recedes, you might suggest that the ECB concentrate its operations in Frankfurt instead of
Data Exploration
1. Plot the Taylor Rule since 1990 on a quarterly basis (similar to Figure 18.9). For the output
gap, use the percent deviations of real GDP (FRED code: GDPC1) from potential output
(FRED code: GDPPOT). For inflation, use the percent change from a year ago of the price
index for personal consumption expenditures (FRED code: PCEPI). Assume that the long-run
risk-free rate averages 2 percent and the target inflation rate is 2 percent. When complete,
compare the Taylor Rule rate against the actual federal funds rate (FRED code: FEDFUNDS)
after 2007. (LO3)
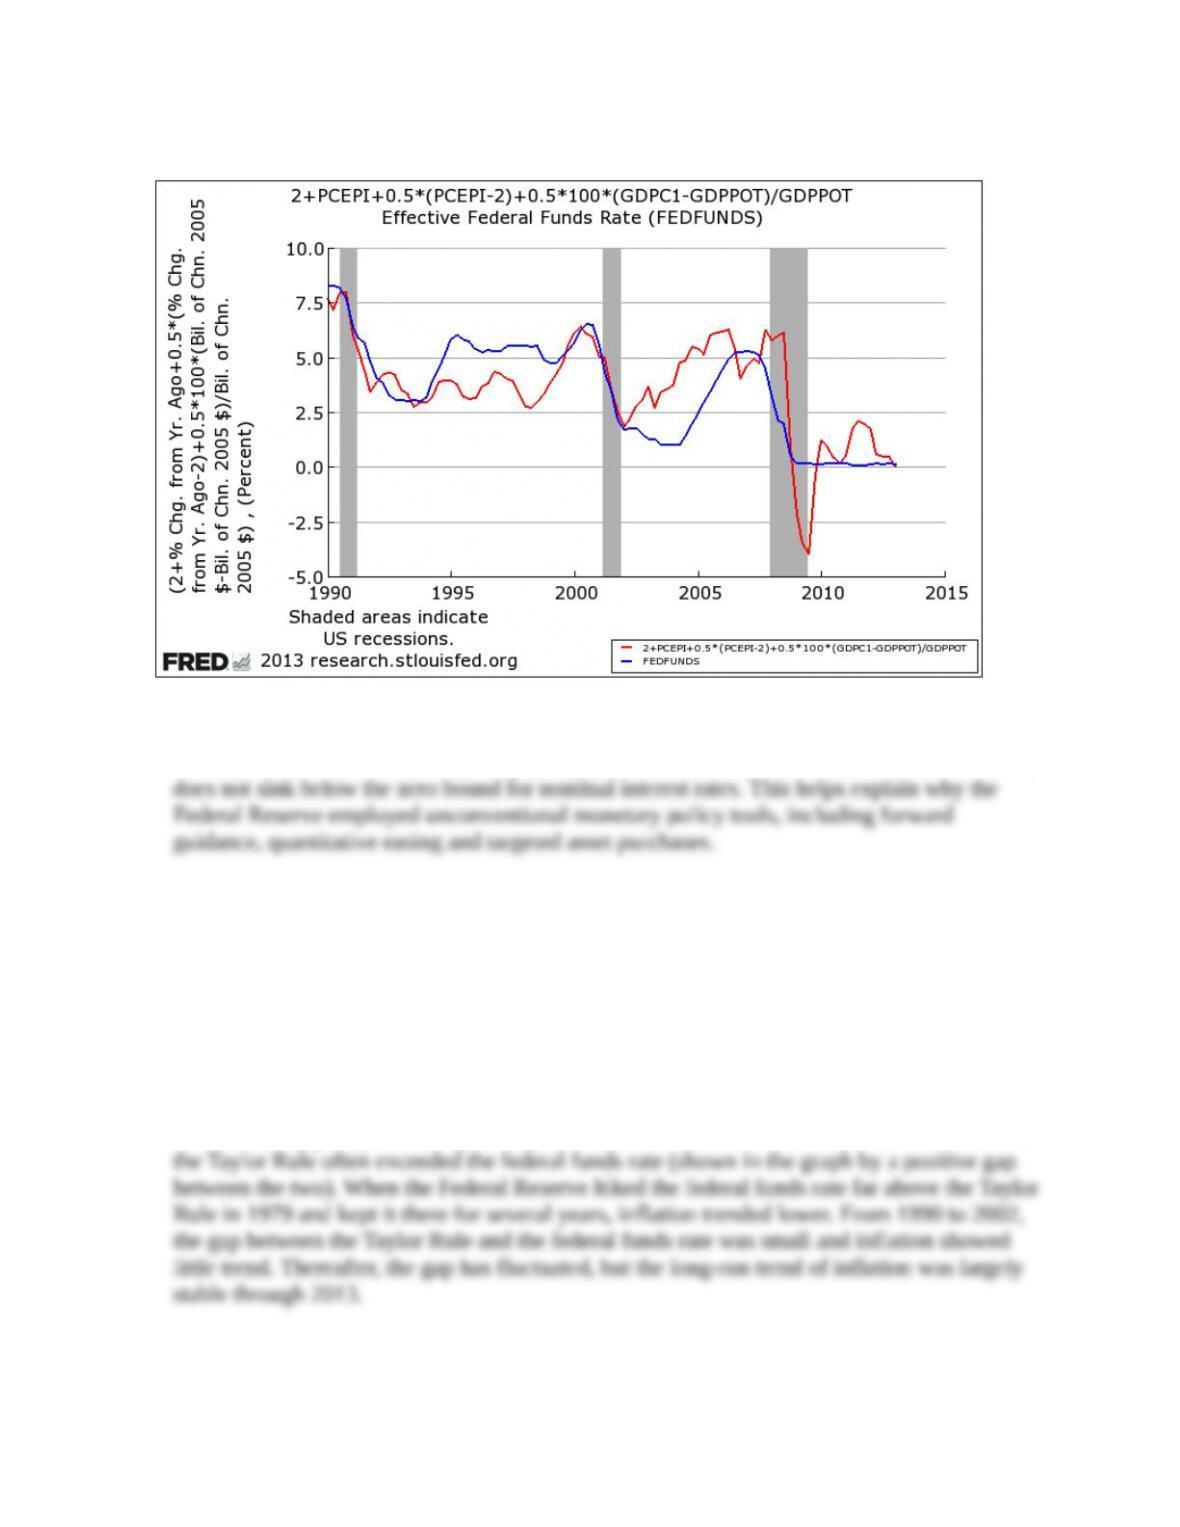
Answer: The data plot is:
Notice that the Taylor rule turns sharply negative in 2009 and 2010, but the federal funds rate
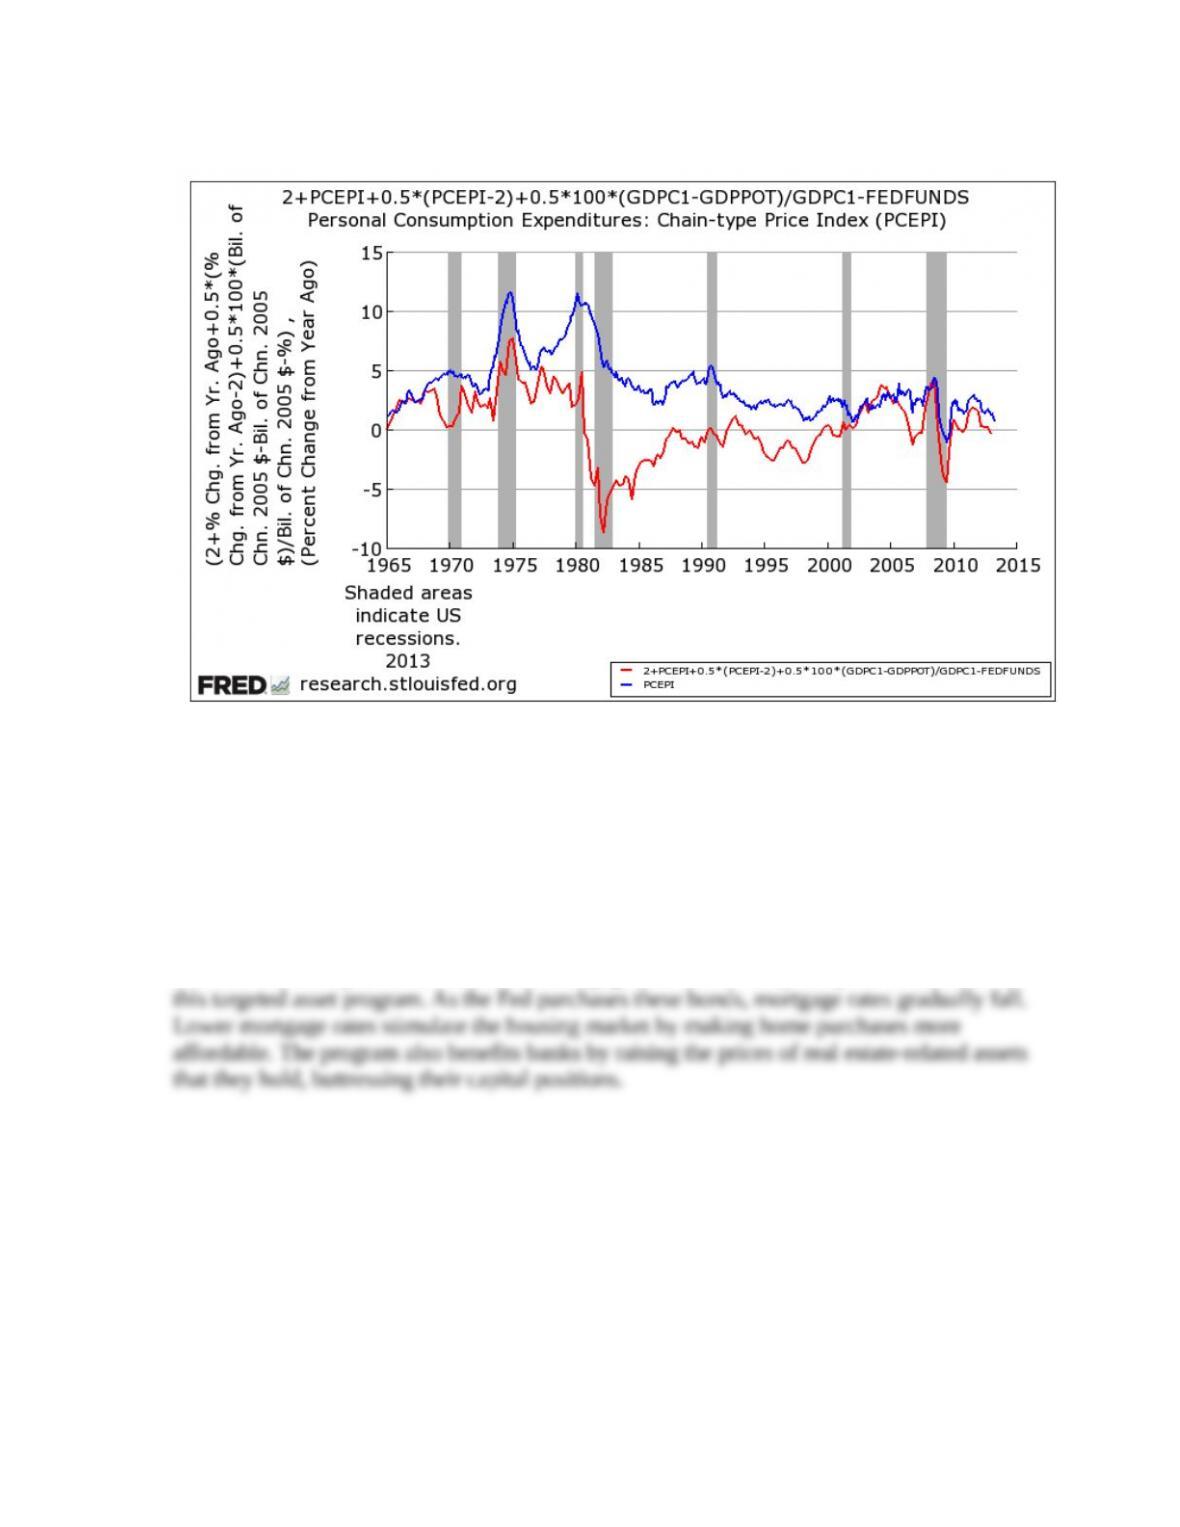
2. Inflation is expected to rise when the Taylor Rule persistently and significantly exceeds the
federal funds rate. Conversely, inflation is expected to decline when the federal funds rate
exceeds the rule. Using the same indicators as in Data Exploration Problem 1, plot since
1965 on a quarterly basis the gap between the Taylor rule and the federal funds rate, together
with the inflation rate. Over long periods of time, does inflation rise when the Taylor Rule
exceeds the federal funds rate? Does it fall when the federal funds rate exceeds the Taylor
Rule? (LO3)
Answer: The plot appears below. The expectations are largely consistent with the history of
U.S. monetary policy over the past 50 years. Inflation tended to rise from 1965 to 1979, when
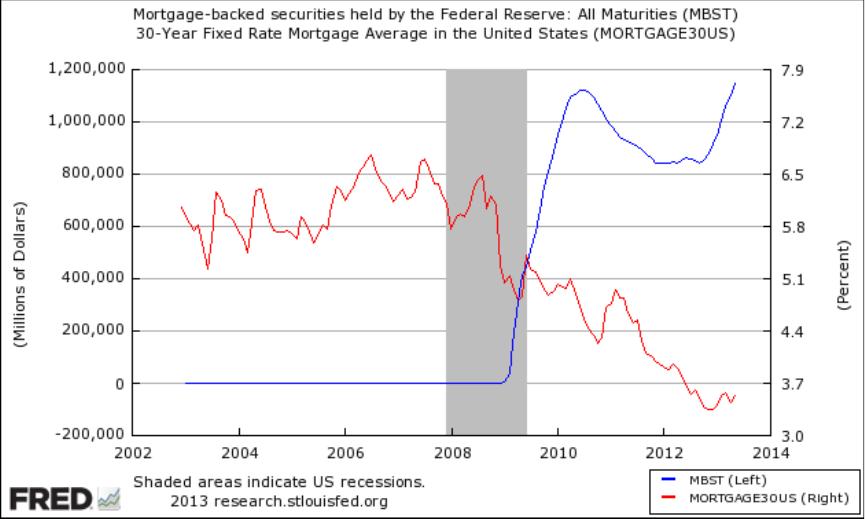
3. Assess the impact of targeted asset purchases by plotting since 2003 on a monthly basis the
Federal Reserve’s holdings of mortgage-backed securities (FRED code: MBST) and (on the
right scale) the average yield on 30-year fixed-rate mortgages (FRED code:
MORTGAGE30US). Discuss how these purchases might support both the housing market
and the banking system. (LO4)
Answer: The data plot below shows the mortgage rate for several years prior to the onset of
4. In 2002, the Federal Reserve began to set the discount rate above the federal funds rate,
reversing its previous practice of keeping the discount rate below the funds rate. To assess the
impact, plot on a monthly basis from 1990 to 2007 the difference between the federal funds
rate and the discount rate before (FRED codes: FEDFUNDS and MDISCRT) and after the
policy shift (FRED codes: FEDFUNDS and WPCREDIT), using the same line color. On the
right scale, plot the level of discount window borrowing (FRED code: DISCBORR). Did the
new penalty rate for discount loans significantly diminish borrowing? What might account
for this result? (LO1)
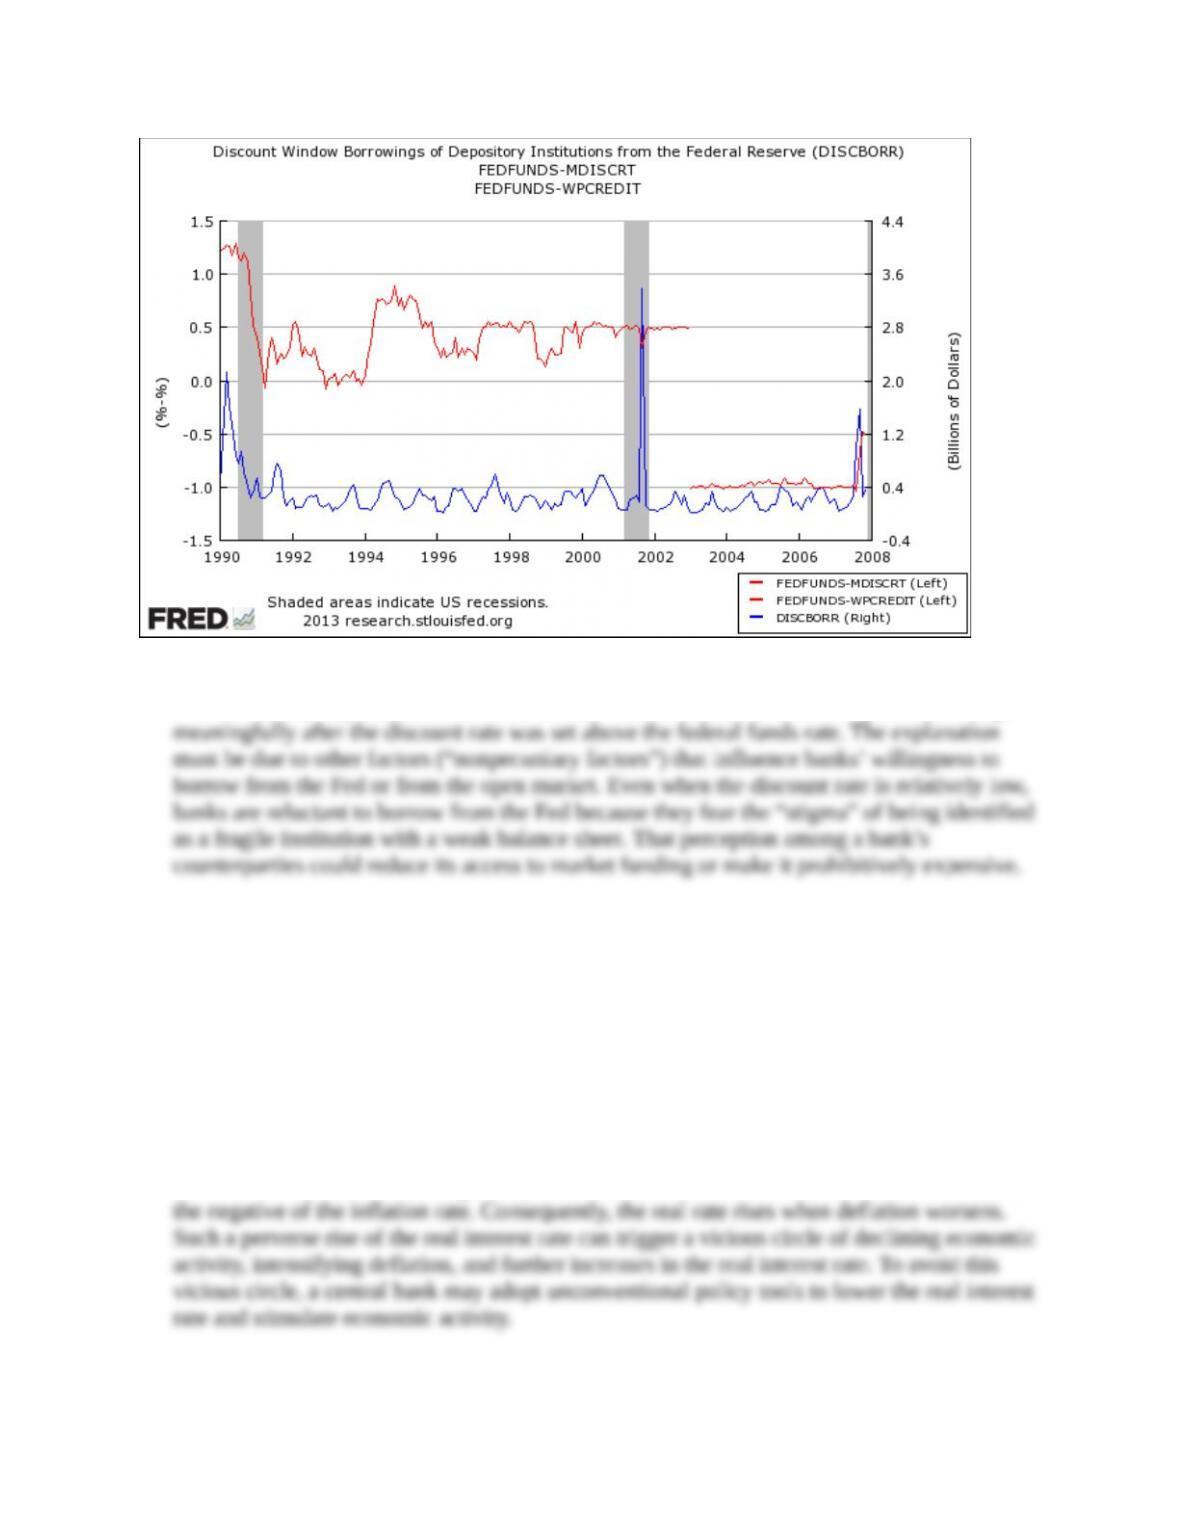
Answer: Prior to 2002, the federal funds rate was below the discount rate, but banks
borrowed relatively little from the Fed. Moreover, the volume of borrowing did not change
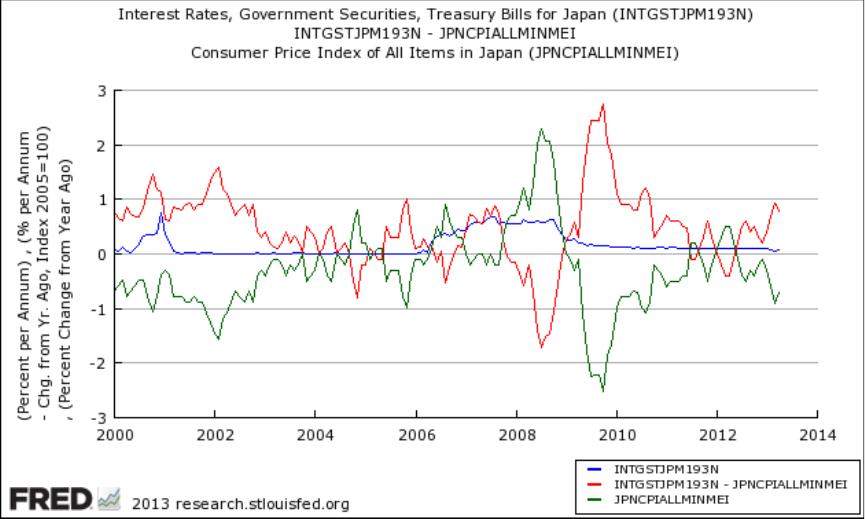
5. With nominal interest rates at zero, expectations of deflation raise the real interest rate. Japan
has faced the zero-bound-deflation problem for many years. Plot since 2000 the nominal
interest rate on Japanese Treasury bills (FRED code: INTGSTJPM193N), the inflation rate
based on the percent change from a year ago of Japan’s consumer price index (FRED code:
JPNCPIALLMINMEI), and an estimate of the real interest rate based on the difference
between these two indicators. Comment on the risks that deflation poses in an economy with
a zero nominal interest rates. (LO1)
Answer: If expected inflation is equal to the inflation rate measured as the percentage change
from a year ago of the consumer price index, then the red line below is a measure of the real
interest rate. As in the Fisher equation, when the nominal rate is zero, the real interest rate is
* indicates more difficult problems