4. Suppose you were the manager of a bank with the following balance sheet.
Bank Balance Sheet
(in millions)
You are required to hold 10 percent of checkable deposits as reserves. If you were faced
with unexpected withdrawals of $30 million from time deposits, would you rather:
a. Draw down $10 million of excess reserves and borrow $20 million from other banks?
b. Draw down $10 million of excess reserves and sell securities of $20 million?
Explain your choice. (LO1)
Answer: Option (a) is preferable to option (b) because it doesn’t shrink the size of the
5. Suppose you are advising a bank on the management of its balance sheet. In light of the
financial crisis of 2007-2009, what arguments might you make to convince the bank to
hold additional capital? (LO2)
Answer: The financial crisis of 2007-2009 resulted in projected losses of nearly $1
trillion in US bank assets. In the absence of substantial government support, many banks
Data Exploration
1. Are U.S. banks increasing in size? Use FRED to plot since 1984 on a quarterly basis the
number of U.S. commercial banks (FRED code: USNUM) and the volume of their
deposits (FRED code: DPSACBM027SBOG). Download the data and compute the
average deposit size of banks in the first quarters of 1984 and 2013. Do these sizes
accurately portray a typical commercial bank? (LO1) (Hint: To reflect the different units
of these indicators in one graph, plot the level of deposits on the right scale by selecting
“Right” at the “Scale” dropdown box for this indicator.)
Answer: The data plot is:
Assets Liabilities
Reserves $30 Checkable Deposits $200
Securities $150 Time Deposits $600
Loans $820 Borrowings $100
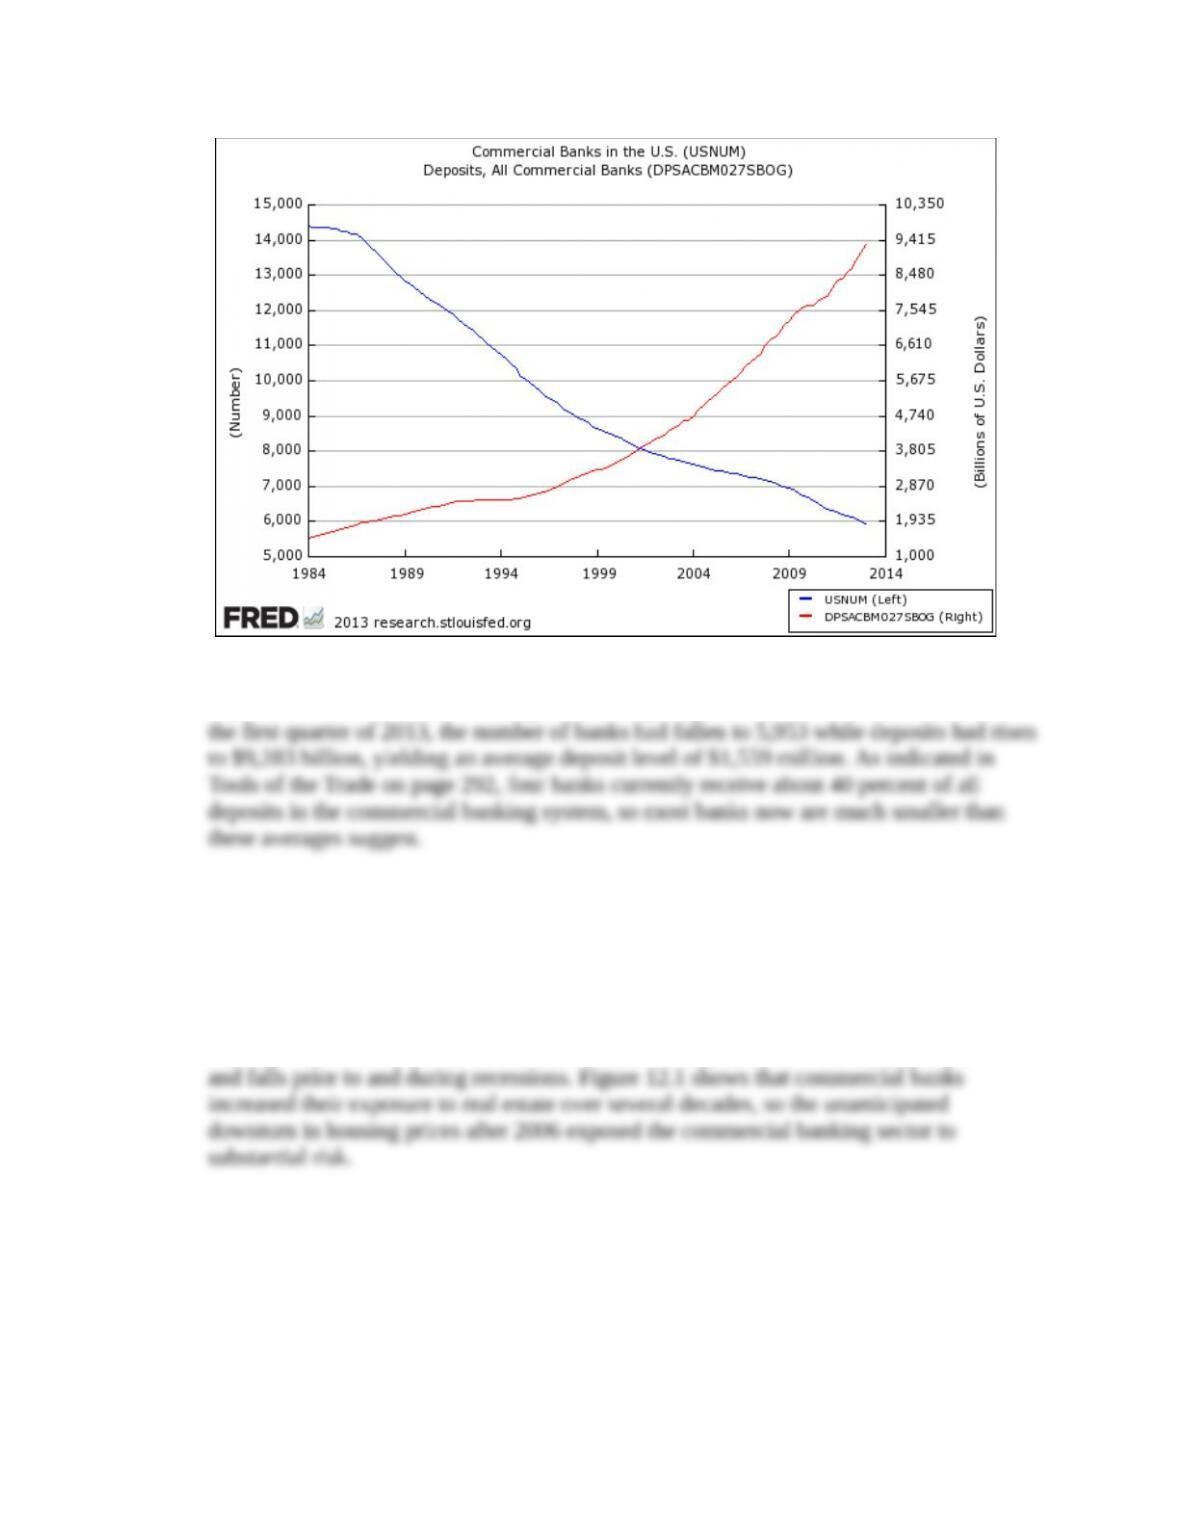
Using quarterly data, at the beginning of 1984, there were 14,388 commercial banks and
deposits of $1,494 billion, resulting in an average deposit level of about $104 million. In
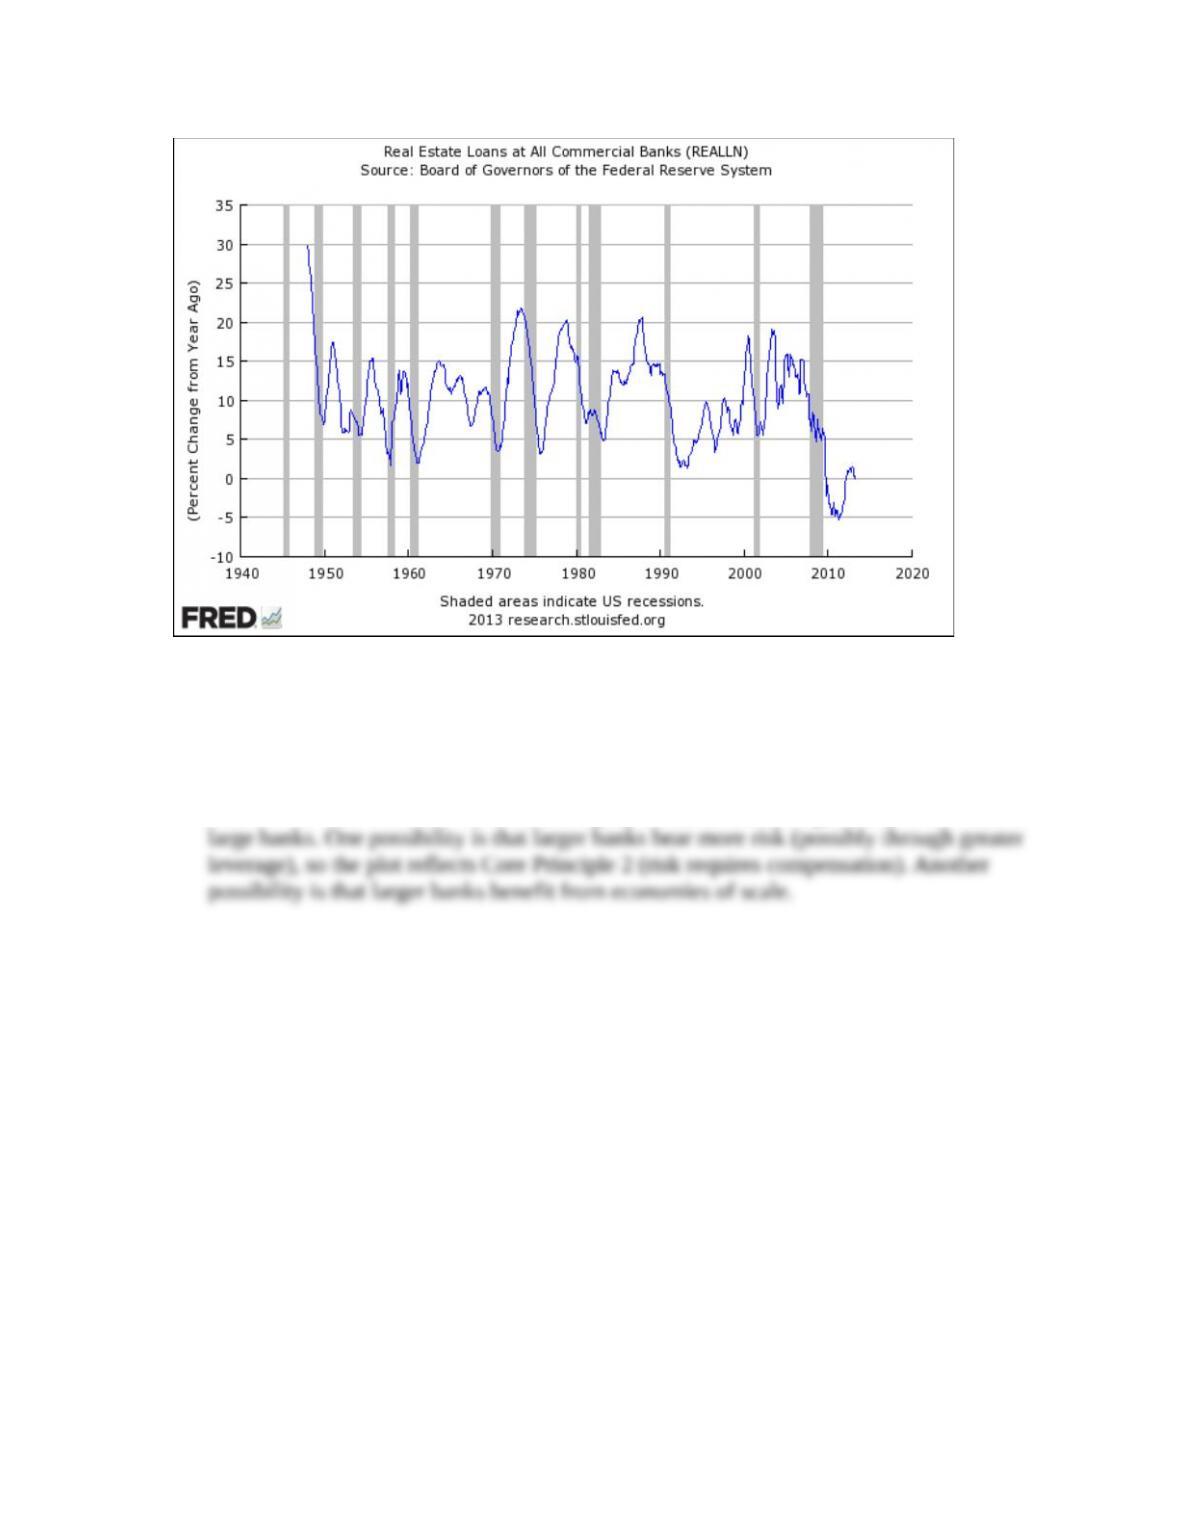
2. Commercial banks have become increasingly involved in real estate market. Plot the
percent change from a year ago of real estate loans made by commercial banks (FRED
code: REALLN) and discuss the relationship between the booms and busts in real estate
lending and the expansions and recessions of the U.S. economy. (LO3)
Answer: The cycles in real estate lending, plotted below, appear to coincide closely with
business expansions and recession. Real estate lending often rises strongly in expansions
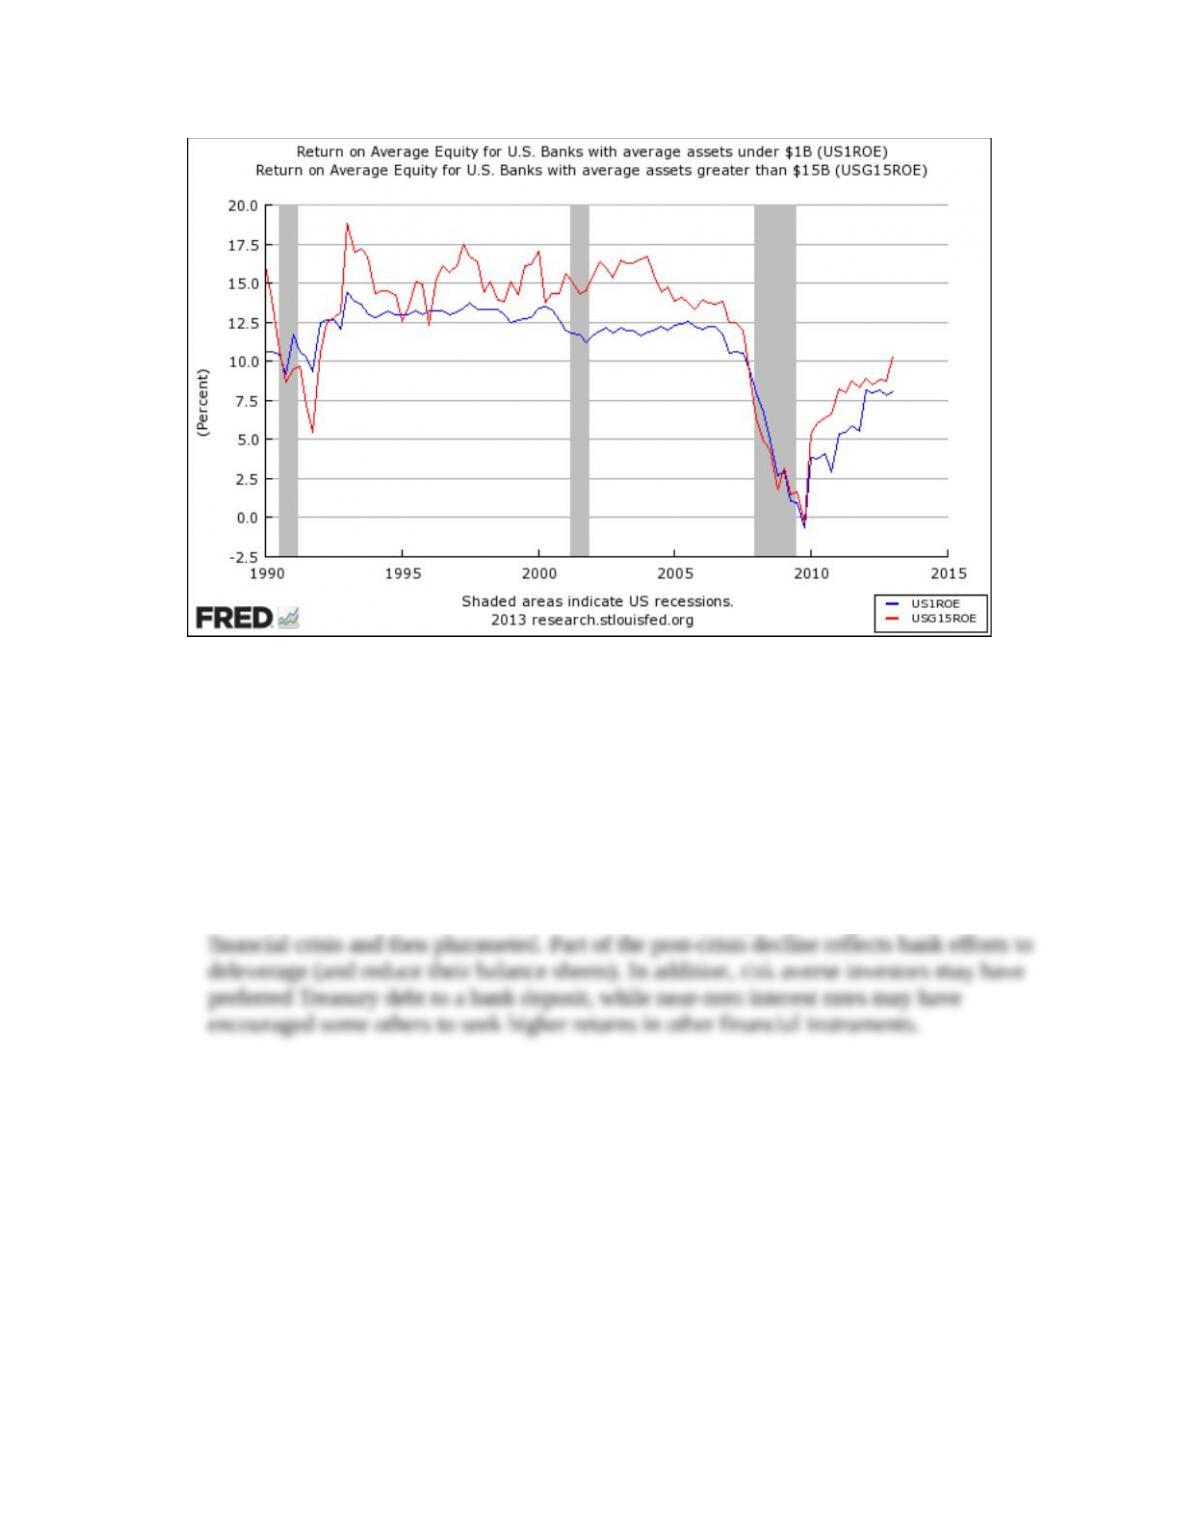
3. Plot since 1990 the return on equity of small banks (banks with assets of less than $1
billion; FRED code: US1ROE) and large banks (banks with assets of greater than $15
billion; FRED code: USG15ROE). How do you explain the long-run pattern? (LO2)
Answer: As shown below, the return on equity for small banks is generally lower than for
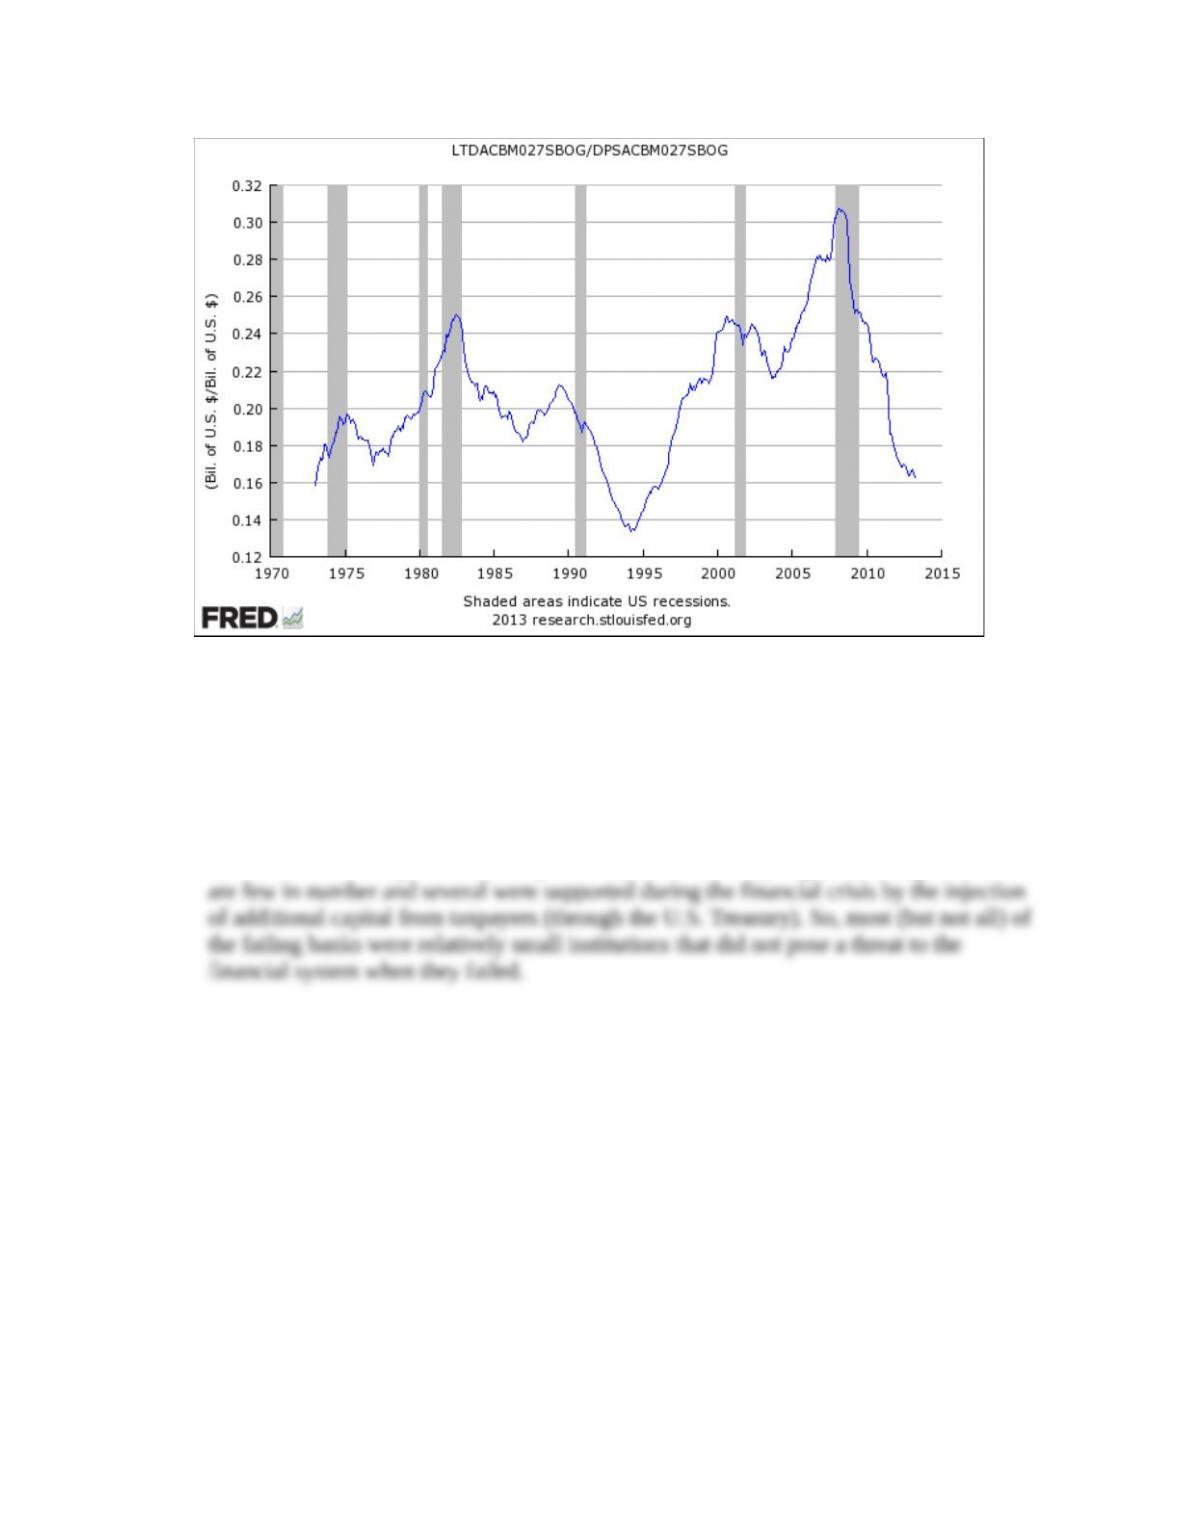
4. Banks sometimes manage liquidity risk by issuing large, marketable certificates of
deposits when other deposits decline. How important is this practice? Plot the share of
large time deposits (FRED code: LTDACBM027SBOG) in total deposits (FRED code:
DPSACBM027SBOG). Explain how this share evolved over the long run and after 2004.
(LO3)
Answer: The plot below shows that bank borrowing in the “wholesale” money market has
been cyclical. Since 2004, the importance of attracting large deposits peaked prior to the
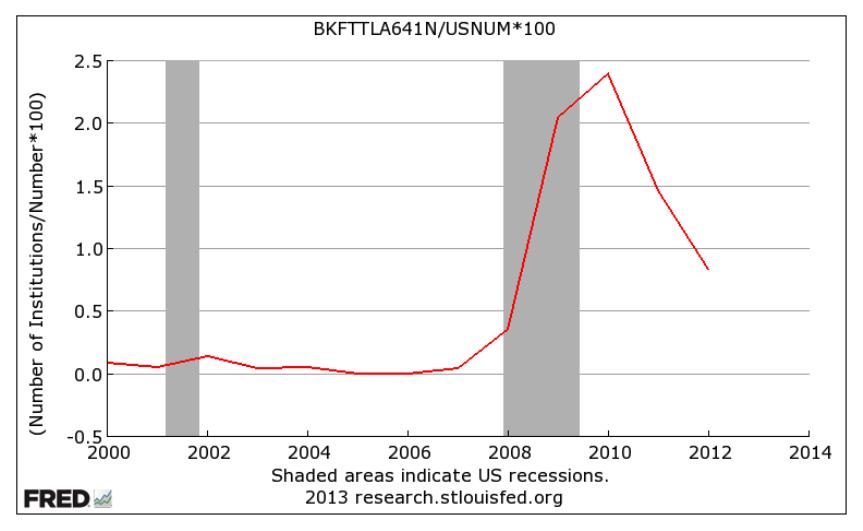
5. What share of U.S. banks fail? Plot since 2000 the fraction (in percent) of bank failures
(FRED code: BKFTTLA641N) relative to the number of banks (FRED code: USNUM).
Comment on the timing and the proportion of failures. Were most of the failing banks
large or small? (LO3)
Answer: The plot below shows that bank failures in the United States rose with a lag as
the Great Recession proceeded and peaked after the recovery began. The largest banks
* indicates more difficult problems