Data Exploration
1. Financial intermediaries connect savers and borrowers. Examine growth in intermediation
from the following perspectives. (LO1)
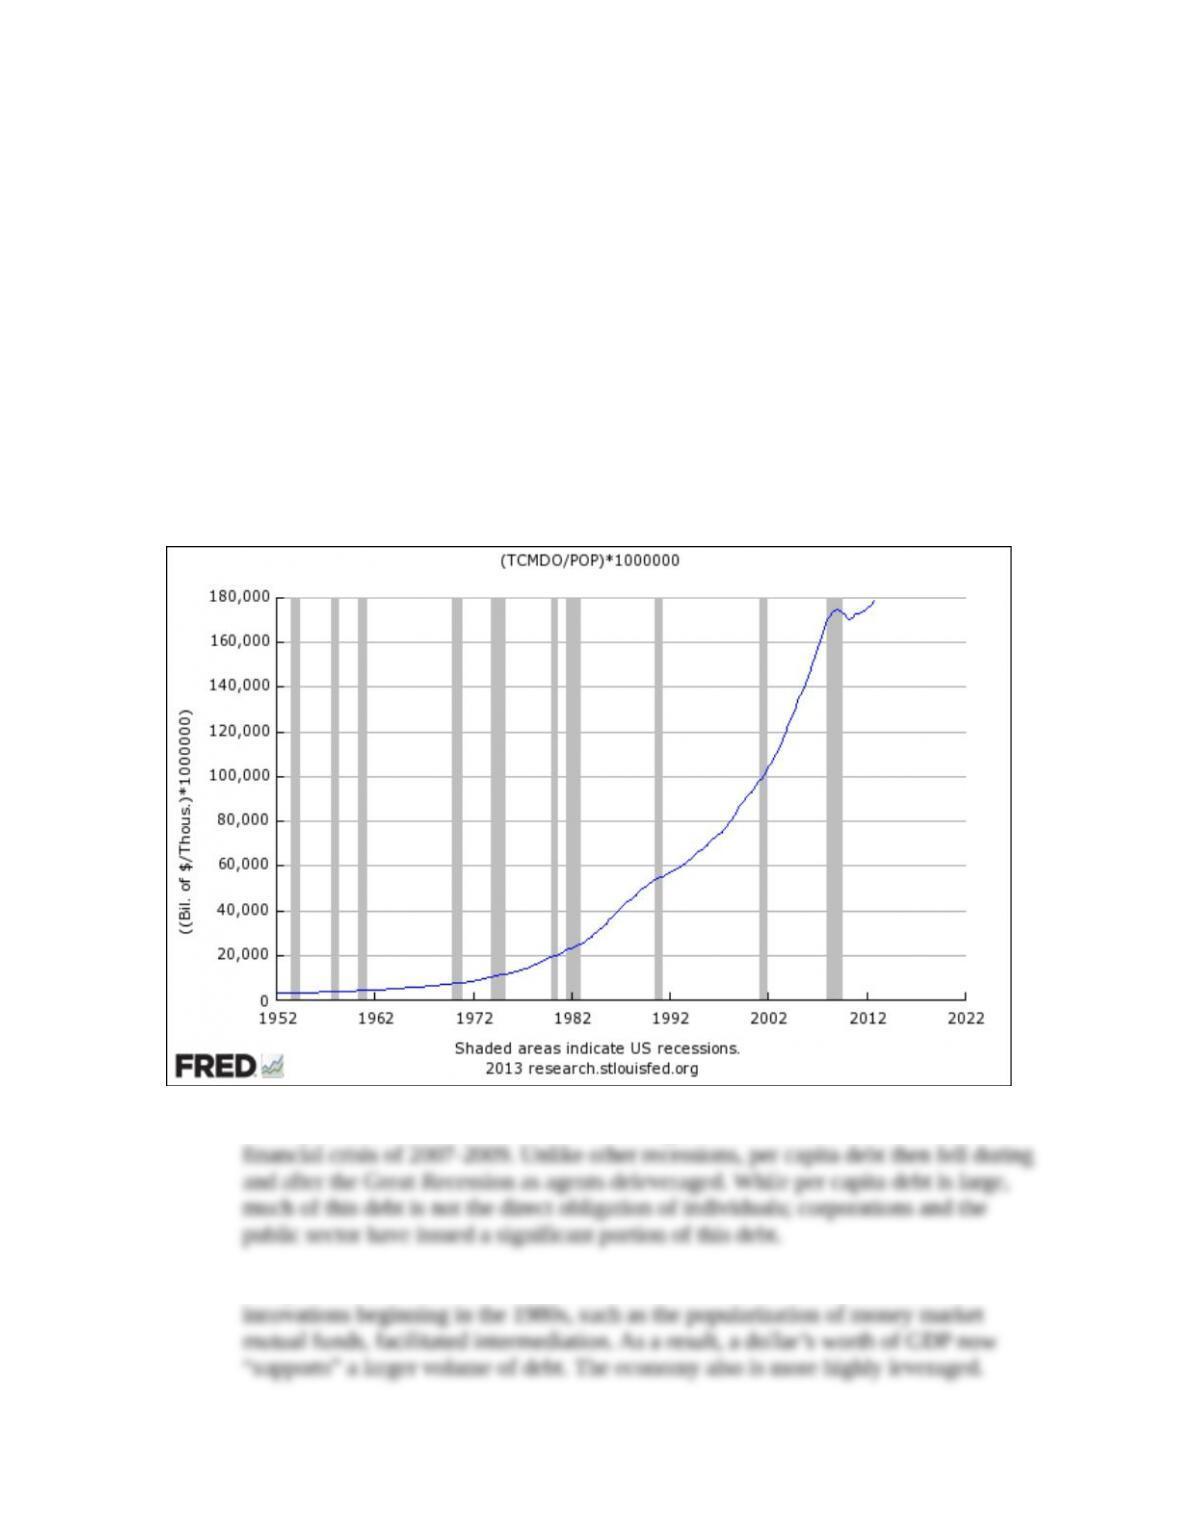
a. Plot the ratio of total credit market debt owed (FRED code: TCMDO) to population
(FRED code: POP). (Hint: Because credit market debt is expressed in billions and
population in thousands, multiply TCMDO by one million to correct for the difference in
units.) Interpret the plot.
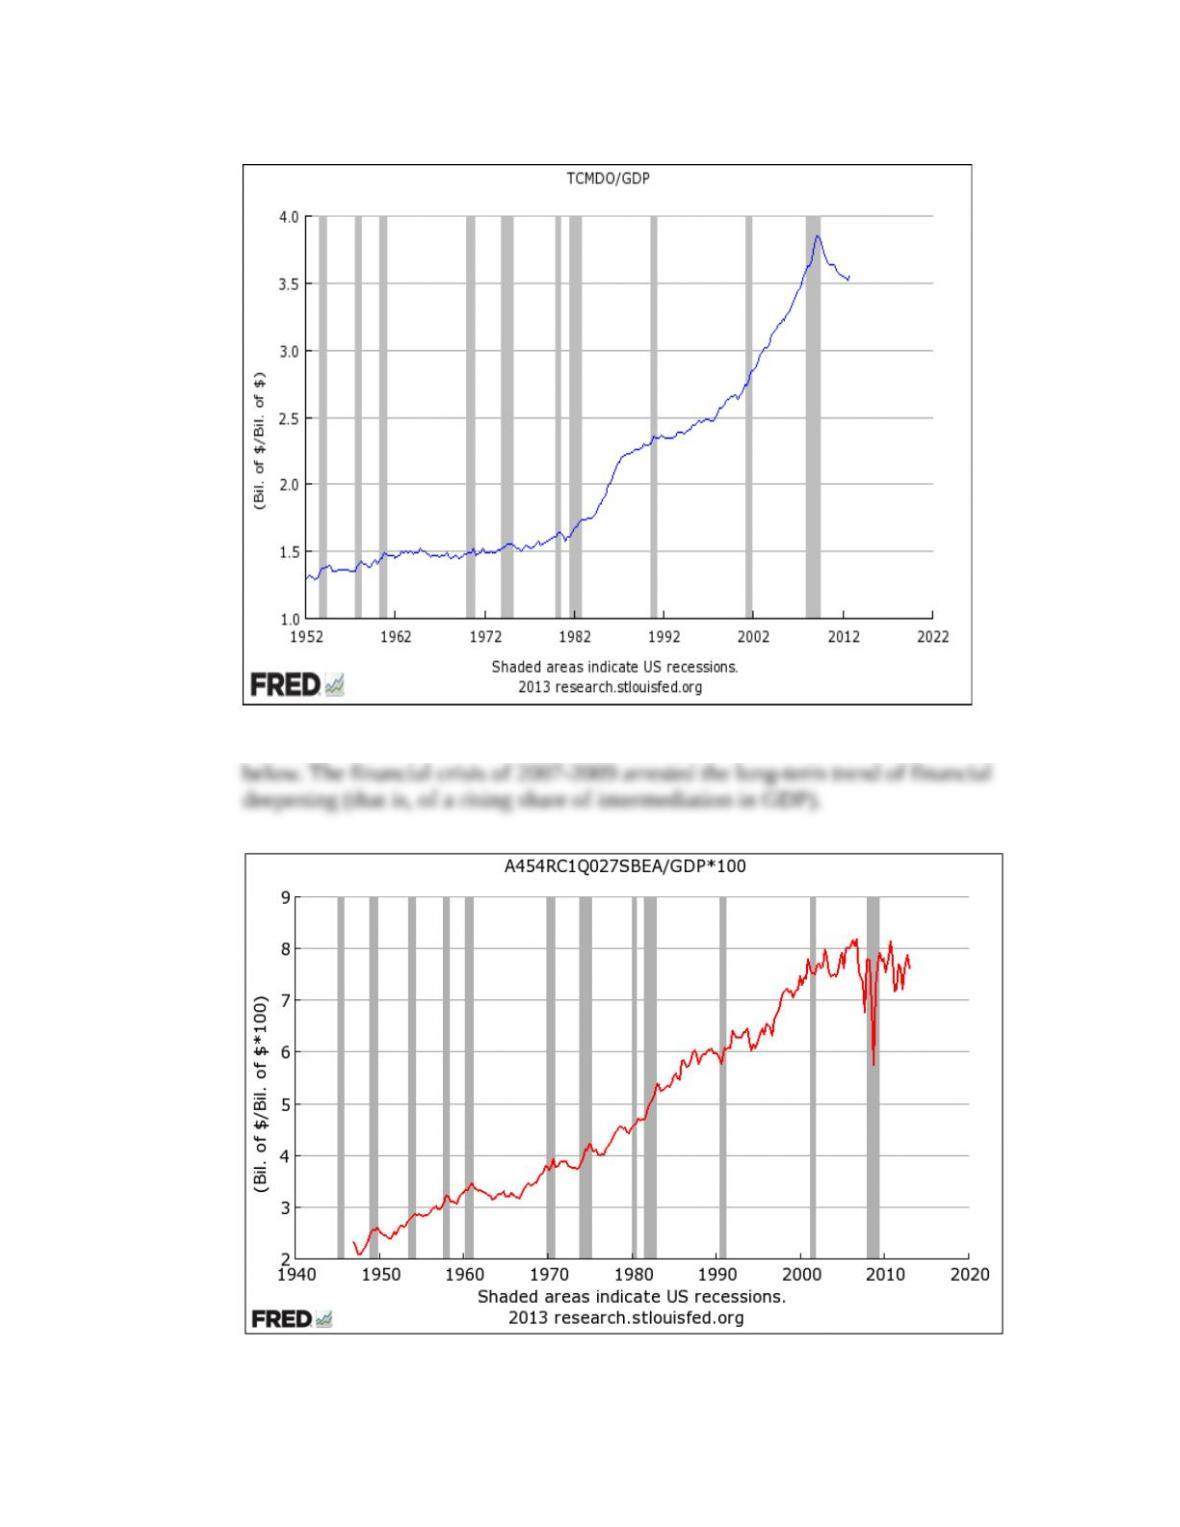
b. Plot the ratio of total credit market debt to nominal GDP. Interpret the plot.
c. Plot the ratio to nominal GDP of the value added by financial corporate business (FRED
code: A454RC1Q027SBEA). Interpret the plot since 2005.
Answer:
a. The plot of per capita credit market debt is:
Per capita debt accelerated in the 1980s and again in the 1990s until the onset of the
b. The plot of total credit market debt relative to GDP is shown below. Financial
c. The ratio to nominal GDP of the value added by financial corporate business is shown
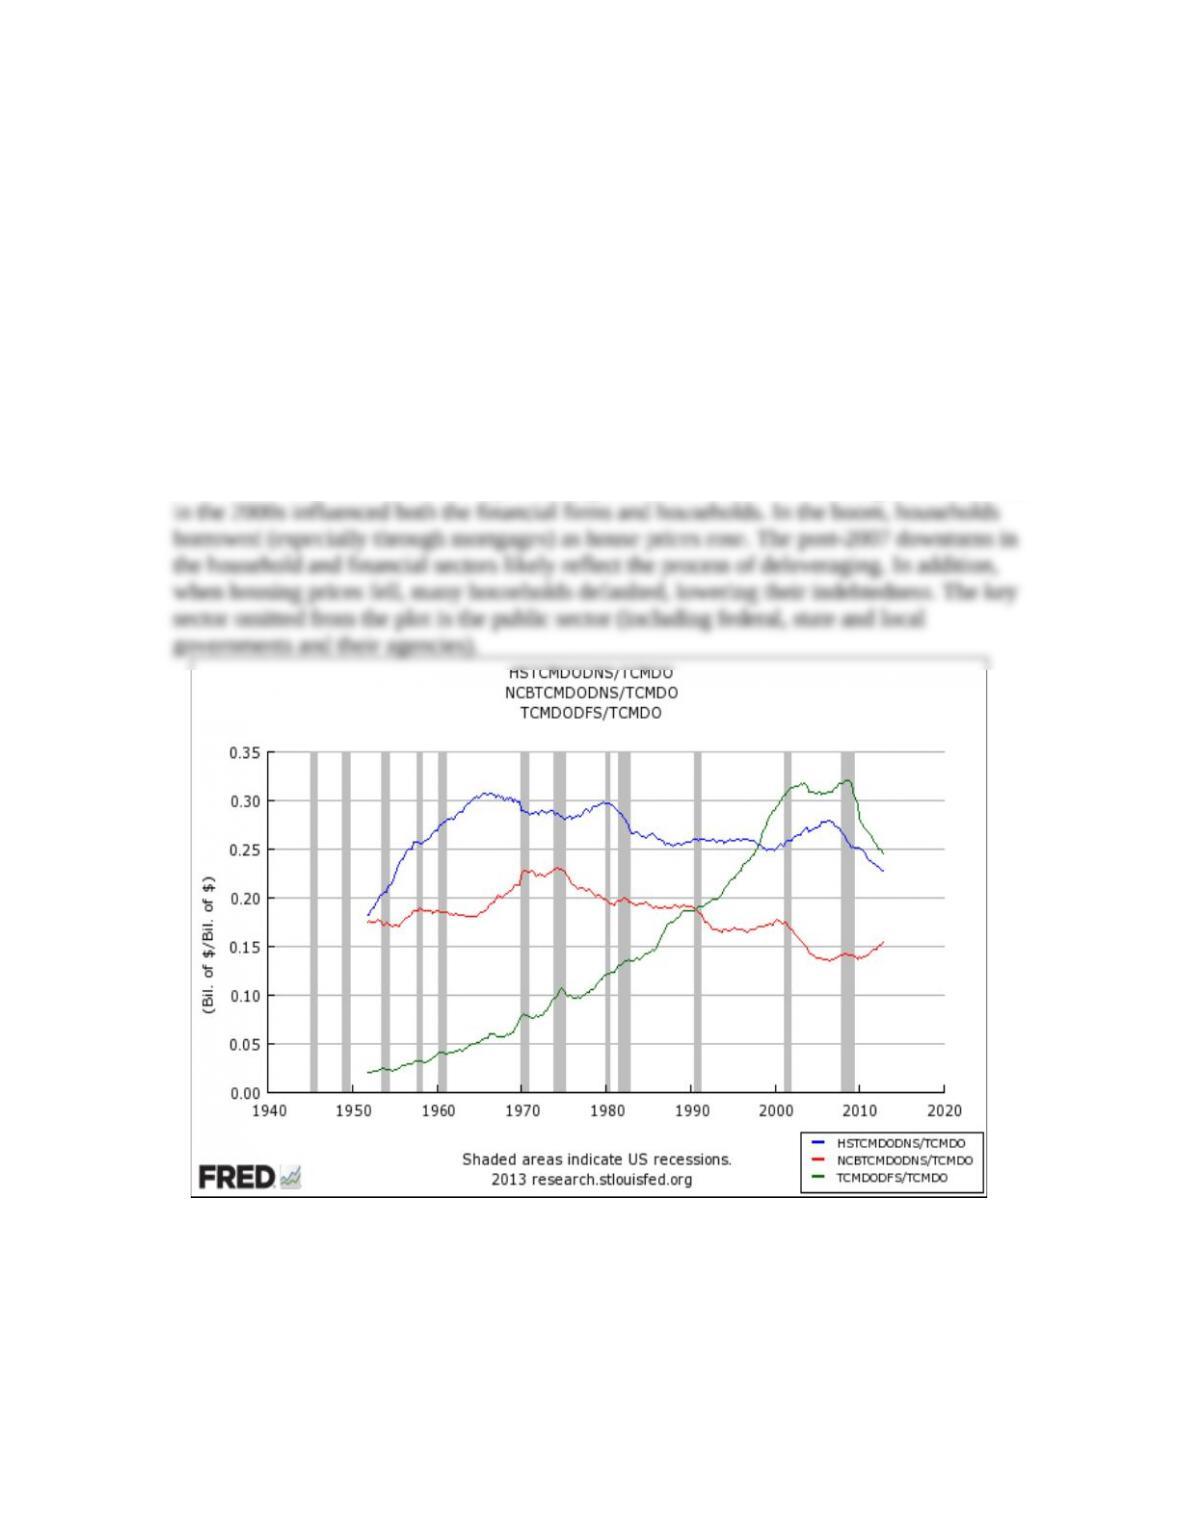
2. How has the use of credit evolved in key sectors of the economy? Plot as ratios to total credit
market debt outstanding (FRED code: TCMDO) the debt of: (a) households (FRED code:
HSTCMDODNS); (b) nonfinancial corporate businesses (FRED code: NCBTCMDODNS);
and (c) the domestic financial sector (FRED code: TCMDODFS). Compared with the prior
two decades, account for the pattern of debt in the household sector since 2000. What do the
downturns during the financial crisis in the household and financial sector ratios mean in
terms of leverage? What important sector is omitted from this plot? (LO1)
Answer: The data plot for the sector ratios is below. Until the financial crisis of 2007-2009,
financial firms used an increasing share of outstanding debt in support of intermediation,
while other sectors showed a mildly declining share since 1970. The housing boom and bust
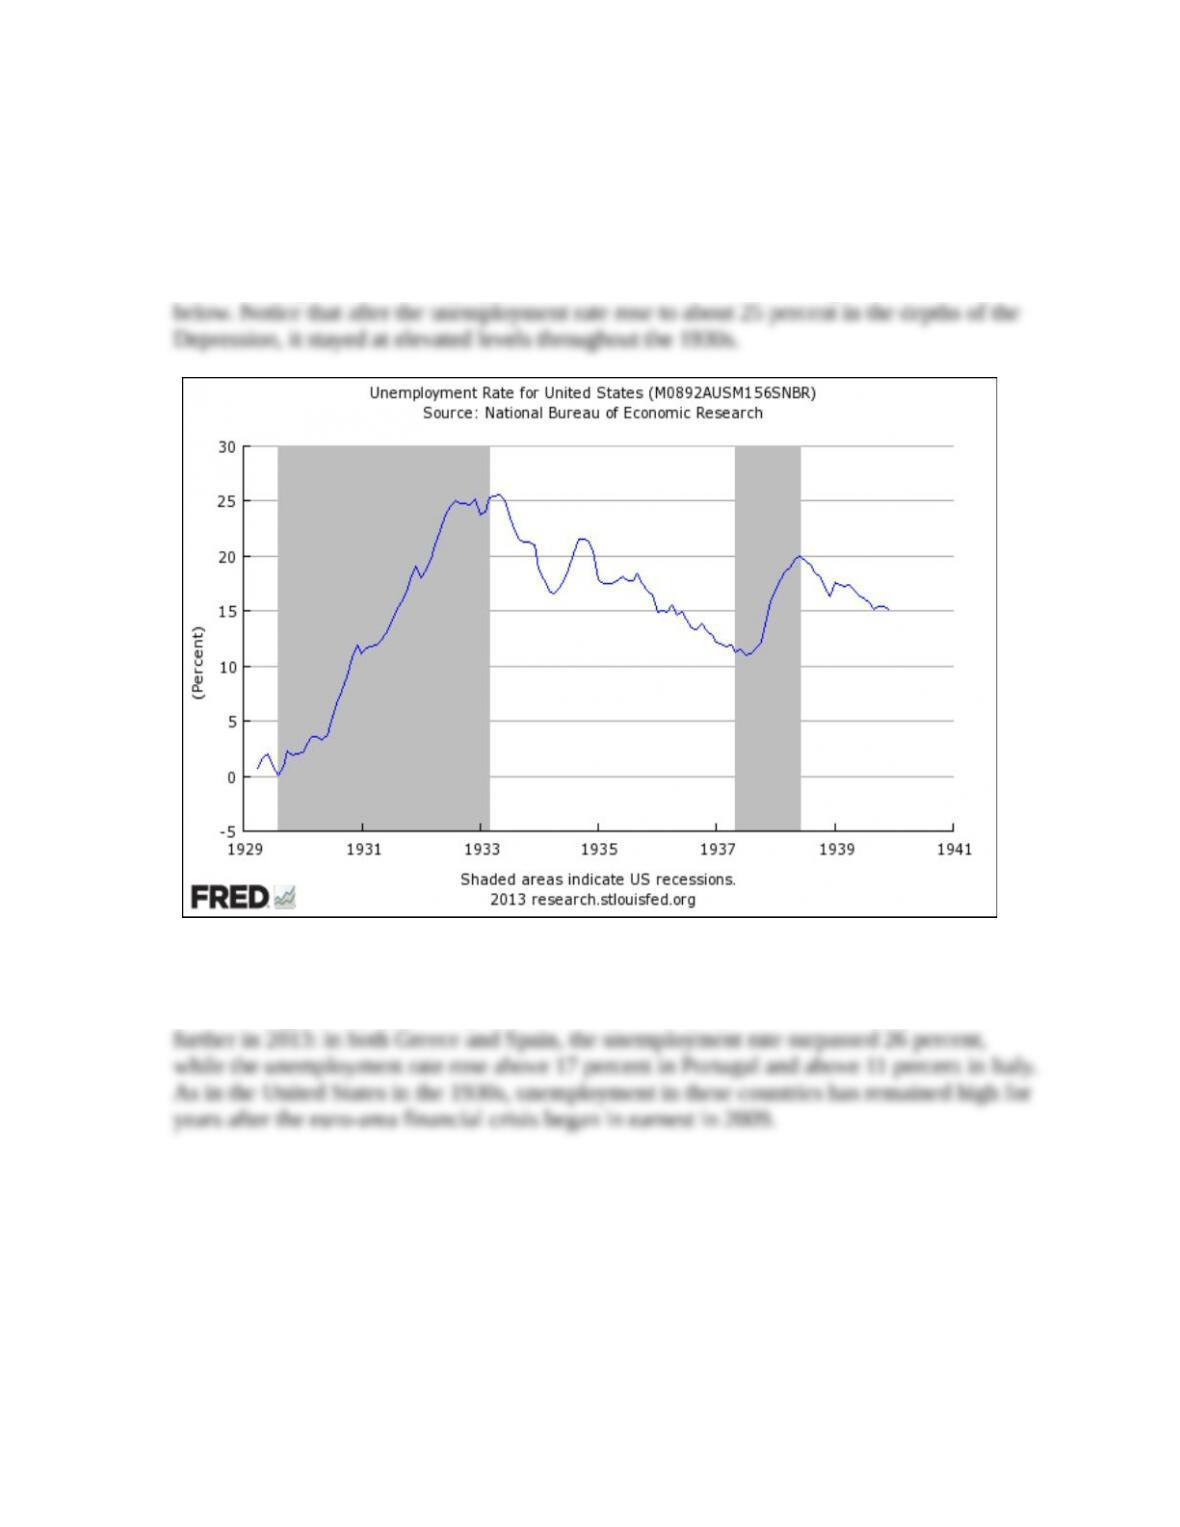
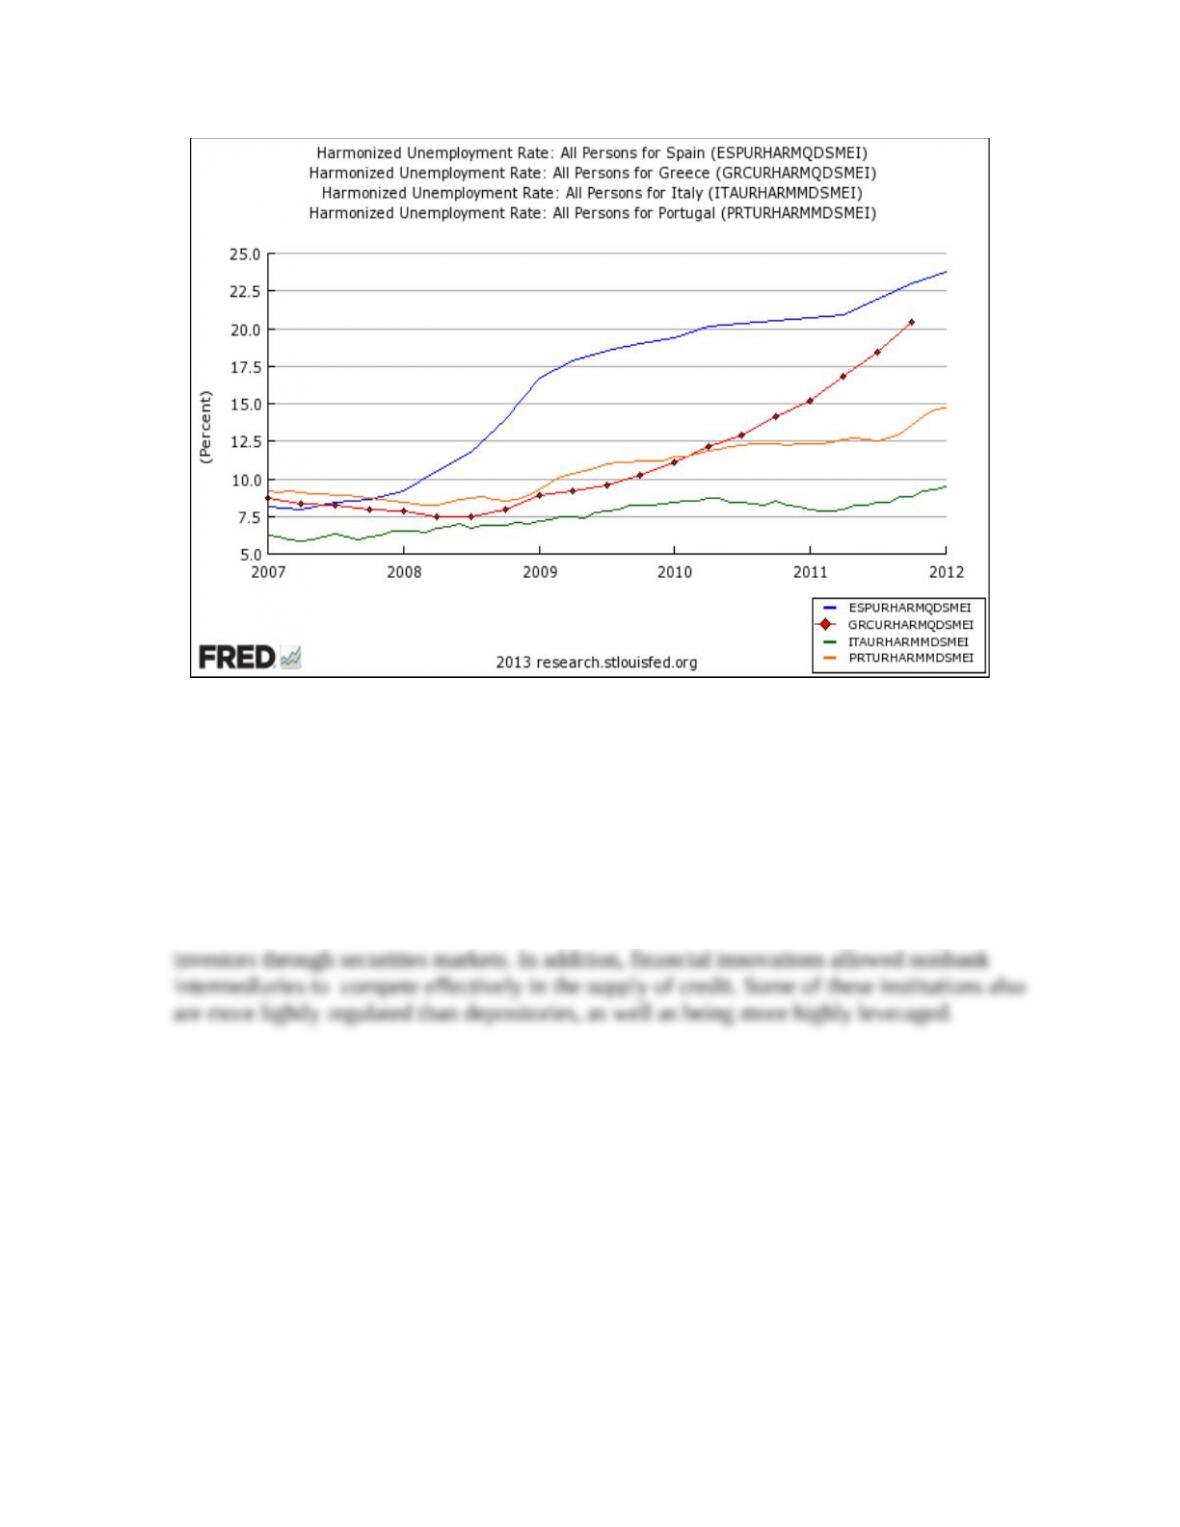
3. Financial crisis is often associated with rising, and then persistently high, unemployment
rates. Plot the U.S. unemployment rate during the Great Depression until the end of the 1930s
(FRED code: M0892AUSM156SNBR). Compare the U.S. experience then with
unemployment rates in Spain (FRED code: ESPURHARMQDSMEI), Greece (FRED code:
GRCURHARMQDSMEI), Italy (FRED code: ITAURHARMMDSMEI), and Portugal
(FRED code: PRTURHARMMDSMEI) since the beginning of the financial crisis in 2007.
(Turn off the recession bars for the European data plot.) (LO3)
Answer: The plot of the unemployment rate in the U.S. in the Great Depression is shown
The post-2007 plot of the unemployment rate in selected European countries is shown below.
While the figure displays data up to 2012, European employment conditions deteriorated
4. The rise of securities markets and the expansion of intermediation by nonbanks has come
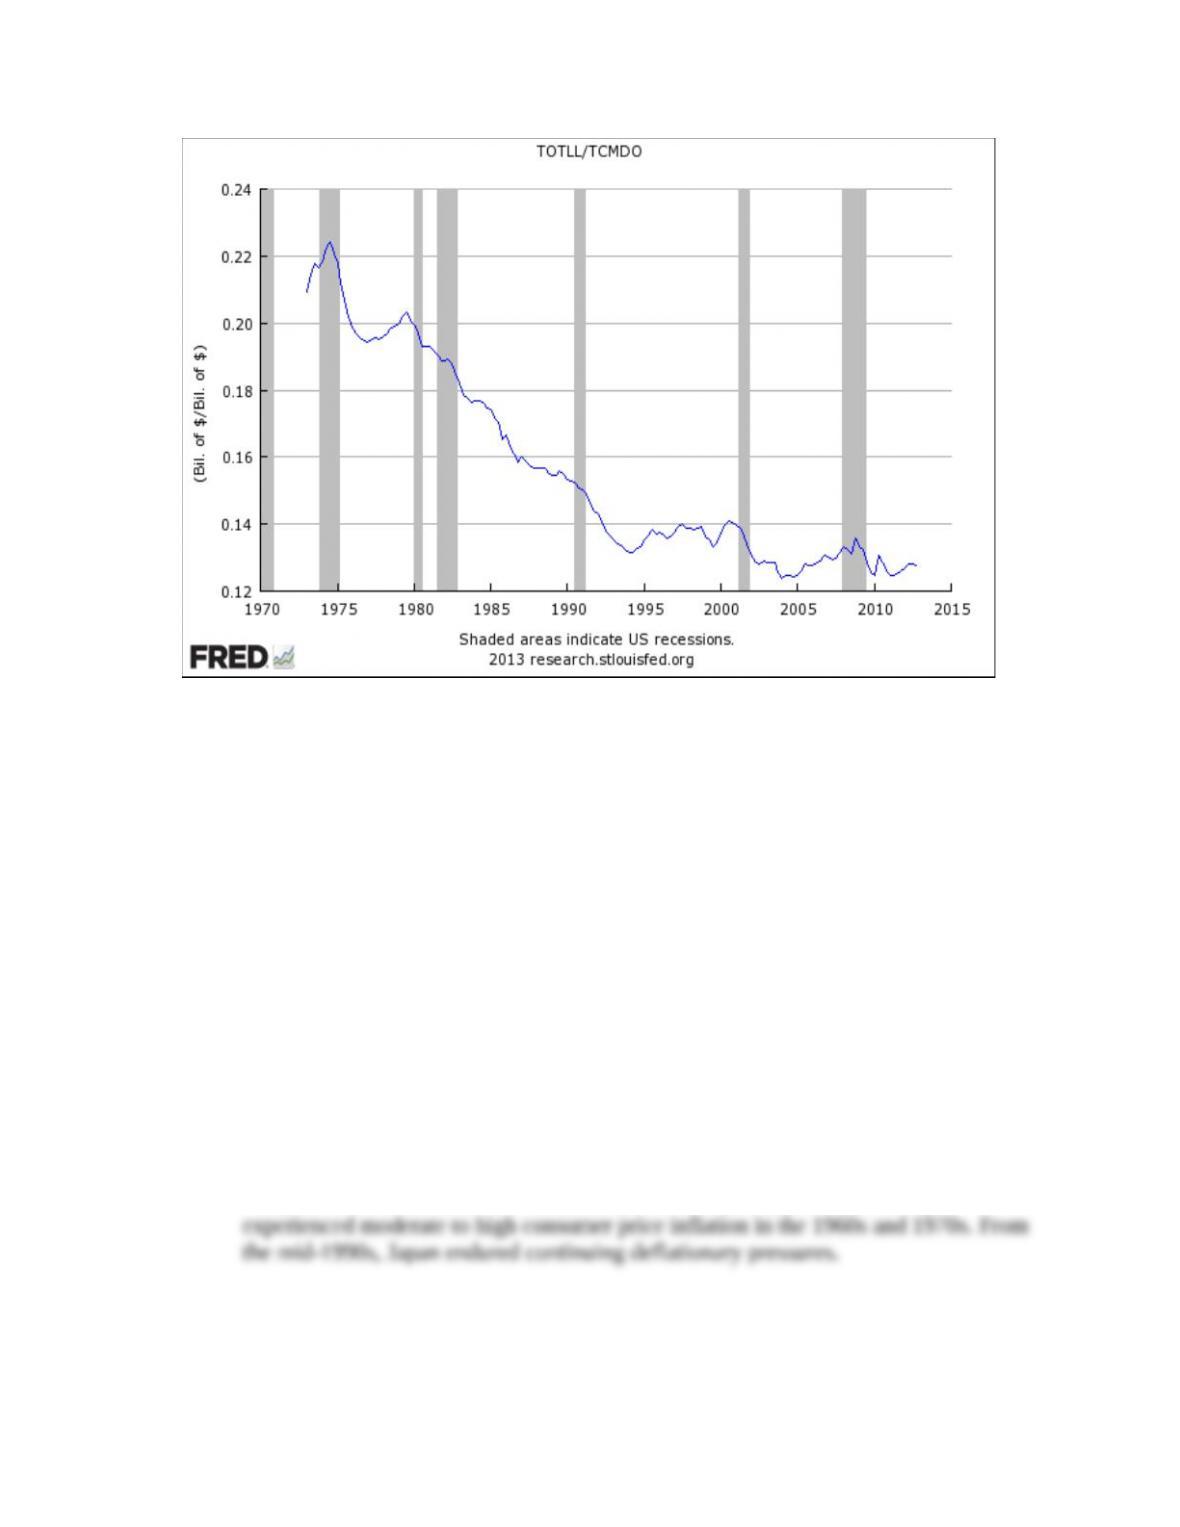
partly at the expense of commercial banks. Plot the ratio of bank credit (FRED code:
TOTLL) to total credit market debt outstanding (FRED code: TCMDO) and comment on the
trend. (LO1)
Answer: Relative to total credit market debt, banks’ share has eroded dramatically since the
1970s. Part of this shift reflects the increased access of nonfinancial borrowers to global
5. Deflation raises the real burden of repaying fixed-rate debt. Japan has recently experienced a
long deflation. (LO3)
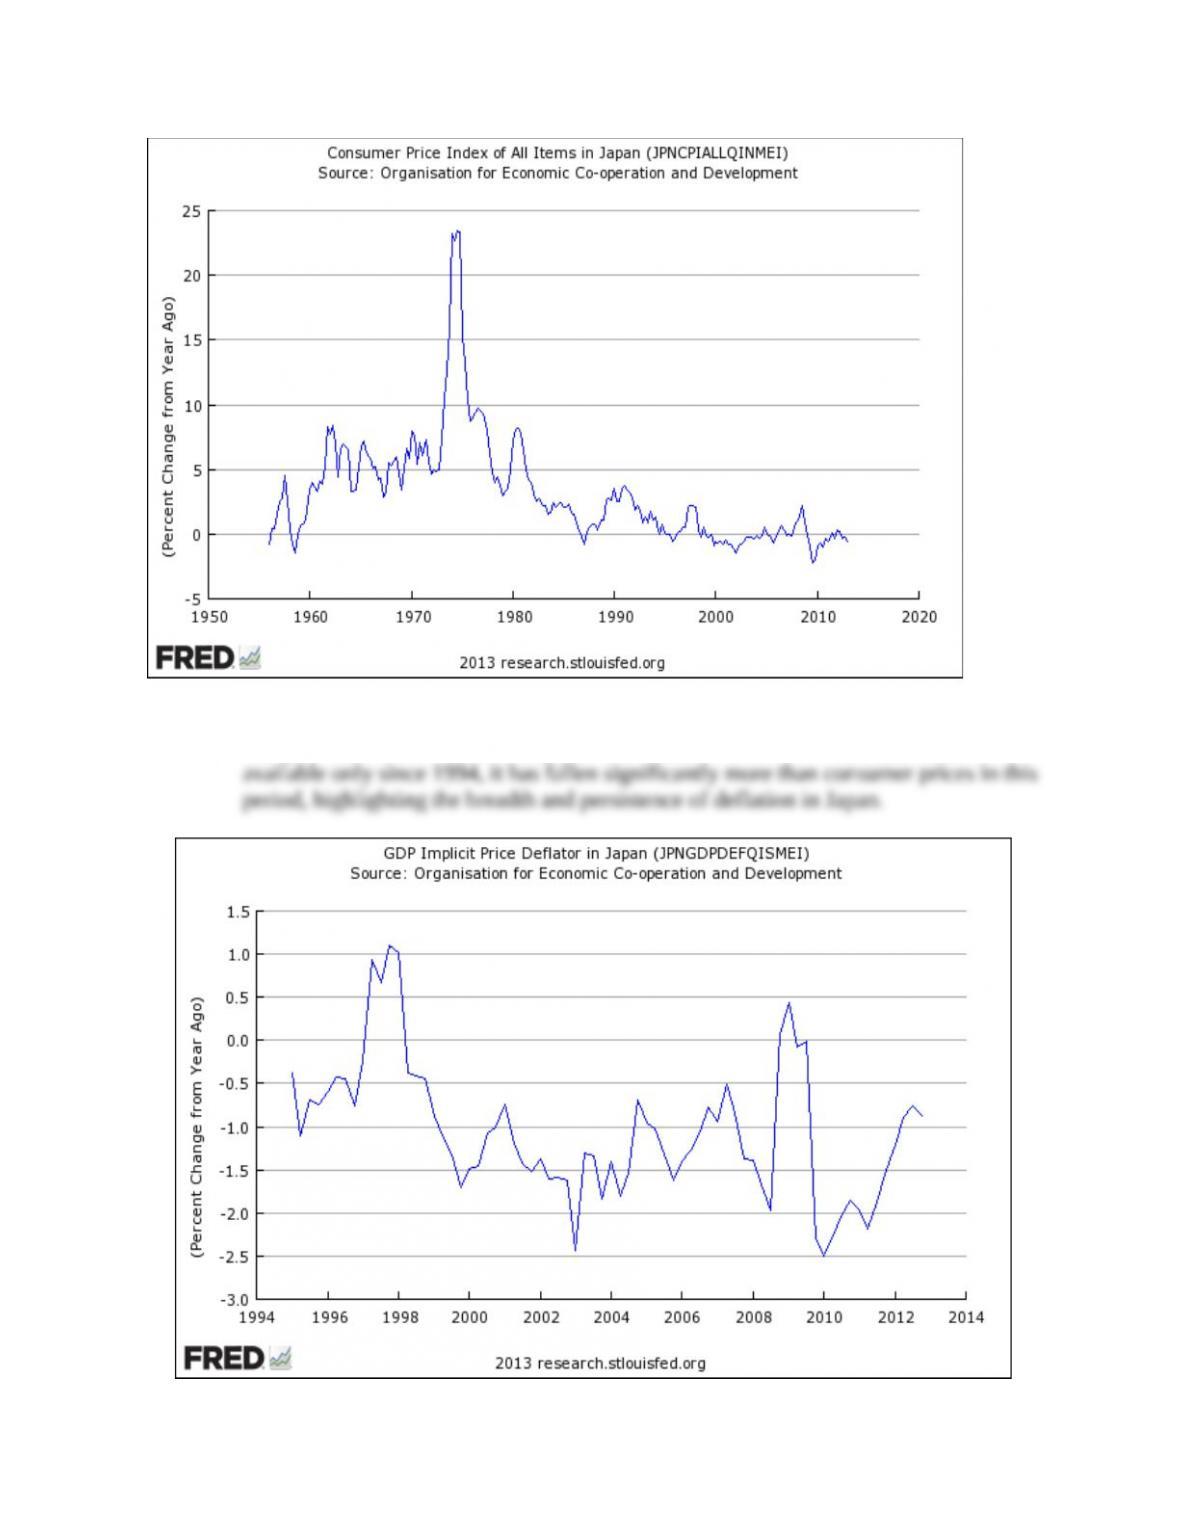
a. Plot the percent change from a year ago of consumer prices in Japan (FRED code:
JPNCPIALLQINMEI) and discuss the long-term patterns of inflation and deflation. (Turn
off the recession bars.)
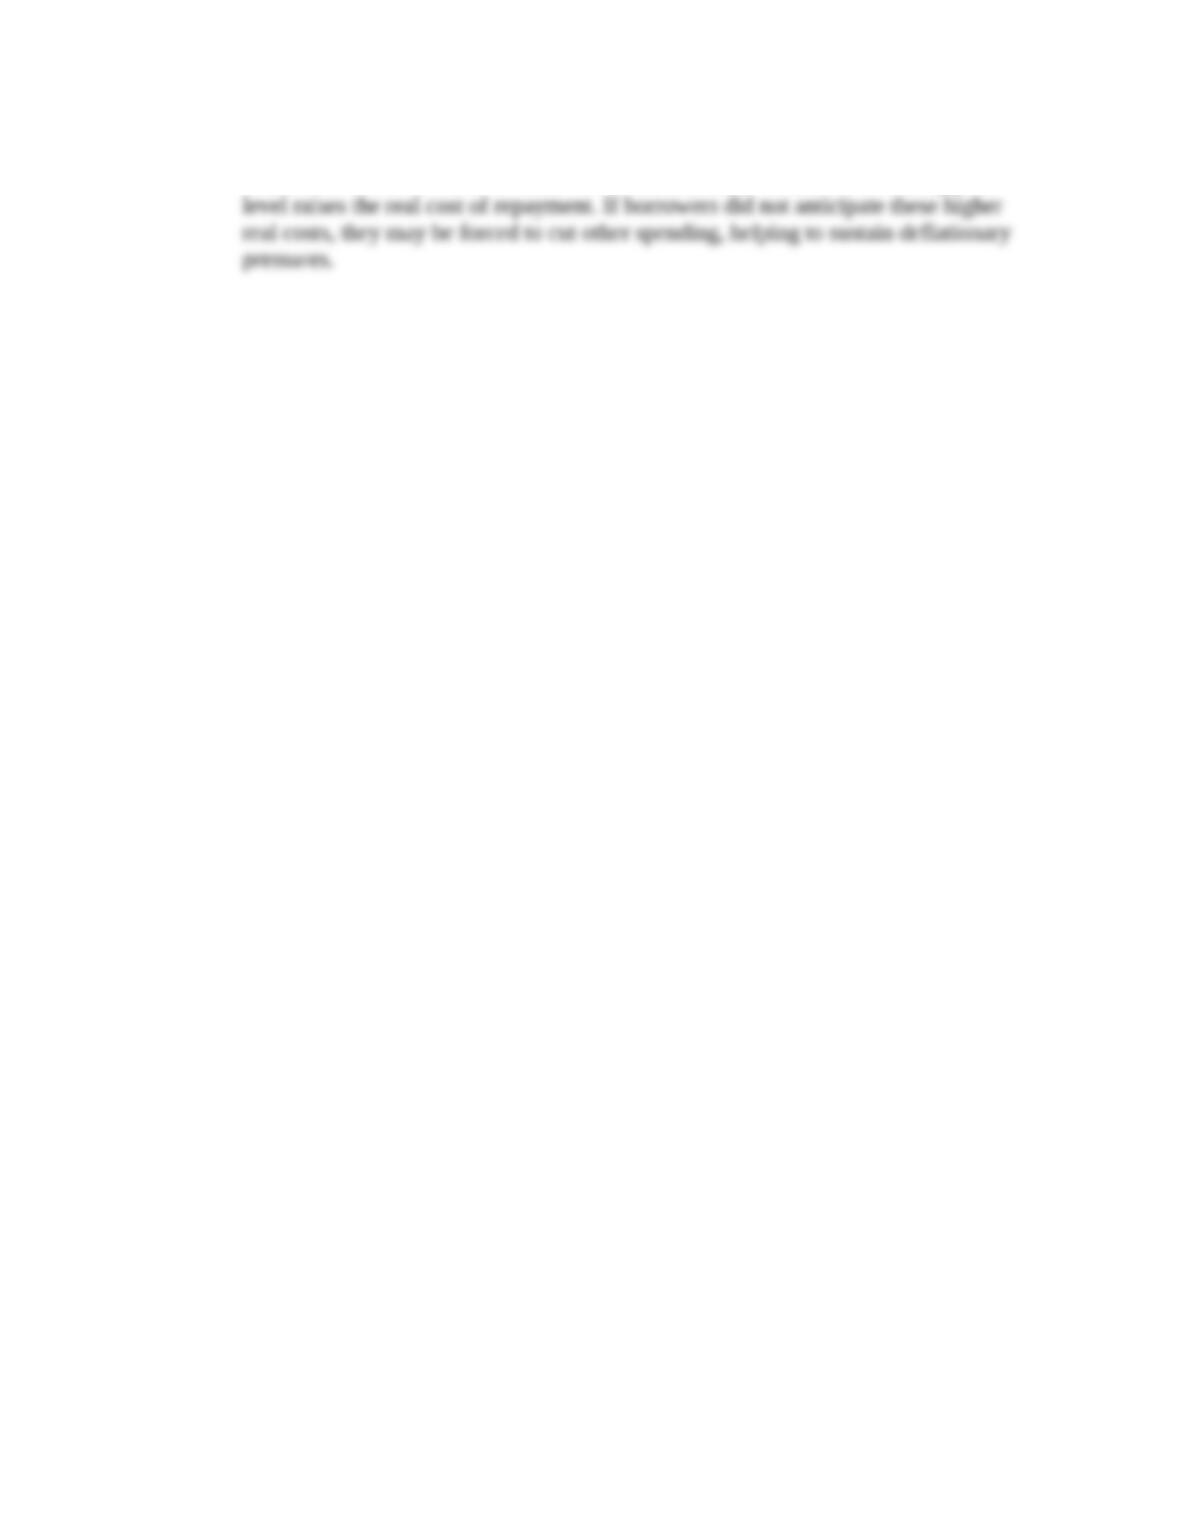
b. Plot on a new graph the percent change from a year ago of the GDP deflator in Japan
(FRED code: JPNGDPDEFQISMEI). How does it compare with the post-1994 evolution
of consumer prices? (Turn off the recession bars.) (Hint: The GDP deflator is a price
index for all final goods and services produced domestically. It is a broader measure than
the price index for goods and services consumed by households in part (a).)
c. Why might deflation become self-perpetuating?
Answer:
a. The plot of inflation based on consumer prices in Japan appears below. Japan
b. The plot of inflation based on Japan’s GDP deflator is below. While this index is
c. When debtors have loans denominated in fixed nominal terms, the declining price
* indicates more difficult problems