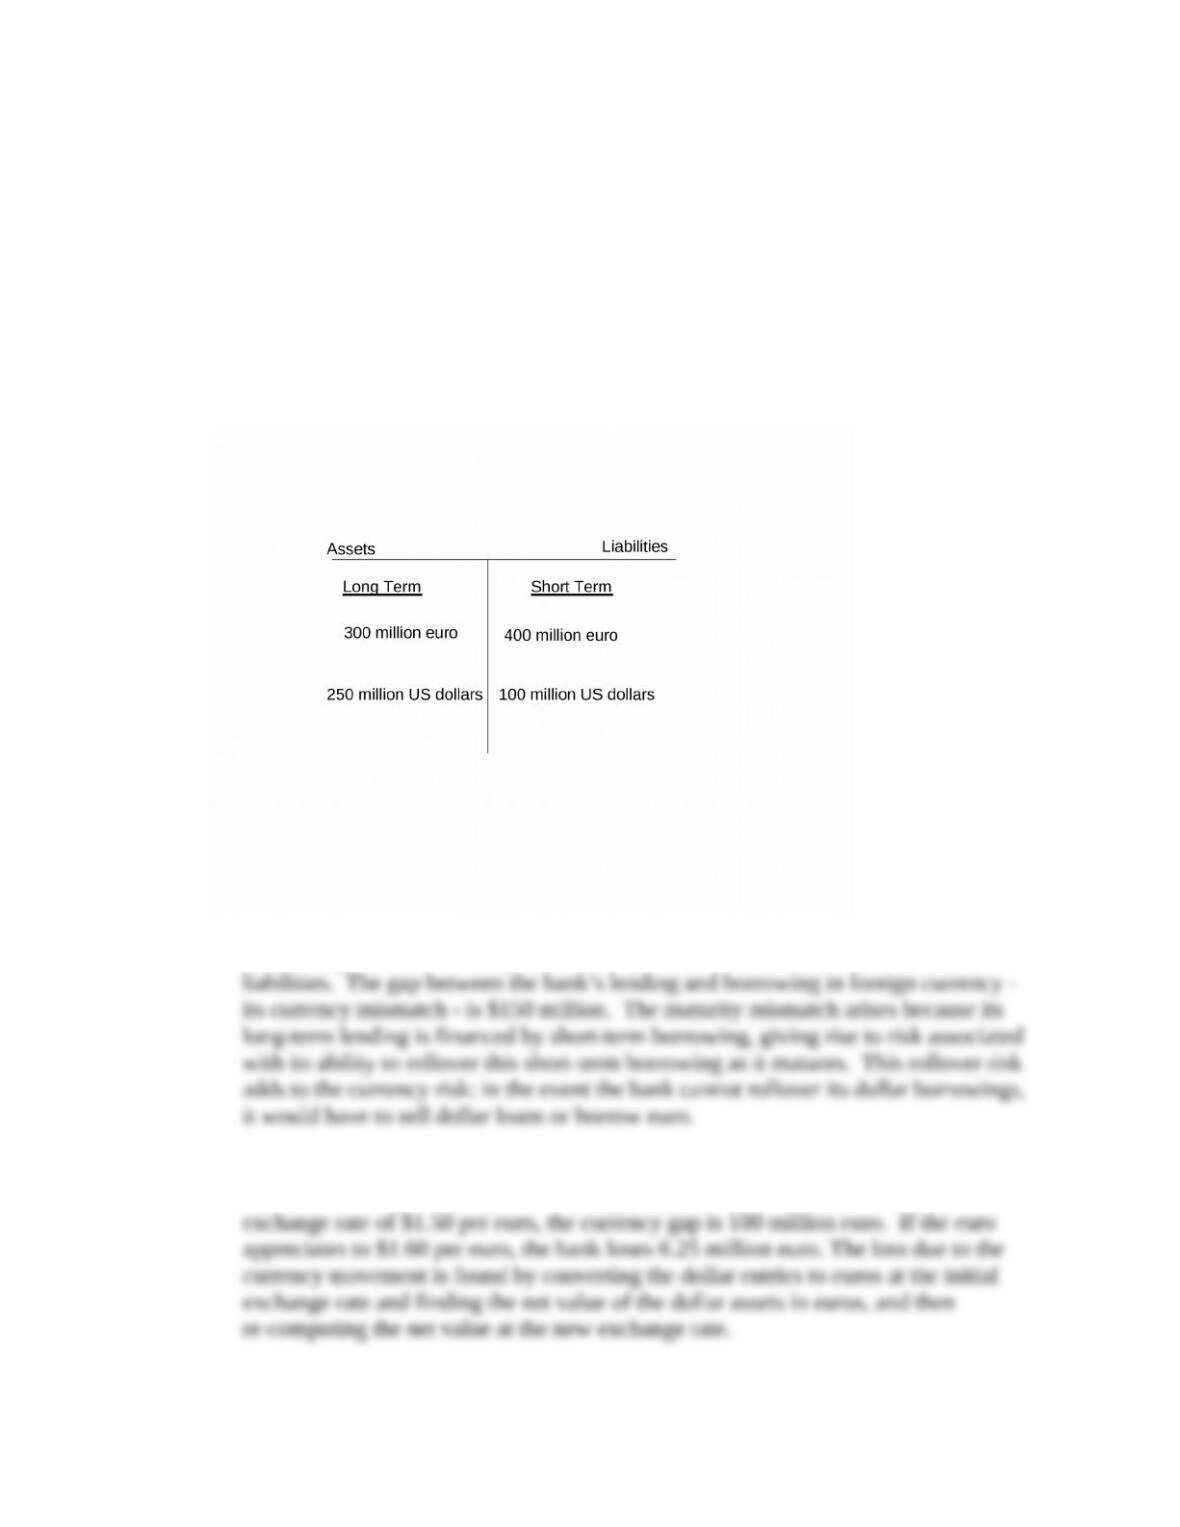
8. Suppose an Italian bank has short-term borrowings of 400 million euro and 100 million
U.S. dollars and made long term loans of 300 million euro and 250 million U.S. dollars. The
euro-dollar exchange rate is initially $1.50 per euro. (LO3)
a. Ignoring other assets and liabilities, place each item on the appropriate side of the
bank’s balance sheet.
b. List the risks that this bank faces.
c. If the euro-dollar exchange rate moved to $1.60 per euro, would the bank gain or
lose? Provide calculations to support your answer.
Answer:
a. In addition to other assets and liabilities, the items appear on the balance sheet as:
b. In addition to the usual default risk, the bank faces both currency risk and rollover
risk arising from the currency and maturity mismatches between its assets and
c. The bank has more dollar-denominated assets than dollar-denominated liabilities, so
when the dollar weakens (the euro strengthens), the bank loses. At the initial
9. *Suppose government officials in a small open economy decided they wanted their
currency to weaken in order to boost exports. What kind of foreign exchange market
intervention would they have to make to cause their currency to depreciate? What would
happen to domestic interest rates in that country if its central bank doesn’t take any action to
offset the impact on interest rates of the foreign exchange intervention? (LO4)
Answer: The government officials would have to sell domestic currency in exchange for
10. Suppose the interest rate on a one-year U.S. bond is 10 percent and the interest rate on an
equivalent Canadian bond is 8 percent. If the interest-rate parity condition holds, is the U.S.
dollar expected to appreciate or depreciate relative to the Canadian dollar over the next year?
Explain your choice. (LO3)
Answer: You would expect the U.S. dollar to depreciate. If the interest parity condition
19. Most countries do not attempt to manage their exchange rates with intervention in the foreign
currency markets, but some do. Under which circumstances is such an intervention likely to
be ineffective? (LO4)
Answer: First, the intervention may fail if the government lacks sufficient resources to
maintain the intended exchange rate. For example, it may need a large quantity of foreign
20. Suppose you see the following newspaper headline: “Japan’s Finance Ministry Sells Yen for
U.S. Dollars.” What is the objective of this policy? If the policy goal is achieved, what will
happen to the prices of Japanese imports to the U.S.? What will happen to the prices of U.S.
goods purchased by residents of Japan? (LO4)
Answer: The policy intervention by the Ministry aims to lower the value of the yen versus
the U.S. dollar by increasing the quantity of yen relative to dollars in the foreign exchange
Data Exploration
1. Exchange rates can experience sudden changes as well as long-run patterns.
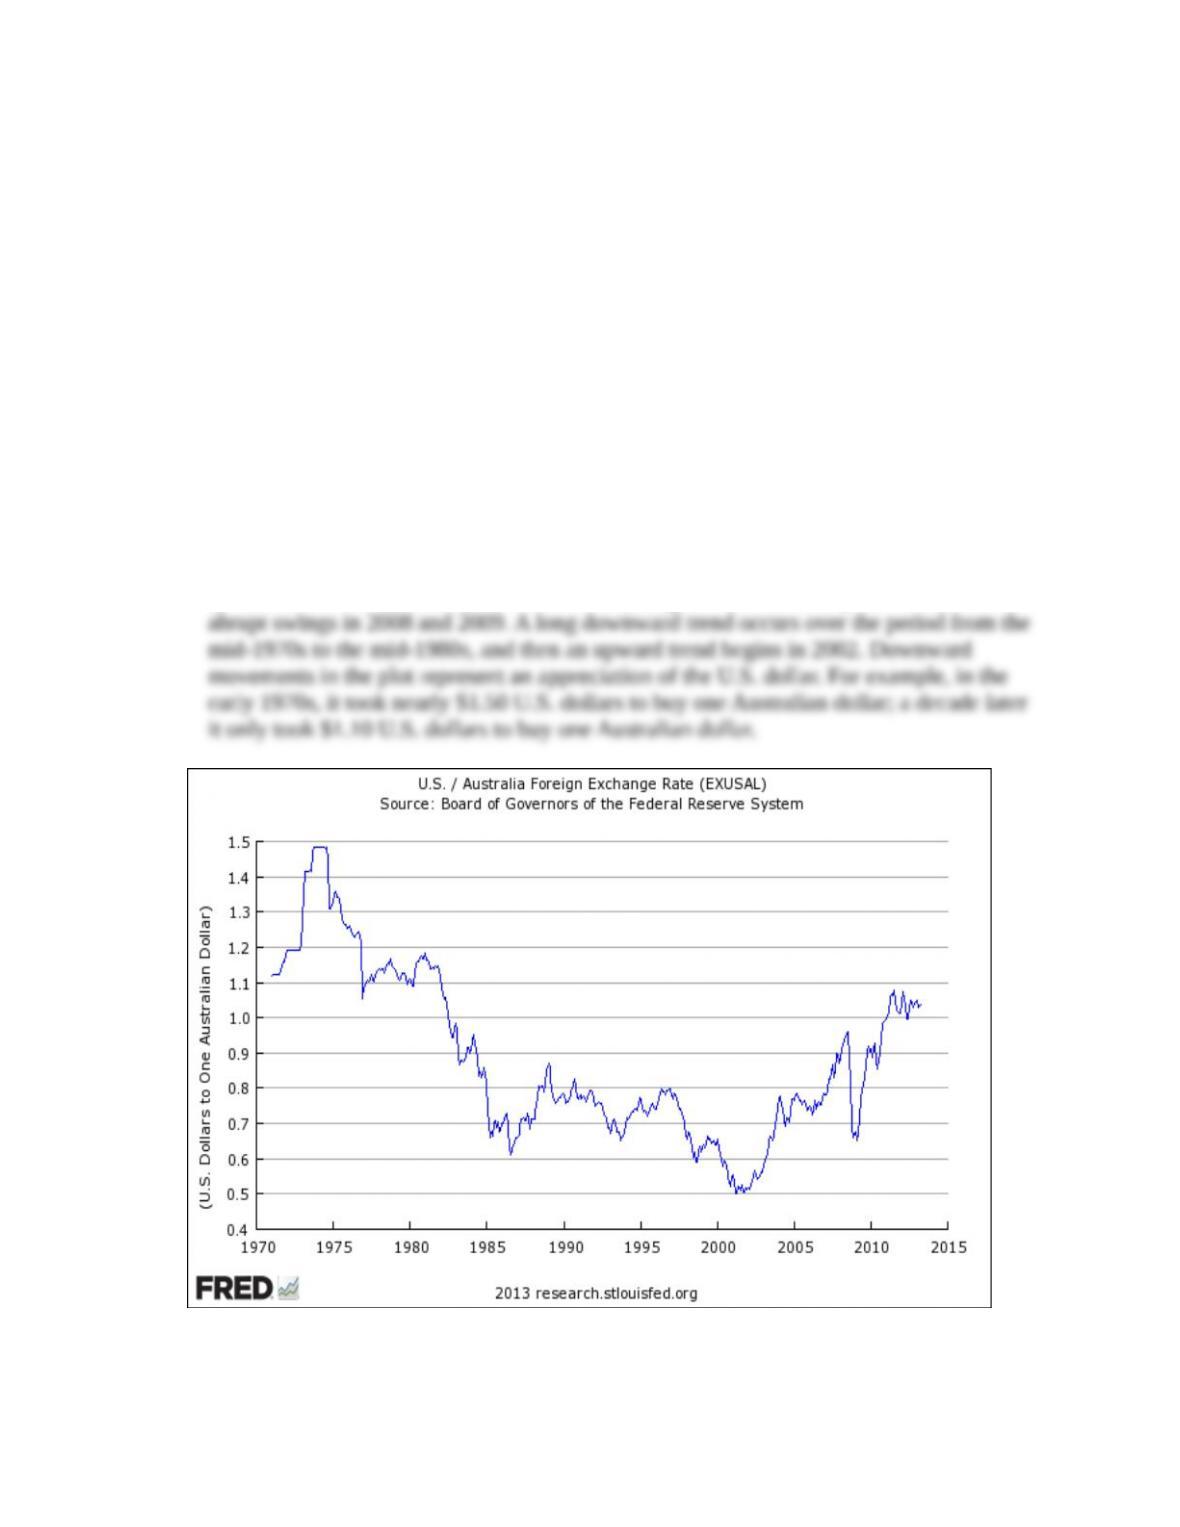
a. Plot the U.S. dollar-Australian dollar exchange rate (FRED code: EXUSAL) without
recession bars and identify long-run swings and short-term spikes. Which currency is
appreciating when the plotted exchange rate falls? (LO1) (Hints: At the FRED Web site,
go to “Data Tools,” and then “Create Your Own Graphs.” On the “Graph” line, select
“Off” at the “Recession Bars” dropdown box. Then select “Add Data Series” and input
the code for the U.S. dollar-Australian dollar exchange rate (FRED code: EXUSAL).)
b. Repeat the exercise for the Japanese yen-U.S. dollar exchange rate (FRED code:
EXJPUS). (Hint: Follow the same procedure as in part (a).)
Answer:
a. The plot for the U.S. dollar-Australian dollar exchange rate is below. Periods of sudden
spikes include the upward spike in 1973, the plunge in late 1976/early 1977 and the
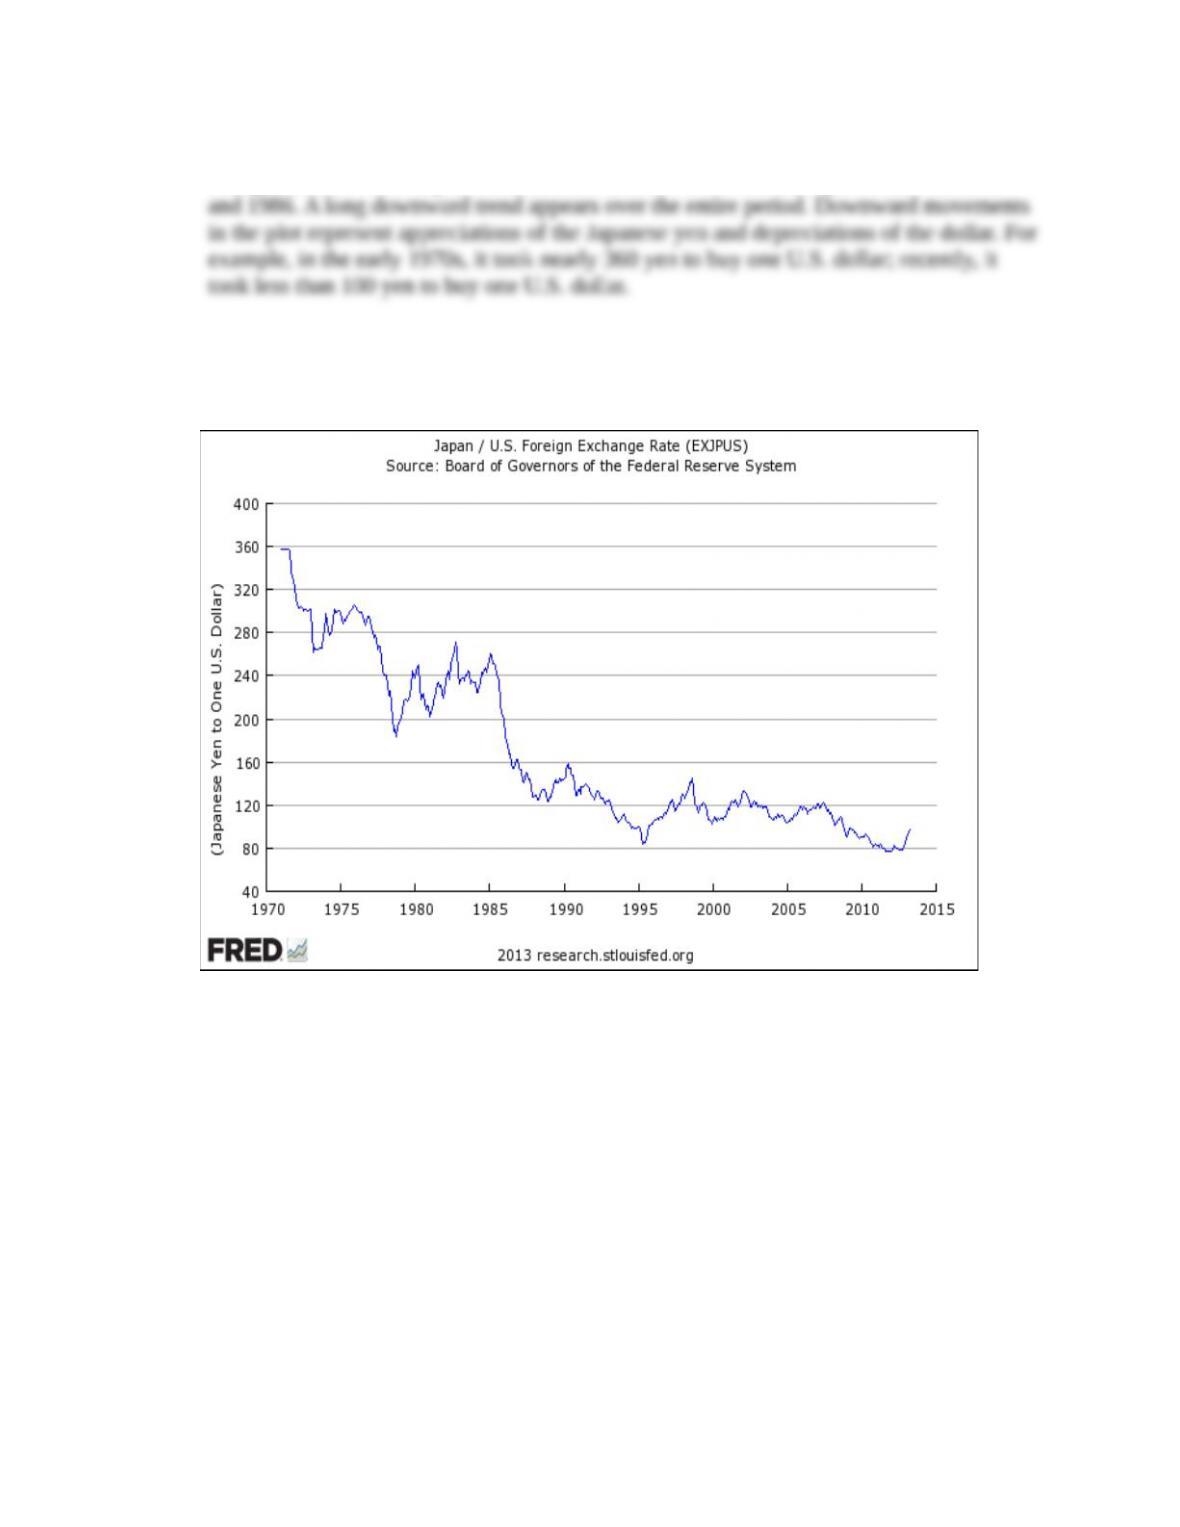
b. The plot for the Japanese yen-U.S. dollar exchange rate is below. Periods of sudden
changes include the sharp downward movement in 1973 and the rapid decline in 1985
Note: In part (a), downward movements represent U.S. dollar appreciations; in (b) downward
movement represent U.S. dollar depreciations. It is important to be careful to notice which
currency is in the numerator of the exchange rate.
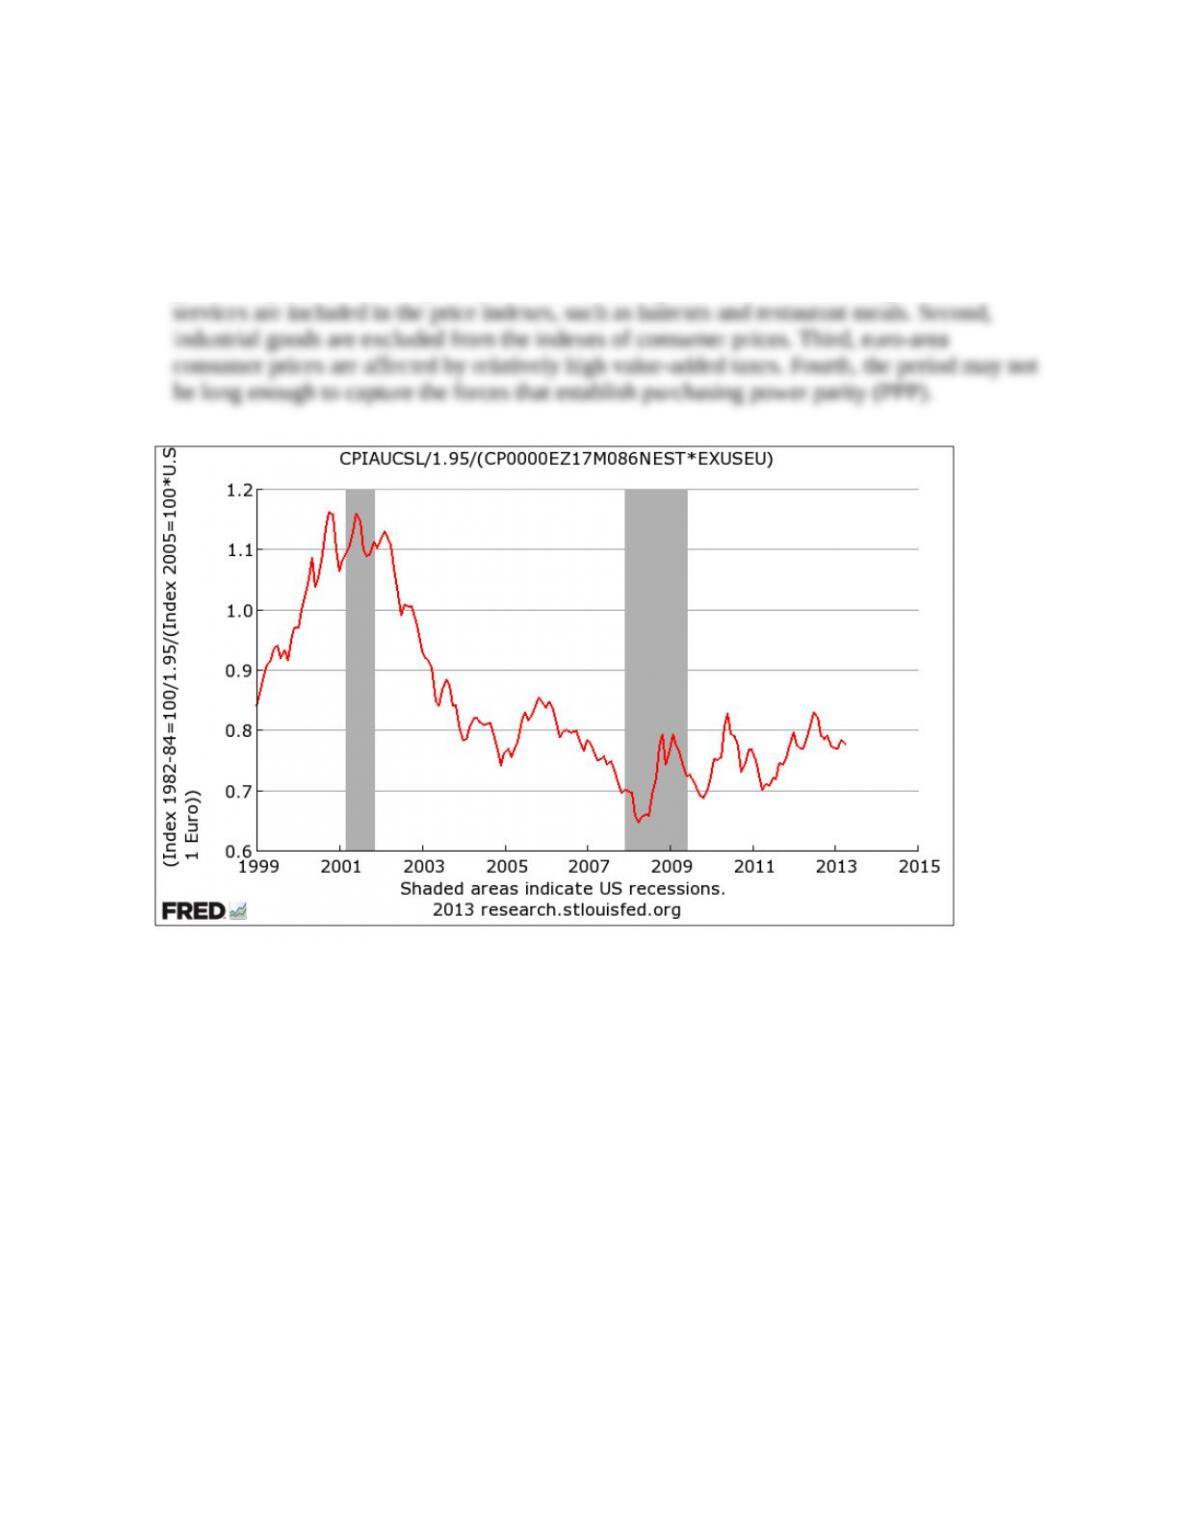
2. Plot since 1999, without recession bars, the real exchange rate between U.S. goods and
euro-area goods according to equation (2) in the text. Use the consumer price index (divided
by 1.95 to set a common base year of 2005 = 100 for the U.S. and euro-area indexes) for the
price of U.S. goods (FRED code: CPIAUCSL), use the harmonized index of consumer prices
for the euro area goods (FRED code: CP0000EZ17M086NEST), and the U.S. dollar-euro
exchange rate (FRED code: EXUSEU). Why might this measure of the real exchange rate be
persistently below unity since 2003? (LO1) (Hints: At the FRED Web site, turn off the
recession bars as in Data Exploration Problem 1. At the “Add Data Series” box, type in the
code for the U.S. consumer price index. Next, select “Add Data Series” and then choose the
“Line 1” button and type in the code for the euro-area index of consumer prices. At the
Formula box, type in “((a/1.95)/b)” (without the quotes) and then “Redraw Graph.” Go
back to “Add Data Series,” select the “Line 1” button again and then type in the exchange
rate code. In the Formula box, divide the prior formula by “c” so that the final formula is
“((a/1.95)/b)/c” (without quotes). Finally, set the “Observation Date Range” to begin at
1999-01-01 and then select “Redraw Graph.”)
Answer: A plot of the data is below. Several reasons may explain the appearance that U.S.
goods are persistently cheap compared to euro-area goods. First, non-traded goods and
3. Write in algebraic form a calculation of U.K pounds per euro that uses U.S. dollars per U.K
pound (FRED code: EXUSUK) and U.S. dollars per euro (FRED code: EXUSEU). Then plot
since 1999 the exchange rate of U.K. pounds per euro using these two U.S. dollar exchange
rates. (LO1) (Hint: Before going to the FRED Web site, write out the units of the U.S. dollar
per euro exchange rate divided by the U.S. dollar per pound exchange rate to see that the
ratio is in units of British pounds per euro. At the FRED Web site, go to “Data Tools” and
then “Create Your Own Graph.” Turn off the recession bars using the procedure described in
Data Exploration question 1. In the “Add Data Series” box, type in the code for the U.S.
dollar-euro exchange rate (FRED code: EXUSEU). Select “Add Data Series” again, choose
the “Line 1” button, and then type in the code for the U.S. dollar-pound exchange rate
(FRED code: EXUSUK). Type in “a/b” (without the quotes) at the Formula box and then set
1999-01-01 as the initial date for the “Observation Date Range.” Select “Redraw Graph.”)
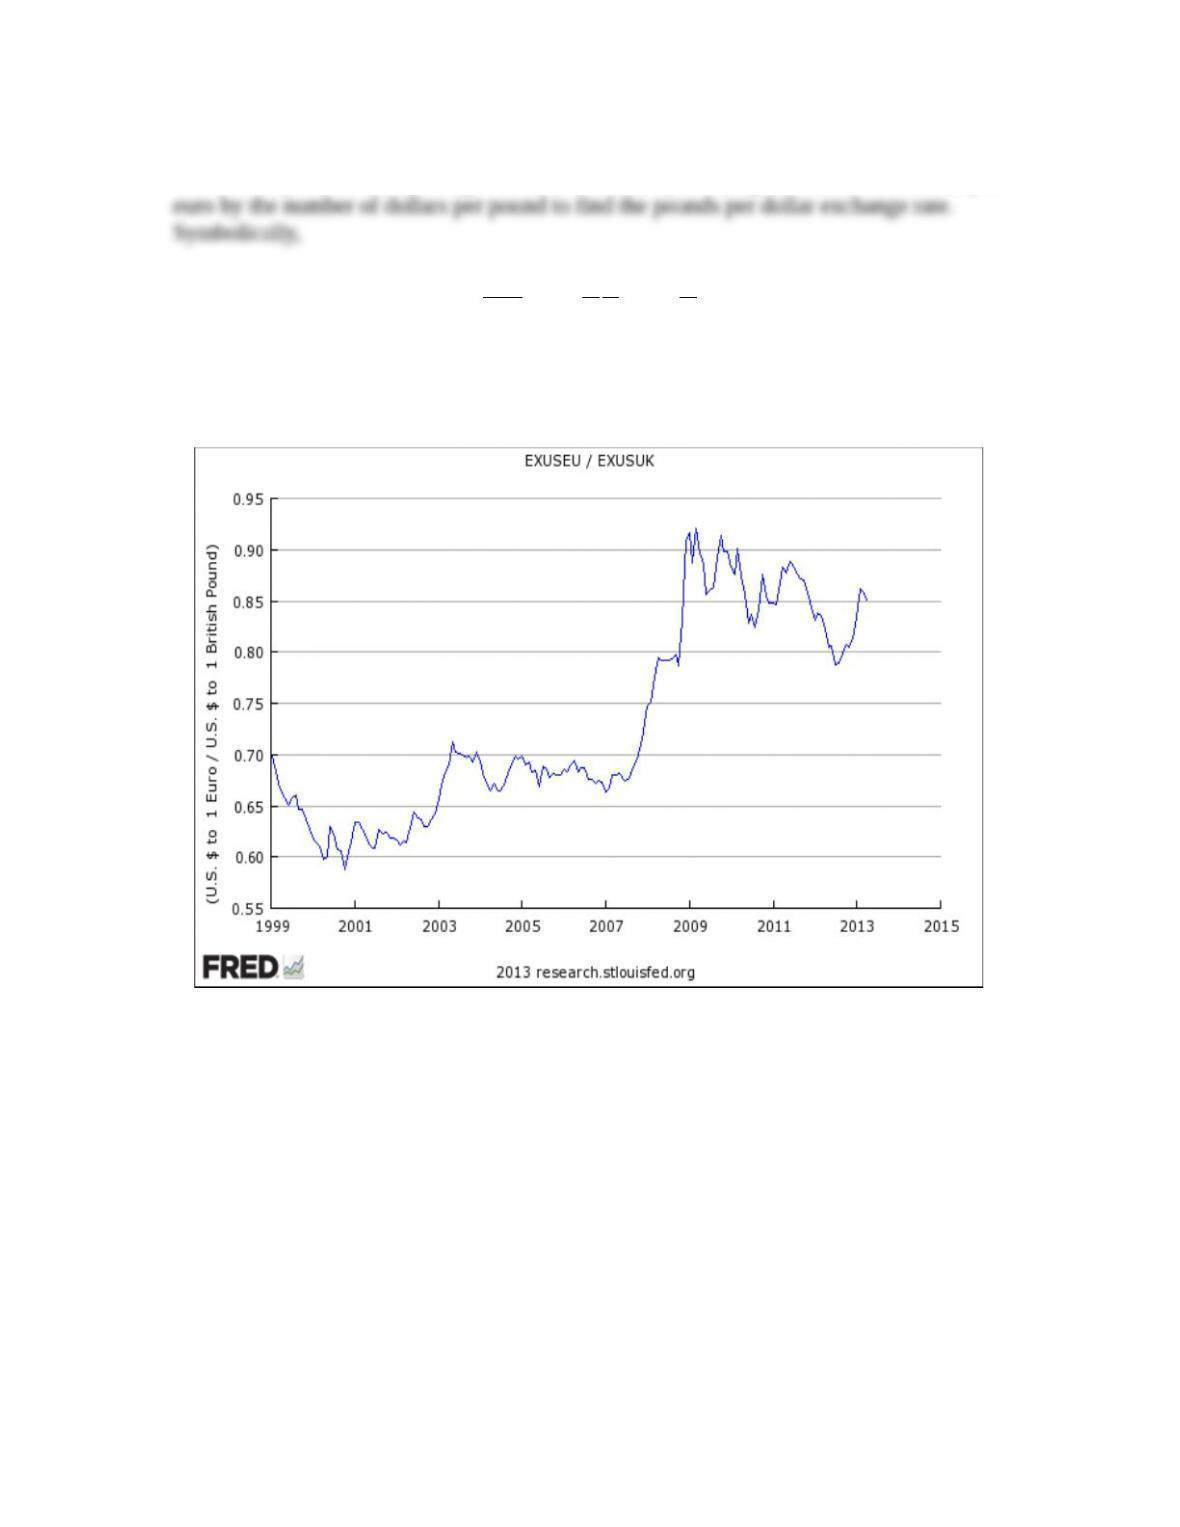
Answer: To find the indicated exchange rate, pay attention to the units in the computation.
The British pound-euro exchange rate can be found by dividing the number of dollars per
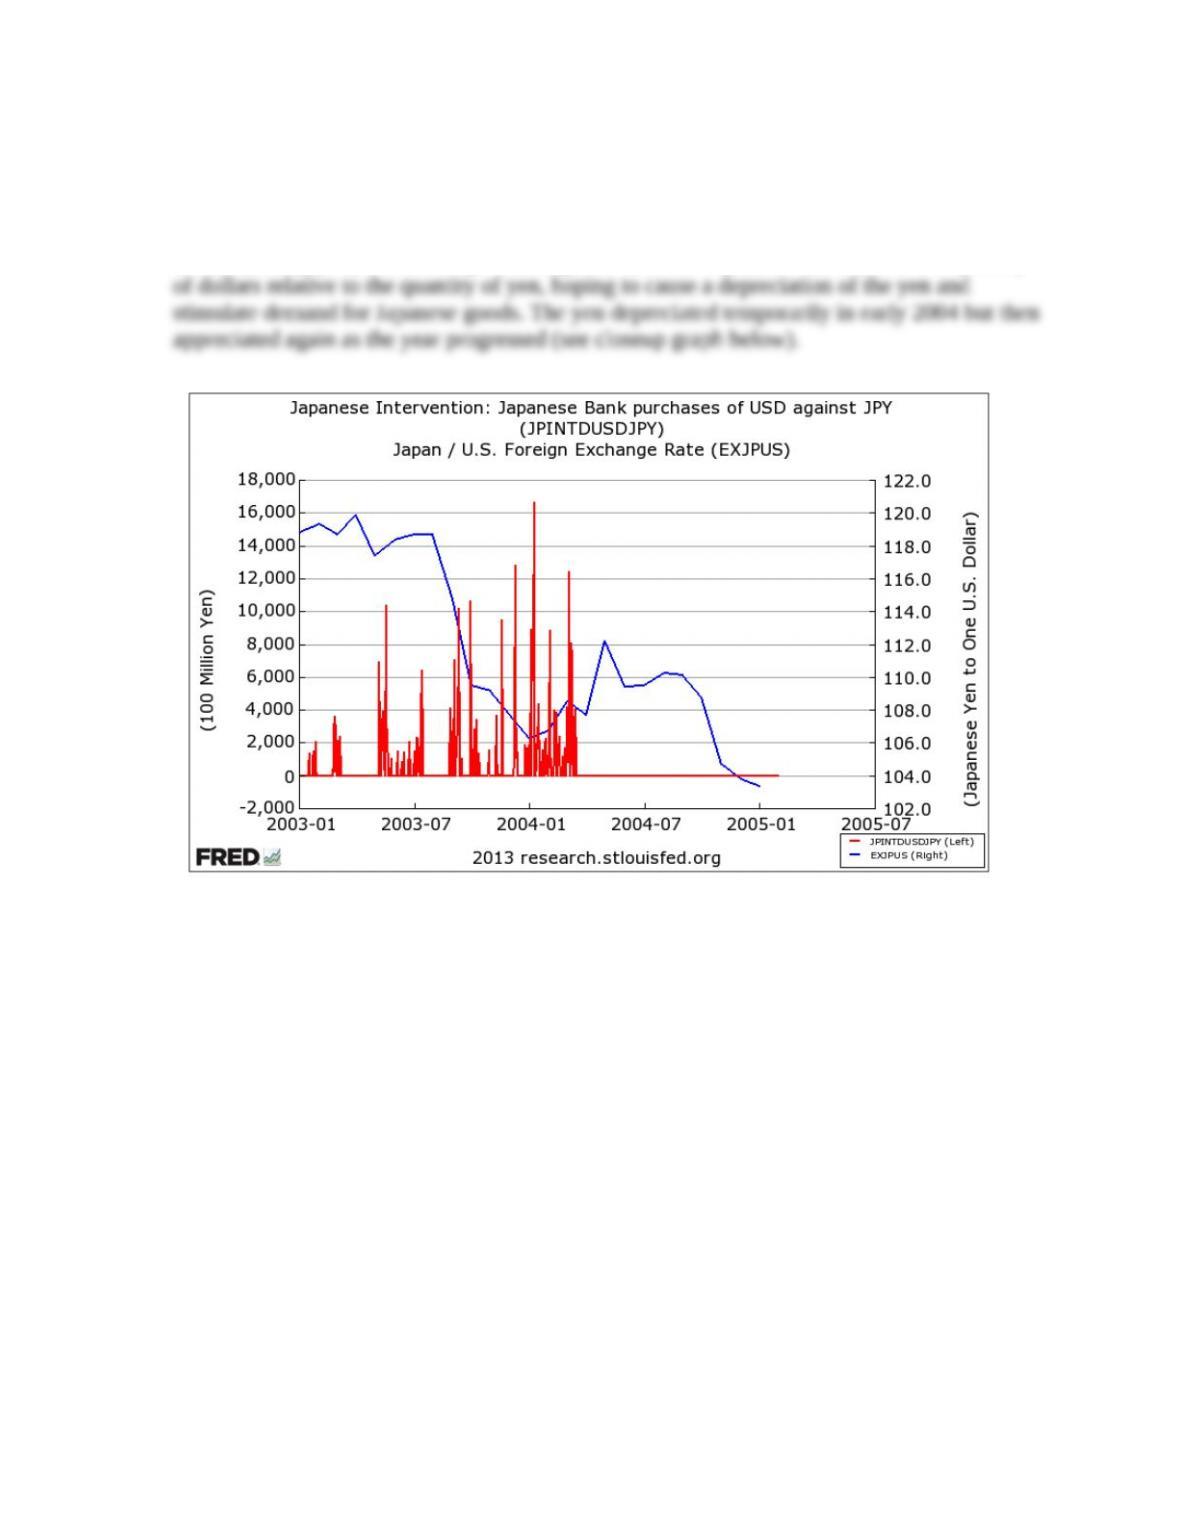
January 2005 in the “Observation Date Range” boxes, and select “Copy to All Lines.” At
the Scale” dropdown box, select “Right,” and then “Redraw Graph.)
Answer: The data plot is below. Positive values mean that the Bank of Japan was buying U.S.
dollars (selling yen) in the foreign exchange market. The objective was to lower the quantity
* indicates more difficult problems